Mapletree Commercial Trust - Investor Presentation 23 June 2021
←
→
Page content transcription
If your browser does not render page correctly, please read the page content below
Mapletree Commercial Trust
           Investor Presentation
                   23 June 2021

                                   0
Important Notice
This presentation is for information only and does not constitute an offer or solicitation of an offer to sell or invitation to
subscribe for or acquire any units in Mapletree Commercial Trust (“MCT”, and the units in MCT, the “Units”).

The past performance of MCT and Mapletree Commercial Trust Management Ltd., in its capacity as manager of MCT (the
“Manager”), is not indicative of the future performance of MCT and the Manager. The value of the Units and the income
derived from them may fall as well as rise. Units are not obligations of, deposits in, or guaranteed by, the Manager or any
of its affiliates. An investment in Units is subject to investment risks, including the possible loss of the principal amount
invested. Investors have no right to request the Manager to redeem their Units while the Units are listed. It is intended that
unitholders may only deal in their Units through trading on the Singapore Exchange Securities Trading Limited (“SGX-
ST”). Listing of the Units on the SGX-ST does not guarantee a liquid market for the Units.

This presentation may also contain forward-looking statements that involve assumptions, risks and uncertainties. Actual
future performance, outcomes and results may differ materially from those expressed in forward-looking statements as a
result of a number of risks, uncertainties and assumptions. Representative examples of these risks, uncertainties and
assumptions include (without limitation) general industry and economic conditions, interest rate trends, cost of capital and
capital availability, competition from similar developments, shifts in expected levels of property rental income, changes in
operating expenses (including employee wages, benefits and training costs), governmental and public policy changes and
the continued availability of financing in the amounts and the terms necessary to support future business. You are
cautioned not to place undue reliance on these forward-looking statements, which are based on the Manager’s current
view of future events.

Nothing in this presentation should be construed as financial, investment, business, legal or tax advice and you should
consult your own independent professional advisors. Neither the Manager nor any of its affiliates, advisers or
representatives shall have any liability whatsoever (in negligence or otherwise) for any loss howsoever arising, whether
directly or indirectly, from any use, reliance or distribution of this presentation or its contents or otherwise arising in
connection with this presentation. This presentation shall be read in conjunction with MCT’s financial results for the
Second Half and Financial Year ended 31 March 2021 in the SGXNet announcement dated 27 April 2021.

                                                                                                                                  1
Content
Overview of SREITs Page 3
Overview of Mapletree Commercial Trust Page 6
Rising Above COVID-19 Page 30
2H and FY20/21 Financial Results Page 35
Other Information Page 46
2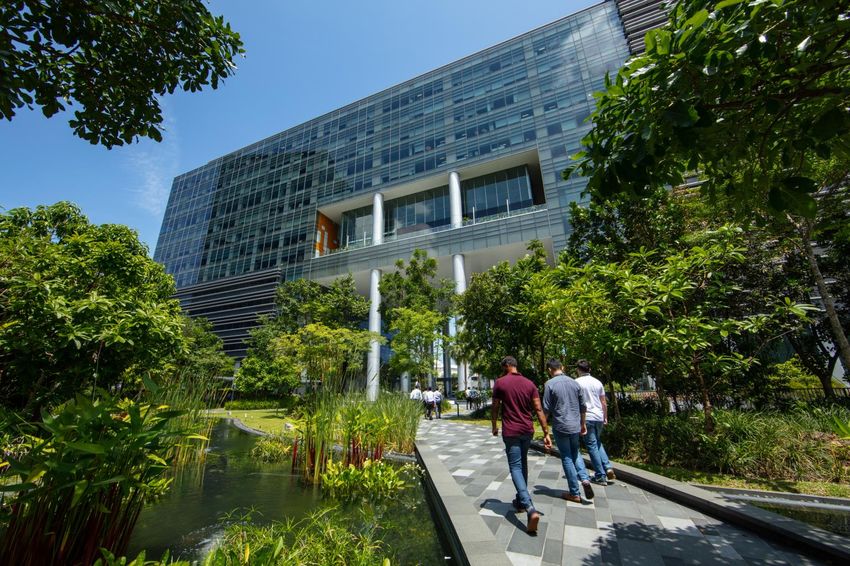
Overview of SREITs/Business Trusts
Total of 40 REITs and Business Trusts listed in Singapore
Combined market capitalisation of S$105.9 bil
Market Capitalisation by Sector
Retail, $10.5 bil, 10% MCT
$7.1 bil, 6.7%
Healthcare, $3.1 bil, 3%
Diversified, $39.7 bil,
37%
Industrial, $38.0 bil,
36%
Office, $7.6 bil, 7%
Hospitality , $7.1 bil, 7%
Diversified Office Hospitality Industrial Healthcare Retail
Note: Based on data from Bloomberg as at 22 June 2021
3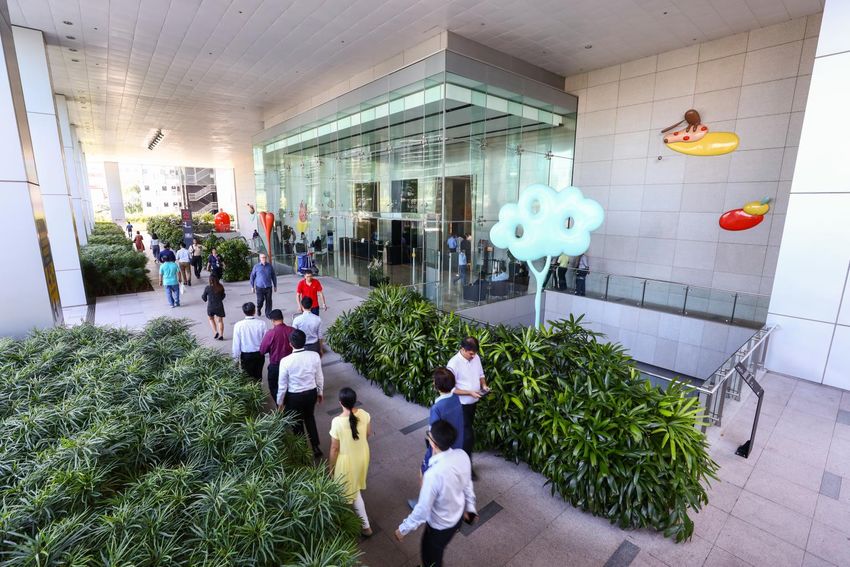
Overview of SREITs/Business Trusts

                                   Market Capitalisation of the 15 largest SREITs (S$ bil)
          14.00   13.60

                           12.18
          12.00

          10.00
                                    8.69

           8.00                             7.39        7.14

           6.00                                                5.06
                                                                      4.34   4.17   4.12   4.11
                                                                                                  3.70
           4.00                                                                                          3.15
                                                                                                                2.69   2.42   2.20
           2.00

           0.00

Note: Based on data from Bloomberg as at 22 June 2021

                                                                                                                                     4
Overview of SREITs – Legislative Comparison
                        Malaysia                    South-Korea                South-Korea             Japan                 Singapore            Thailand              Hong Kong              Taiwan                  Philippines
                                                    (K-REITs)                  (CR-REITs)
Management              External                    Internal/External          Internal/External       External              External             External              Internal/External      Internal/External       External
Structure

Minimum Real            75%                         70%                        70%                     75%                   75%                  75%                   100%                   75%1                    75%
Estate
investments

Foreign Assets          OK                          OK                         OK                      OK                    OK                   OK                    OK                     OK(with Central         Up to 40%
                                                                                                                                                                                               Bank approval)          (with
                                                                                                                                                                                                                       approval)

Development             Up to 10% of total          Up to 30% of total         Prohibited              Prohibited            Up to 25% of         Up to 10% of          Up to 10% of           Up to 15% of net        Prohibited2
                        assets                      assets                                                                   deposited            net asset value       deposited              worth
                                                                                                                             property                                   property

Gearing Limit           50% of total asset          Maximum Debt               No gearing for          No restriction        50% of total         35% of total          45% of total           35% of total            35% of total
                        value                       equity ratio 2:1           investment                                    assets3              assets4               assets                 assets4                 assets4
                                                                               purpose

Payout                  If payout is > 90%,         > 90% of net               > 90% of net            > 90% of              90% of taxable       > 90% of net          > 90% of net           > 90% of taxable        > 90% of net
                        undistributed               income                     income                  taxable               income (no           profit                income after tax       income (post            profit
                        income is tax                                                                  income (post          depreciation)                                                     depreciation)
                        exempted                                                                       depreciation)

Tax                     Yes                         No                         No                      Yes                   Yes                  Yes                   Yes                    Yes                     Yes
Transparency

Tax Concession          Yes, final                  No                         No                      No                    10%                  Non resident          Yes6                   No                      No
for Investor5           withholding tax of                                                                                   withholding tax      individuals and
                        10% for individuals                                                                                  for non              companies are
                        and non-corporate                                                                                    resident             exempt from
                        investors, up to 31                                                                                  companies            Thai tax
                        Dec 2019                                                                                             until Dec 2025

Note 1: Includes cash, government bonds and ABS instruments. SREITs are required to invest 35% in real estate and at least 70% in real estate and real estate-related assets, such as shares of property companies
Note 2: Unless the REIT intends to hold such property post completion and provided that contract value/investment in such property development does not exceed 10% of property deposited
Note 3: MAS had on 16 Apr 2020 raised the leverage limit for REITs listed on SGX from 45% to 50% (up to 31 Dec 2021) and deferred to 1 Jan 2022, the requirement to have a minimum adjusted interest coverage ratio of 2.5 times
before the leverage limit can be increased from the then prevailing 45% limit (up to a maximum of 50%)
Note 4: May exceed 35% gearing cap if the REIT obtains and discloses a credit rating from a major rating agency
Note 5: Tax exemption at REIT level only applicable for distributed income to resident unitholders
Note 6: Exempt for all domestic unitholders, no specific exemption provided for foreign investors, but income from REIT distributions not taxed in practice

Source: UBS Global Research - Singapore Property Report and MAS Code on Collective Investment Schemes
                                                                                                                                                                                                                                     5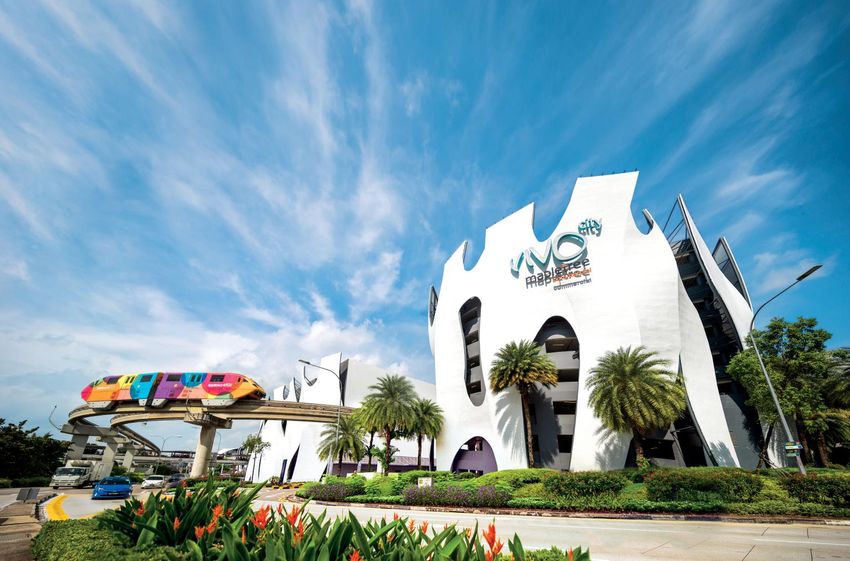
Overview of
Mapletree Commercial Trust

                             VivoCity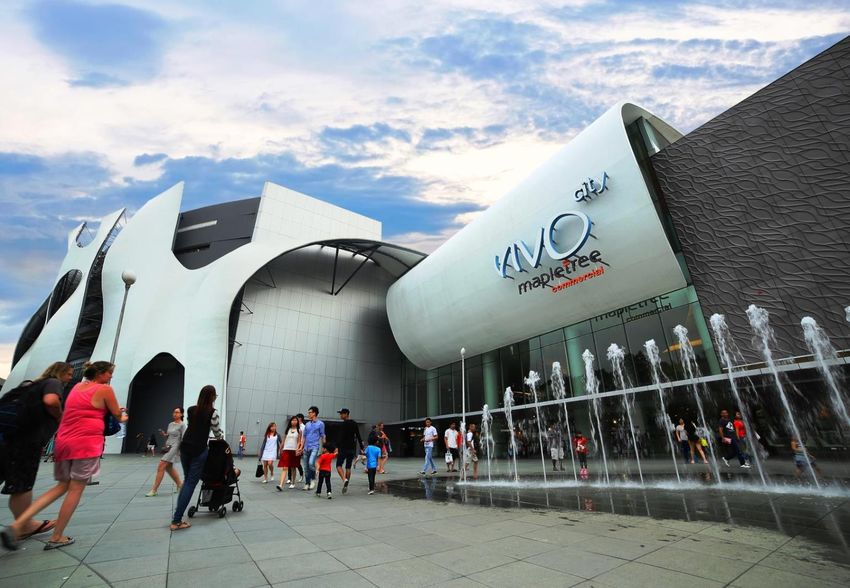
Mapletree Commercial Trust (“MCT”)
Public
Mapletree Commercial Trust Unitholders
MIPL
Mapletree Investments Pte Ltd
Sponsor
(“MIPL” or the “Sponsor”) 67.5% 32.5%1
Mapletree Commercial Trust Management Trustee –
Ltd. (“MCTM” or the “Manager”)
Manager DBS
— Wholly-owned subsidiary of the
Sponsor
Sponsor Stake 32.5%1
Manager –
Primarily retail and / or office assets MCTM
Investment Mandate
in Singapore
Portfolio
5 properties valued at S$8,737 mil Property
Portfolio
Approximately 5.0 mil square feet NLA VivoCity Manager –
Mapletree Business City (“MBC”) MCPM
Mapletree Commercial Property
Management Pte. Ltd. (“MCPM”) mTower2
Property Manager
— Wholly-owned subsidiary of the Mapletree Anson
Sponsor
Bank of America Merrill Lynch HarbourFront
Trustee DBS Trustee Limited (the “Trustee”) (“MLHF”)
Credit Rating Moody’s – Baa1 (stable)
1. As at 12 May 2021
2. Former PSA Building
7
A Snapshot of MCT

           VivoCity                         MBC                           mTower                    Mapletree Anson                       MLHF

                  Key Indicators                                           At IPO                                      As at 31 March 2021

 NLA (‘000 sq ft)                                                          1,6681                                              5,033
                                                                                                     201.7%

 Investment Properties (S$ million)                                        2,822                                               8,737
                                                                                                    209.6%

 Net Asset Value Per Unit (S$)                                              0.91                                                1.72
                                                                                                     89.0%

 Market Capitalisation (S$ million)                                        1,6382                                              7,0303
                                                                                                    329.2%

 Free Float (S$ million)                                                    9494                                               4,7455
                                                                                                    400.0%

 Total returns since IPO (%)                                                  -                                                231.36

1.   Excluding mTower asset enhancement which was deemed to have an expected NLA of 102,505 square feet at the time of IPO
2.   Based on IPO Price of S$0.88 per unit and 1,861 million units in issue
3.   Based on Unit price of S$2.12 as at 31 March 2021 and 3,316.2 million units in issue
4.   Market capitalisation at IPO less the proportion deemed to be held by the Sponsor
5.   Market capitalisation on 31 March 2021 less the proportion deemed to be held by the Sponsor
6.   Comprises 140.9% in capital appreciation gains based on IPO Price of S$0.88 and Unit Price of S$2.12 at close of trading on 31 March 2021
     and 90.4% in distribution gains based on total distributions of 79.55 Singapore cents paid out/payable

                                                                                                                                                 8
Quality Portfolio of
Best-In-Class Commercial
Properties

                           Mapletree Business City
Quality Portfolio of Best-In-Class Commercial Properties
Best-in-class assets constitute close to 80% of MCT’s portfolio and NPI
Portfolio Valuation FY20/21 NPI
79.1% of 80.4% of
Portfolio NPI
3.9% 4.3%
8.5% 7.4%
8.5% 7.8% 33.3%
36.0%
S$8.7bn1 S$377.0mn
17.6% 18.7%
25.5% 28.4%
VivoCity MBC I MBC II
VivoCity MBC I MBC II
mTower Mapletree Anson MLHF
mTower Mapletree Anson MLHF
1. As at 31 March 2021
10Portfolio Location
Includes some of the best-in-class assets
MTOWER
11Portfolio Details
VivoCity MBC
MBC I MBC II
Singapore’s largest mall located in the
MBC, comprising MBC I and MBC II, is a large scale integrated office and business park
HarbourFront Precinct. A 3-storey shopping
development with Grade A building specifications. It comprises one office tower and seven
complex with 2 basement levels and a 8-
business park blocks, supported by ancillary retail space
storey annexe carpark
IPO Asset: 27 April 2011 Acquisition Date: 25 August 2016 Acquisition Date: 1 November 2019
NLA: 1,076,267 square feet NLA: 1,707,202 square feet NLA: 1,184,704 square feet
Number of leases: 352 Number of leases: 39 Number of leases: 48
Title: 99 years commencing from 1 Title: Strata Lease commencing from 25 Title: 99 years commencing from 1
October 1997 August 2016 to 29 September 2096 October 1997
Market valuation: S$3,148 million Market valuation: S$2,226 million Market valuation: S$1,535 million
Note: All information are as at 31 March 2021, except for NLA and number of leases which are as at 31 March 2020
12Portfolio Details
mTower
Mapletree Anson MLHF
(Former PSA Building)
Integrated development comprising a
40-storey office building and a A 19-storey building in the Central Business A 6-storey premium office building with
3-storey retail centre known as the District with Grade A office building basement carpark located in the
Alexandra Retail Centre, located in the specifications HarbourFront Precinct
Alexandra Precinct
IPO Asset: 27 April 2011 Acquisition Date: 4 February 2013 IPO Asset: 27 April 2011
NLA: 523,839 square feet NLA: 328,852 square feet NLA: 215,734 square feet
Number of leases: 115 Number of leases: 23 Number of leases: 3
Title: 99 years commencing from 1 Title: 99 years commencing from 22 Title: 99 years commencing from 1
October 1997 October 2007 October 1997
Market valuation: S$742 million Market valuation: S$747 million Market valuation: S$339 million
Note: All information are as at 31 March 2021, except for NLA and number of leases which are as at 31 March 2020
13Portfolio Valuation
Slight growth in portfolio valuation as compared to 30 September 2020 mostly driven by
compression in capitalisation rates for MBC and MLHF due to market transactions
Valuation as at Valuation as at Valuation as at
31 March 20211 30 September 20201 31 March 20201
S$ million S$ per sq ft NLA Capitalisation Rate (%) S$ million S$ million
VivoCity 3,148.0 2,922 psf 4.625% 3,148.0 3,262.0
Office: 3.80%
MBC I 2,226.0 1,304 psf 2,189.0 2,198.0
Business Park: 4.85%
Business Park: 4.80%
MBC II 1,535.0 1,296 psf 1,534.0 1,560.0
Retail: 4.75%
Office: 4.00%
mTower 742.0 1,411 psf 761.0 791.0
Retail: 4.85%
Mapletree
747.0 2,269 psf 3.50% 747.0 762.0
Anson
MLHF 339.0 1,571 psf 3.80% 338.0 347.0
MCT
8,737.0 8,717.0 8,920.0
Portfolio
1. The valuation for VivoCity was undertaken by Savills Valuation and Professional Services (S) Pte. Ltd., while the valuations for MBC I and II, mTower,
Mapletree Anson and MLHF were undertaken by CBRE Pte. Ltd.
14Established & Trusted
Track Record
Mapletree Business CitySustained Earnings from Healthy Asset Performance
Gross Revenue (S$ mil) Net Property Income (S$ mil)
377.9 377.0
482.8 479.0 347.6
338.8
443.9
433.5
292.3
377.7
220.7
282.5 287.8 211.7
267.2 195.3
219.5 156.0
177.3 124.0
FY11/121 FY12/13 FY13/14 FY14/15 FY15/16 FY16/17 FY17/18 FY18/19 FY19/20 FY20/21 FY11/121 FY12/13 FY13/14 FY14/15 FY15/16 FY16/17 FY17/18 FY18/19 FY19/20 FY20/21
1. FY11/12 – For the period from Listing Date of 27 April 2011 to 31 March 2012
2. Refers to Compound Annual Growth Rate (“CAGR”) from FY11/12 (restated) to FY20/21. FY11/12 (restated) figures are restated from the period from Listing Date to
31 March 2012 to the full period of 1 April 2011 to 31 March 2021 for a comparable basis for CAGR calculation
16Long-term Sustainable Returns to Unitholders
Amount Available Distribution Per Unit
For Distribution (S$ million) (Singapore cents)
9.49 3
9.04 9.14
314.7 3
8.62
8.00 8.13 8.00 3
260.4 264.0 7.372
243.2 3
227.2 6.487
5.271
168.3 172.5
153.0
123.5
98.2
FY11/121 FY12/13 FY13/14 FY14/15 FY15/16 FY16/17 FY17/18 FY18/19 FY19/20 FY20/21 FY11/121 FY12/13 FY13/14 FY14/15 FY15/16 FY16/17 FY17/18 FY18/19 FY19/20 FY20/21
1. FY11/12 – For the period from Listing Date of 27 April 2011 to 31 March 2012
2. Refers to Compound Annual Growth Rate (“CAGR”) from FY11/12 (restated) to FY20/21. FY11/12 (restated) figures are restated from the period from Listing Date to 31
March 2012 to the full period of 1 April 2011 to 31 March 2021 for a comparable basis for CAGR calculation
3. S$43.7 mil of distribution retained in 4Q FY19/20 to better position for COVID-19 uncertainties. Of this, S$28.0 mil was released and included in the FY20/21 distribution
17Solid Track Record of Creating Value
Investment Properties Net Asset Value per Unit
(S$ million) (S$)
1.75 1.72 5
8,920 3 8,737 4 1.6
1.49
1.38
7,039 1.30
1.24
2
6,682
6,337 1.16
1.06
0.95
4,342
1 4,034 4,199
3,831
2,945
FY11/12 FY12/13 FY13/14 FY14/15 FY15/16 FY16/17 FY17/18 FY18/19 FY19/20 FY20/21 FY11/12 FY12/13 FY13/14 FY14/15 FY15/16 FY16/17 FY17/18 FY18/19 FY19/20 FY20/21
1. Reflects acquisition of Mapletree Anson, completed on 4 February 2013
2. Reflects acquisition of MBC I, completed on 25 August 2016
3. Reflects acquisition of MBC II, completed on 1 November 2019
4. Portfolio revalued to S$8.7 bil mainly due to COVID-19 impact. Slight compression in capitalisation rates for MBC and MLHF due to market transactions
5. Consequently, NAV per Unit was S$1.72 as at 31 March 2021
180.0%
50.0%
100.0%
150.0%
200.0%
250.0%
300.0%
Apr-11
Jun-11
Aug-11
Oct-11
Dec-11
Feb-12
Apr-12
Jun-12
S$0.88
Aug-12
Oct-12
Dec-12
Unit Price at IPO
Feb-13
Apr-13
Jun-13
Aug-13
Oct-13
Dec-13
Feb-14
Apr-14
Jun-14
Aug-14
Oct-14
MCT
Dec-14
Feb-15
Apr-15
Jun-15
Aug-15
STI
MCT Unit Price Performance
Oct-15
Dec-15
Feb-16
Apr-16
Jun-16
Aug-16
STI RE
Oct-16
Dec-16
Feb-17
Apr-17
Jun-17
Aug-17
Oct-17
STI REIT
Dec-17
Feb-18
Apr-18
Jun-18
Aug-18
Oct-18
Dec-18
Feb-19
Apr-19
Jun-19
Aug-19
Oct-19
(Relative Price Performance from MCT’s Listing on 27 April 2011 to 22 June 2021)
Dec-19
Feb-20
Apr-20
Jun-20
Aug-20
Oct-20
Dec-20
Feb-21
Apr-21
Jun-21
STI -2.3%
S$2.15
MCT +144.3%
Unit Price on
22 June 2021
STI RE +13.6%
19
STI REIT +28.3%Benchmarking Investment Yields
5.00%
4,5
4.48%
4.50%
4.00%
3.50%
3.00%
2.50% 3
2.50%
2
2.00% 1.74%
1.50%
1.00%
1
0.50% 0.24%
0.00%
Singapore Dollar 12-Months Singapore 10-year Bond Yield Singapore CPF Interest Rate Mapletree Commercial Trust
Deposit Rate (Ordinary Account)
Premium to 12-month Singapore Dollar Deposit Rate ~4.2%
Premium to Singapore 10-Year Bond Yield ~2.7%
Premium to Singapore CPF Interest Rate (Ordinary Account) ~2.0%
1. Source: MAS website, Bank fixed deposit rate (12 months) as at 31 March 2021
2. Source: MAS website, Average buying rates of government securities dealers (10-year bond yield) as at 31 March 2021
3. Source: CPF website, based on CPF interest rate for Ordinary Account (effective for the period 1 January 2021 to 31 March 2021)
4. Based on actual DPU of 9.49 Singapore cents (on a rolling basis for the period 1 April 2020 to 31 March 2021) and the Unit Price of S$2.12 at close of trading on 31 March 2021
5. S$43.7 mil of distribution was retained in 4Q FY19/20 to better position for COVID-19 uncertainties. Of this, S$28.0 mil was released and included in the FY20/21 distribution
20Long-Term Focus on
Resilience & Stability
Bank of America Merrill Lynch HarbourFront
21Long-Term Focus on Resilience And Stability
2015
2014 June
2013 • Completed VivoCity’s 1st
2012 February
November
• Moody’s upgraded AEI to create 15,000 sq ft
2011 August • Raised S$225.0 mil MCT’s Issuer Rating of retail space on
through private to Baa1 (stable) Basement 1
• Set up S$1.0 bil
April multicurrency MTN equity placement • Issued aggregate
• Listed on Main Board of programme • Completed S$250.0 mil MTNs
SGX-ST on 27 April 2011 • Issued Maiden Mapletree Anson (between Nov 2014
S$160.0 mil 3.6% MTN acquisition to Mar 2015) due
November due 2020 Nov 2019, Feb 2023
• mTower’s enhancements and Mar 2023 to
were completed. December refinance existing
• Added 15,000 sq ft of office • Proposed acquisition of debt, and prepay
space and 89,600 sq ft of Mapletree Anson debt
retail space to MCT’s
portfolio
December
• ARC was opened to public
on 15 December 2011
22Long-Term Focus on Resilience And Stability (cont’d)
2020-2021
September
• Reconfigured Level 2 Best Denki
part space to accommodate new
2016 2017 2018 2019 tenant while Best Denki doubled
its shopfront width
July July March January
• Proposed acquisition of MBC I • Completed 3rd AEI • Issued S$120.0 mil, • Completed VivoCity’s 4th AEI December
at VivoCity to 3.28% Fixed Rate to create 24,000 sq ft of retail • Revitalised Level 1 promenade-
August convert 9,200 sq ft of Notes Due 2024 space on Basement 1 and a facing F&B cluster, adding
• Raised S$1.04 bil through equity Level 1 anchor (rated Baa1) for public library on Level 3 prominent F&B names like
fund raising space into specialty refinancing Shake Shack
• Completed MBC I acquisition space May-September
• Moody’s affirmed MCT’s Baa1 June • 24,000 sq ft of recovered April
rating on MBC I acquisition August • Increased MTN anchor space progressively • Existing tenant, adidas, more
• Issued S$175.0 mil, 3.11% Fixed • Issued S$100.0 mil, Programme limit opened with new specialty than doubled its footprint at
Rate Notes Due 2026 (rated 3.045% Fixed Rate from S$1.0 bil to stores. FairPrice Xtra VivoCity by introducing flagship
Baa1) Notes Due 2027 S$3.0 bil officially launched its largest stores for its Originals and
(rated Baa1) for outlet in Singapore on 6 Performance lines
September refinancing August 2019. Completed
• Completed VivoCity’s 2nd AEI to VivoCity’s 5th AEI with March 2020 – April 2021
improve layout and widen F&B October widened retail and F&B • Rendered more than S$70.0mil
offerings at Basement 1 and • Announced 4th AEI offerings at Basement 2 and rental assistance to offset on
Level 3 to add Public Library Level 1 in September 2019 average more than 4 months of
and extend fixed rent for eligible tenants
November Basement 1 in
• Issued S$85.0 mil, 2.795%, VivoCity
Fixed Rate Notes Due 2023
(rated Baa1) for refinancing
23Active Asset Management to
Create Value
VivoCityContinued Enhancements at VivoCity
5th AEI:
2006: VivoCity’s
• Completed changeover of
Official Opening
91,000 sq ft of hypermarket
3rd AEI: space
1st AEI: • Converted 9,200 sq • Converted 24,000 sq ft of
• Created 15,000 sq ft ft of lower to higher- anchor space to accommodate Existing tenant,
of higher-yielding yielding spaces on new/expanding tenants adidas, more than
retail space on B1 L1 & L2 • Delivered positive rental uplift doubled its footprint
2007: Opening of Sentosa • Yielded ~25% ROI on • Yielded ~29% ROI and ~40% ROI based on S$2.2 to introduce two
Express monorail on L3 S$5.5 mil of capex1 on S$3.0 mil capex1 mil of capex1 flagship stores
2006 - 2011 2015 2016 2017 2018 2019 2020 2021
2010: Opening of
Resorts World Sentosa 2nd AEI: 4th AEI: Space Reconfiguration:
• Rejuvenated B2, • Added a 32,000 sq ft • Reconfigured mini-anchor space
increased F&B library on L3 to accommodate online-to-offline
kiosks from 13 to • Added 24,000 sq ft of fashion retailer on L2, with >30%
21 and NLA to extend B1 ROI on S$1.3 mil capex1
• Added popular • Added new escalator • Completed revitalisation of Level
steamboat connecting B1, B2 1 F&B cluster, with expected
restaurant on L3 and L1 + other M&E ~30% ROI on S$700k capex1
2011: Opening of Circle Line at • Yielded ~20% ROI works
HarbourFront Station on S$5.7 mil of • Yielded over 10% ROI
capex1 on S$16.0 mil capex1
1. Return on Investment (“ROI”) on capital expenditure (“capex”) on a stabilised basis
25VivoCity – Further Expansion by Existing Tenant
Following adidas Originals’ flagship store that was opened in December 2020,
adidas launched another flagship store for its Performance line on Level 1
Spanning over 13,000 square feet,
this Performance store is more than
three times its previous footprint
Launched in April 2021, this is the
largest adidas Performance concept
store in Singapore:
Carries the most extensive
collection of Performance
offerings, locally-designed
sportswear, as well as a wide
array of activities for the public Runners Singapore Corner – dedicated space for MakerLab – customisation using digital
runners and fitted with lockers for members’ use tools, heat-press, direct printing and iron-on
Houses five different zones for
kids, different sports and
enthusiasts
Features first-of-its-kind
MakerLab where apparels,
shoes and sports gear can be
customised on the spot
Flagship stores by adidas further
define VivoCity’s position as key
destination mall Carries adidas Performance’s most extensive range of merchandise
26VivoCity – Continuous Effort in Refreshing Tenant Mix
New and exciting concepts to inject novelty
Tamago-EN – Casual egg specialty restaurant, and uses only imported eggs from
Okinawa in its dishes Mango – Leading fashion brand with timeless yet fashion-forward pieces
The Antecedent Store – Homegrown online-to-
Riverside Grilled Fish – Popular Chinese restaurant offline jewelry brand selling accessories inspired OSIM – Local beauty and well-being brand sets
serving Chongqing-styled grilled fish by Eastern and Western cultures up kiosk to showcase their latest gadgets
Note: The above only represents a portion of tenants that were introduced in 2H FY20/21 27Singapore’s Largest Multi-Dimensional Retail
and Lifestyle Destination
A multiple-award winning destination mall
15th South West Public Health Awards – Clean, Dry and Singapore Retail Association 2016 – Best Retail Event of
Sparkling Public Toilets Awards @ Shopping Malls the Year for “Star Wars: The Force Awakens” event –
Winner Finalist
Expat Living Reader’s Choice 2020 – AsiaOne’s People’s Choice Awards 2016 –
Best Shopping Centre – Silver Best Shopping Centre – Finalist
BCA Green Mark Certification – Platinum BCA Green Mark Certification 2016 – Gold
Marketing-Interactive PR Awards 2019 – Her World x Nuyou Mall Awards 2016 – Best Mall (South)/
Best Event-Led PR Campaign for “Disney Tsum Tsum Best Dining Mall (South)/ Best Lifestyle Mall
Mid-Autumn Celebration of Love” event – Silver
Singapore Mother & Baby Award 2015 – Most Family-
Expat Living Reader’s Choice 2019 – Friendly Shopping Mall
Best Shopping Centre – 2nd Place
Trip Advisor 2017 – Certificate of Excellence
28Resilient Office/Business Park Properties
Active management to create value
Proactive retention and early engagement of quality tenants to secure renewals with strong
emphasis on preserving cashflows
Active management to retain attractiveness of buildings
Completed upgrading of common areas and toilets at office floors
Upgrades at mTower:
Before: Lift Lobby After: Lift Lobby
Before: Toilets After: Toilets Self Registration Kiosks
29Rising Above COVID-19
Rising Above COVID-19
Focused on long-term resilience and sustainable returns
Timely boost of resilience from MBC II acquired on 1 November 2019
Diversification of income streams from a best-in-class asset
Long-term Well-diversified portfolio expected to continue to derive stable cashflows from high quality
resilience tenants
Top ten tenants contributed ~28.5%1 of gross rental income
Best-in-class assets will continue to appeal well to reputable tenants
Committed to the sustainability of the retail eco-system
Rolled out one of the most comprehensive tenant support packages in the market
Will continue to work closely with tenants and stakeholders with a view to safeguard the industry’s long-
Proactive asset term health
management
Work continues to strengthen assets for the long run
Managing costs proactively and responsibly
Re-prioritising capital expenditures and enhancing operational efficiencies
Prioritising financial flexibility while taking care of Unitholders
Prudent and Retained S$43.7 million of cash in 4Q FY19/20 as additional reserve for COVID-19 uncertainties.
S$28.0 million of this was released as distribution to Unitholders in FY20/21
disciplined capital
management Strengthened financial flexibility by putting in place more than S$600 mil of cash and undrawn
committed facilities (as at 31 March 2021)
Proactively completed refinancing ahead of time, and maintained well-distributed debt maturity profile
1. As at 31 March 2021, excluding undisclosed tenant
31Assisting Our Tenants to Weather the COVID-19 Headwinds
Rendered more than S$70 mil1 of rental assistance since the start of the pandemic
To help eligible retail tenants offset on average more than 4 months of their fixed rents
Average quantum of rental rebate/waiver
Period
for eligible tenants
March 2020 ~0.5 month
1Q FY20/21 ~2.8 months
2Q FY20/21 ~0.7 month
3Q FY20/21 ~0.2 month2
4Q FY20/21 ~0.2 month2
February March April June December April May
7 February 23 March 7 April – 1 June 2020 2 June 2020 From 28 From 5 Apr From 4 May 2021
2020 2020 Circuit breaker period Easing of circuit breaker December 2020 2021 Tightened circuit breaker measures.
Government No entry or • All non-essential Phase One: Further easing of More Workplace capacity and social
raised transit industries and Safe Re-opening – majority of circuit breaker employees gathering limits reverted to Phase Two
DORSCON through retail shall be business continued to be Phase Three: Safe are allowed re-opening levels
level from Singapore closed closed Nation – increased to return to
yellow to for all • The public is capacity limits for their From 16 May 2021
orange short-term required to stay at From 19 June 2020 events and workplaces Phase Two (Heightened Alert) –
visitors home unless for Further easing of circuit activities Ceased dining-in, reduced social
essential services breaker gathering limits and resumed work-
Phase Two: Safe Transition – from-home as default arrangement,
most businesses allowed to Borders remain closed
resume operations
1. Refers to assistance for eligible retail tenants granted and/or announced to date, and includes the passing on of property tax rebates, cash grants from the
government and other mandated grants to qualifying tenants
2. The assistance for each tenant is calibrated based on their respective actual sales performance and subject to tenant’s acceptance
32FY20/21 Shopper Traffic and Tenant Sales Impacted by COVID-191
Progressive recovery in tandem with phased easing of health and safety measures
4Q FY20/21 tenant sales exceeded 4Q FY19/20 by 5.2%
Shopper Traffic (mil) Tenant Sales (S$ mil)2
50.1% 23.3%
60 1000
907.13
51.5
50
800 209.3
13.1 695.83
40 76.5
600 235.0
30 14.0 183.3
25.7
2.8 400 4Q FY20/21
20 6.8 270.3 tenant sales
14.1 232.2
+5.2% over
200 4Q FY19/20
10 8.5
10.3 193.4 203.4
7.6
0 0
FY19/20 FY20/21 FY19/20 FY20/21
1Q 2Q 3Q 4Q
1. Includes the circuit breaker from 7 April to 1 June 2020 and Phase One easing of circuit breaker from 2 to 18 June 2020 during which the majority of
businesses were closed, as well as prolonged work-from-home directives, restrictions on atrium events and border closures.
2. Includes estimates of tenant sales for a small portion of tenants.
3. Total does not add up due to rounding differences.
33VivoCity – Rebound in Tenant Sales Continue to Outpace Shopper Traffic
4Q FY20/21 tenant sales recovered to more than 86% of 2019 pre-COVID levels
But full recovery expected to take more time given continued COVID-19 uncertainties
Monthly Tenant Sales and Shopper Traffic
(year-on-year comparison)
Heightened
safe distancing Measures such as
140% measures border closures remain
Closure of
120% borders Phase Three of
circuit breaker
re-opening
100% Start of
Phase Two of
circuit
circuit breaker
breaker
re-opening
80%
60%
40%
20%
0%
Jan-20 Feb-20 Mar-20 Apr-20 May-20 Jun-20 Jul-20 Aug-20 Sep-20 Oct-20 Nov-20 Dec-20 Jan-21 Feb-21 Mar-21
Shopper Traffic Shopper Traffic (rebased against 2019)
Tenant Sales Tenant Sales (rebased against 2019)
342H & FY20/21
Highlights
VivoCityKey Highlights
Financial Performance
2H FY20/21 gross revenue and net property income (“NPI”) posted year-on-year growth
mostly due to Mapletree Business City (“MBC”) II’s full period contribution and tapering of
COVID-19 rental rebates
2H FY20/21 distribution per unit (“DPU”) up 57.9% to 5.32 Singapore cents, includes part
release of the retained cash carried forward from 4Q FY19/20
MBC II’s maiden full year contribution provided cushion against COVID-19 impact
Full year DPU totalled 9.49 Singapore cents, up 18.6% year-on-year
Total valuation of investment properties held steady at S$8.7 billion
36Key Highlights
Portfolio Performance
Full year shopper traffic and tenant sales impacted by COVID-19 but progressive recovery
in tandem with phased easing of health and safety measures
VivoCity’s existing tenant, adidas, further expanded and launched its second flagship store
Portfolio achieved 97.1% committed occupancy
MBC continues to be an anchor of stability
Capital Management
Proactive and prudent capital management continues to prioritise financial flexibility
Well-distributed debt maturity profile with no more than 24% of debt due for refinancing in
any financial year
FY21/22 refinancing completed ahead of time
37FY20/21 Financial Performance
Impacted mainly by COVID-19 rental rebates but MBC II’s full year contribution provided cushion
Including part release of the retained cash, FY20/21 DPU up 18.6% to 9.49 Singapore cents 1
S$’000 unless otherwise stated FY20/21 FY19/20 Variance
Gross revenue 478,997 482,825 0.8%
Property operating expenses (101,987) (104,885) 2.8%
Net property income 377,010 377,940 0.2%
Net finance costs (76,094) (77,974) 2.4%
Distributable amount before adjustments
for capital allowance claims and capital 286,720 287,587 0.3%
distribution
Amount available for distribution 314,7201 243,2182 29.4%
Distribution per Unit (cents) 9.491 8.002 18.6%
1. Includes the release of S$28.0 million from the retained cash carried forward from 4Q FY19/20
2. In 4Q FY19/20, MCT made capital allowance claims and retained capital distribution totalling S$43.7 million to conserve liquidity in view of the uncertainty
due to the COVID-19 pandemic
38Balance Sheet
NAV per Unit eased to S$1.72 mainly driven by
year-on-year change in valuation of investment properties due to COVID-19
As at As at
S$’000 unless otherwise stated
31 March 2021 31 March 2020
Investment Properties 8,737,000 8,920,000
Other Assets 213,584 87,071
Total Assets 8,950,584 9,007,071
Net Borrowings 3,029,625 3,008,020
Other Liabilities 211,991 212,103
Net Assets 5,708,968 5,786,948
Units in Issue (’000) 3,316,204 3,307,510
Net Asset Value per Unit (S$) 1.72 1.75
39Key Financial Indicators
Maintained robust balance sheet
Every 25 bps change in Swap Offer Rate estimated to impact DPU by 0.06 cents p.a.
As at As at As at
31 March 2021 31 December 2020 31 March 2020
Total Debt Outstanding S$3,032.9 mil S$3,002.9 mil S$3,003.2 mil
Gearing Ratio 33.9%1 34.0% 33.3%
Interest Coverage Ratio
4.4 times 4.2 times 4.3 times
(12-month trailing basis)
% Fixed Rate Debt 70.7% 71.4% 78.9%
Weighted Average All-In Cost
2.48% 2.51%3 2.94%
of Debt (p.a.)2
Average Term to Maturity of
4.2 years 4.4 years 4.2 years
Debt
Unencumbered Assets as %
100% 100% 100%
of Total Assets
MCT Corporate Rating
Baa1 (negative) Baa1 (negative) Baa1 (stable)
(by Moody’s)
1. Based on total gross borrowings divided by total assets. Correspondingly, the ratio of total gross borrowings to total net assets is 53.1%
2. Including amortised transaction costs
3. Annualised based on YTD ended 31 December 2020
40Debt Maturity Profile (as at 31 March 2021)
Financial flexibility from more than S$600 mil of cash and undrawn committed facilities
Well-distributed debt maturity profile with no more than 24% of debt due in any financial year
Total gross debt: S$3,032.9 mil
Subsequent to the reporting year, S$70.0 mil* of MTN was redeemed, thus completing all refinancing for
FY21/22
725.0 725.0
Bank Debt
Medium Term Note (“MTN”)
Gross Debt (S$ mil)
464.0
550.0
605.0
264.0
255.0
443.9
170.0
250.0
200.0 175.0
85.0 120.0 100.0
70.0*
FY21/22 FY22/23 FY23/24 FY24/25 FY25/26 FY26/27 FY27/28 FY28/29 FY29/30
% of
2% 15% 8% 24% 16% 24% 3% - 8%
Total Debt
41FY20/21 Segmental Results
Full year earnings largely impacted by COVID-19
Cushioned by full year contribution from MBC II and higher income from Mapletree Anson
Gross Revenue Property Expenses Net Property Income
0.8% 2.8% 0.2%
600.0
500.0 482.81 479.01 400.0 377.9 377.01
20.0 19.8 16.2 16.2
31.8 34.5 350.0 25.1 27.9
400.0 50.1 40.2 37.6 29.4
300.0
37.5 120.0 30.2
86.3 104.91 102.0 70.6
3.9 250.0
300.0 100.0 6.7 3.6
132.9 6.6
12.6 10.8 110.1
200.0
128.8 80.0 7.3
15.7 107.2
200.0 150.0
(S$ mil) (S$60.0
mil) 22.8 (S$ mil)
21.6
40.0 100.0
100.0 210.4 158.7
169.3 51.7 125.6
20.0 43.7 50.0
0.0 0.0 0.0
FY19/20 FY20/21 FY19/20 FY20/21 FY19/20 FY20/21
VivoCity MBC I MBC II mTower Mapletree Anson MLHF
1. Total does not add up due to rounding differences
42Portfolio Occupancy
Mutual agreement to terminate a lease at mTower ahead of commencement
Compensation provides more than 16 months of lead time for backfilling
March 2021
March 2020 December 2020
Actual Committed1
VivoCity 99.6% 96.9% 97.1% 99.1%
MBC I 96.4% 95.2% 90.2% 94.6%
MBC II 99.4% 99.9% 100% 100%
mTower 88.1% 71.1%2 75.5%2 91.7%3
Mapletree Anson 97.8% 100% 100% 100%
MLHF 100% 100% 100% 100%
MCT Portfolio 97.1% 94.7% 93.5% 97.1%3
1. As at 31 March 2021
2. Mainly due to the expiry of a major tenant’s short-term lease on 31 August 2020
3. The committed occupancies for mTower and MCT’s portfolio would be 79.7% and 95.9% respectively assuming the lease pre-termination had occurred
before 31 March 2021 and the space had remained uncommitted as at 31 March 2021
43FY20/21 Leasing Update
Portfolio rental reversion impacted by uncertainties associated with COVID-19
Number of Leases Retention Rate % Change in
1
Committed (by NLA) Fixed Rents
Retail 105 80.8% -9.6%2
Office/Business Park 31 75.4% 0.4%3
MCT Portfolio 136 76.4% -3.1%3
1. On committed basis and calculated based on the average fixed rents over the lease periods of the new committed leases divided by the preceding fixed
rents of the expiring leases. Rent reviews are typically not included in such calculations
2. Includes the effect from trade mix changes and units subdivided and/or amalgamated
3. Mainly due to the expiry of a major tenant’s short-term lease at mTower on 31 August 2020 and assuming the pre-terminated tenant had remained
committed to lease part of the space as at 31 March 2021.
• Including the effect of this short-term lease and assuming the pre-terminated tenant had not signed the lease and the space had remained uncommitted
as at 31 March 2021, rental reversion for Office/Business Park and MCT Portfolio would be 3.0% and -1.7% respectively
• Excluding the effect of this short-term lease and assuming the pre-terminated tenant had not signed the lease and the space had remained
uncommitted as at 31 March 2021, rental reversion for Office/Business Park and MCT Portfolio would be 4.5% and -0.9% respectively
44Lease Expiry Profile (as at 31 March 2021)
Portfolio resilience supported by manageable lease expiries
Weighted Average Lease Expiry (“WALE”) Committed Basis
Portfolio 2.4 years1,2
Retail 2.1 years
Office/Business Park 2.7 years2
3
16.1%
As % of Gross Rental Income
12.5% 13.1%
11.4% 11.9%
9.6%
7.7% 7.9%
5.4%
4.5%
FY21/22 FY22/23 FY23/24 FY24/25 FY25/26 & beyond
Retail Office/Business Park
1. Portfolio WALE was 2.1 years based on the date of commencement of leases
2. WALE for MCT’s portfolio and office/business park would be slightly lower by 0.03 year and 0.04 year respectively on a committed basis and assuming the
pre-terminated tenant had not signed its lease at mTower before 31 March 2021 and the space had remained uncommitted as at 31 March 2021
3. The lease expiry profile for Office/Business Park for FY25/26 & beyond would be 15.2% assuming the pre-terminated tenant had not signed its lease at
mTower before 31 March 2021 and the space had remained uncommitted as at 31 March 2021
45Other Information
VivoCity 46Overall Top 10 Tenants (as at 31 March 2021)
Top tenants contributed 28.5%1 of gross rental income
Tenant % of Gross Rental Income
1 Google Asia Pacific Pte. Ltd. 10.7%
2 Merrill Lynch Global Services Pte. Ltd. 3.2%
3 (Undisclosed tenant) -
4 The Hongkong and Shanghai Banking Corporation Limited 2.8%
5 Info-Communications Media Development Authority 2.4%
6 SAP Asia Pte. Ltd. 2.0%
7 Mapletree Investments Pte Ltd 2.0%
8 NTUC Fairprice Co-operative Ltd 1.9%
9 Samsung Asia Pte. Ltd. 1.8%
10 WeWork Singapore Pte. Ltd. 1.7%
Total 28.5%1
1. Excluding the undisclosed tenant
47Portfolio Tenant Trade Mix (as at 31 March 2021)
Trade Mix % of Gross Rental Income
1 IT Services & Consultancy 19.3%
2 F&B 14.1%
3 Banking & Financial Services 10.5%
4 Fashion 7.2%
5 Government Related 6.6%
6 Fashion Related 4.0%
7 Hypermarket / Departmental Store 3.8%
8 Shipping Transport 3.8%
9 Real Estate 3.7%
10 Beauty 3.0%
11 Electronics1 3.0%
12 Pharmaceutical 2.9%
13 Consumer Goods 2.9%
14 Sports 2.1%
15 Electronics2 2.1%
16 Lifestyle 2.1%
17 Others3 8.9%
Total MCT Portfolio 100%
1. Refers to tenants in office/business park
2. Refers to tenants in retail
3. Others includes Trading, Energy, Entertainment, Retail Bank, Optical, Insurance, Education, Medical, Consumer Services, Services and Convenience 48Sentosa
HarbourFront
HarbourFront
Towers 1 & 2
Centre
VivoCity
St James
Power Station
MLHF
49mTower
MBC
50Maxwell
MRT Station
(Expected
Completion 2021)
Downtown MRT
Station
Shenton Way
MRT Station
(Expected
Completion 2021)
Tanjong Pagar
MRT Station
Mapletree Anson
Marina Bay
Station
Prince Edward
MRT Station
(Expected
Completion 2025)
51
Source: www.onemap.com.sg (as at Jul 2020)Pipeline of ROFR Properties
HarbourFront Precinct
1
HarbourFront Tower Two
NLA: 153,000 sq ft
6
2
1 2
3 4 5
HarbourFront Tower One
NLA: 368,000 sq ft
3
Investment Criteria for ROFR and Third-Party Acquisitions
Value Accretions
Yield Thresholds
Asset Quality (e.g. location, enhancement potentials, building
SPI Development Site1
specifications, tenant and occupancy profile)
GFA: 344,000 sq ft
Alexandra Precinct
4 5 6
HarbourFront Centre St James Power Station PSA Vista
NLA: 715,000 sq ft NLA: 119,000 sq ft NLA: 145,000 sq ft
Note: GFA and NLA are as published in Mapletree Investment Private Limited’s Annual Report 2019/2020 and rounded to the nearest thousand sq ft
1. Known as Proposed Mapletree Lighthouse in MCT’s IPO Prospectus 52Thank You
For enquiries, please contact:
Teng Li Yeng
Investor Relations
Tel: +65 6377 6836
Email: teng.liyeng@mapletree.com.sg
53You can also read