Nareit REITworld NOVEMBER 2020 - Park Hotels & Resorts
←
→
Page content transcription
If your browser does not render page correctly, please read the page content below

Nareit REITworld NOVEMBER 2020

Park Hotels & Resorts

            Mission              Investment Strategy          Guiding Principles

       To be the preeminent       Upper-Upscale & Luxury           Aggressive
     lodging REIT, focused on          Full-Service            Asset Management
      consistently delivering
      superior, risk -adjusted
                                 Premiere Urban and Resort           Prudent
     returns for stockholders
        through active asset           Destinations             Capital Allocation
         management and a
        thoughtful external      Affiliation with Dominant   Maintain Low Leverage &
      growth strategy, while            Global Brands         Flexible Balance Sheet
     maintaining a strong and
      flexible balance sheet

2|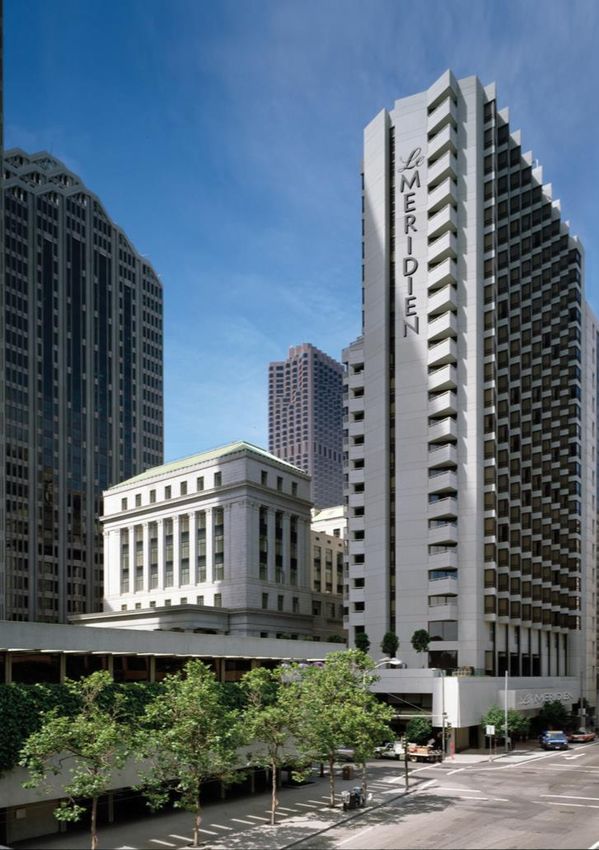
Park at a Glance
                                                                                                    Company Overview
                                  Currently the second largest publicly traded lodging REIT, Park owns a portfolio of 60 premium-branded
                                  hotels and resorts with over 33,000 rooms primarily located in prime city center and resort locations. Top
Hyatt Regency Boston              markets include Honolulu, San Francisco, Orlando, New Orleans, Boston, Chicago, NYC, Denver, San Diego                                                      Parc 55
                                  and Key West.

                                                Portfolio Quality (Core 30)                                                                         Discounted Valuation
                                  ▪        ‘19 RevPAR: $204 ($20 higher than peers)                                              ▪       Replacement cost of $19.7B, or $650/key(1)
JW Marriott San Francisco         ▪        ‘19 EBITDA/Key: $35,500 (14% above peers)                                             ▪       Trades at 63% discount to replacement cost(2)        Hilton Denver City Center

                                                 Balance Sheet & Liquidity                                                                            Operational Update
                              ▪ Net debt was $4.2B as of September 30, 2020                                                     ▪ 49 of 60 hotels currently open
                              ▪ $1.6B of liquidity; $50M monthly burn rate                                                      ▪ October occupancy at 43% (3)
Hilton Chicago                  equating to 32 months of liquidity runway                                                       ▪ 12 hotels at Break-even EBITDA in Q3 2020                   Royal Palm South Beach
                              ▪ Less than 2% of debt maturing through 2022

                                             Geographic Diversification(4)                                                                               Brand Diversity(5)
                                                                  Other
                                                                                                                                                                             1%               Hilton Checkers LA
Hotel Adagio, Autograph                                                   12%
                                                   San Diego                                        Hawaii
                                                                                                                                                                4%
                                                    Denver   2%                              25%
                                                    DC
                                                           2%                                                                                          10%
                                                           3%
                                                Miani
                                                         3%
                                             Key West 3%

                                                         5%
                                                                                                                                                                                        85%
                                             Chicago
Le Meridien San Francisco                                                                                                                                                                     The Reach, Curio Collection
                                                           5%
                                                                                                18%
                                                   NYC
                                                                  6%                                   San Fran
                                                         Boston
                                                                          6%
                                                                                10%
                                                                New Orleans
                                                                                  Orlando

                            (1)       The replacement cost estimates are based on Park internal analysis and recent construction market pricing. Estimated land values are based on
Hilton Riverside                      market data and recent comparable sales where applicable. This estimate is not intended to be an estimate for the fair market value of the portfolio    Hyatt Regency Mission Bay
                            (2)       Based on market capitalization as of 11/11/20
                            (3)       Reflects Park’s consolidated hotels open for the entirety of the month (excludes hotels opened mid-month)
   6 3|                     (4)       Based on 2019 Proforma Hotel Adjusted EBITDA
                            (5)       Based on 2019 Proforma portfolio rooms
Iconic Portfolio: Urban and Resort Destinations

Hilton Hawaiian Village Waikiki Beach Resort                           Hilton San Francisco Union Square       Royal Palm South Beach Miami

Hilton Denver City Center               Le Meridien San Francisco

                                                                       Waldorf Astoria Orlando

JW Marriott SF Union Square             Hilton New Orleans Riverside

Hilton Chicago                         W Chicago – City Center         Casa Marina, A Waldorf Astoria Resort   New York Hilton Midtown

    4|
Park Portfolio Post-Spin Transformation
    Since Park’s spin from Hilton in January 2017, Park has made significant progress in improving the quality and
                                   profitability of the company over the last 3+ years
   ✓ Sold or disposed of 24(1) lower quality, non-core legacy assets, including 14 international hotels
   ✓ Outperformed peers in top-line growth and margin expansion
   ✓ Enhanced and diversified portfolio with acquisition of 18-hotel Chesapeake (CHSP) portfolio(2)
                                                                                                               @ Spin
                                                       3-Year Performance                                                                2019(4)       Change
                                                                                                              (2016)(3)
                                            Number of Hotels                                                       67                        60         -10%
                                            # of International Hotels                                              14                         0         -100%
                                            $ Comp. RevPAR(5)                                                     $161                     $186         +16%
                                            Comp. Hotel Adj. EBITDA Margins(5)                                   27.7%                     29.5%       +180bps
                                            Comp. Hotel Adj. EBITDA per Key(5)                                  $25,100                  $30,600        +22%
                                            % Rooms Represented by Hilton                                        100%                       85%        -15% pts

Hilton Orlando Bonnet Creek

          (1)   Figure excludes one hotel, Hilton Chicago O’Hare Airport, which was subject to a ground lease that expired at the end of 2018
          (2)   Subsequently sold 2 assets
          (3)   As reported in Park’s Fourth Quarter and Full Year 2016 Earnings Press release on 3/1/17
     5|   (4)   Figures exclude Hilton Sao Paulo Morumbi and the Embassy Suites – Washington, D.C. Georgetown, which were sold in February 2020
          (5)   The pro-forma comparable portfolios in 2016 and 2019 represent the comparable portfolio at each specified period as of December 31st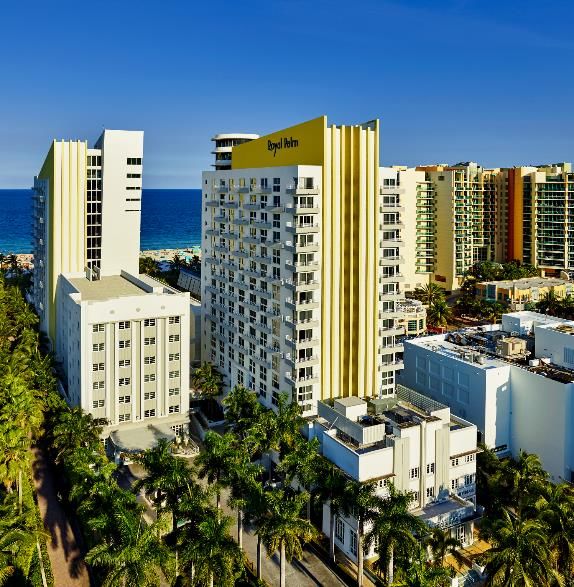
Near Term Priorities
                 Park remains laser-focused on the following priorities as it navigates through the pandemic
                                    and the expected eventual lodging industry recovery

                                                                      ▪     Re-open hotels safely and when market conditions and economics warrant
     1            OPEN HOTELS                                         ▪     49 of 60 hotels currently open; Hawaiian Village expected to open in December; 10 remaining
                                                                            hotels expected to open Q1 2021

                                                                     ▪     Occupancy has increased from 14% in April to 43% in October(1)
                IMPROVE
                                                                     ▪     12 hotels generated positive EBITDA for Q3 2020
     2          OCCUPANCY AND
                                                                     ▪     Continue to reduce burn rate by identifying additional cost containment measures and by safely
                REDUCE BURN RATE                                           and prudently re-opening hotels

                                                                      ▪     Permanent reduction of full-time, hotel-level staffing resulting in $70M annual savings
                                                                      ▪     Reduction expected in above-property cost allocations; increased productivity from opt-in stay
     3           IMPROVE                                                    over cleaning; right-sizing of F&B operations
                 OPERATING MODEL                                      ▪     Partner with brands to re-assess brand standards to achieve operational efficiencies while
                                                                            maintaining market share premiums

     4           DELEVER THE                                          ▪     Repay revolver as portfolio reopens and approaches break-even
                 BALANCE SHEET                                        ▪     Opportunistically explore asset sales to further right-size balance sheet

                                                                      ▪     Identify acquisition opportunities of distressed/discounted assets that align with Park’s investment
                 TRANSITION TO
     5           OFFENSE
                                                                            strategy
                                                                      ▪     Equitize transactions to de-lever the balance sheet over the long term

6|       (1)   Reflects Park’s consolidated hotels open for the entirety of the month (excludes hotels opened mid-month)
Investment Highlights

     Decisive Actions to Mitigate Impact of COVID-19

     Iconic Portfolio of Irreplaceable Assets Trading at a Significant Discount

     Opportunity to Right-Size Hotel Operating Model

     Embedded Opportunities to Enhance Value

     Strong and Flexible Balance Sheet with Ample Liquidity

     Seasoned & Experienced Management Team with Demonstrated Track Record

     Strong Corporate Governance and ESG Focus

7|
COVID-19 Update

Operations
✓ Suspended operations at 38 of 60 hotels, reduced expenses by over 75% and
  reduced budgeted capex from $200 million to $50 million at outset of crisis
✓ Commenced the phased reopening of 27 of our previously suspended hotels,
  increasing the total number of hotels currently open to 49, or 66% of room count;
  expect to have 50 hotels open by YE20, accounting for 74% of room count
                                                                                           Hilton Orlando Bonnet Creek
✓ Reduced monthly burn rate to approximately $50 million (as of Sept 2020) through
  further cost containment strategies and thoughtful re-opening of hotels
✓ Contracted alternative sources of revenue related to COVID response efforts from a
  variety of clientele including health/medical institutions and personnel, universities
  and professional sports associations

Balance Sheet and Liquidity
                                                                                           Waldorf Astoria Orlando Golf Club

✓ Secured financial covenant relief for corporate credit facilities through March 2022
  and partially extended Revolver maturity to December 2023
✓ In May, issued $650 million of 5-year senior secured notes, followed by $725 million
  of 8-year senior secured notes in September. Total proceeds were used to paydown
  over $1 billion of debt, while materially enhancing the company’s liquidity and debt
  maturity profile
✓ Total liquidity of $1.6 billion as of September; based on current burn rate, Park has    Hilton Checkers Los Angeles

  over 32 months of liquidity runway

 8|
COVID-19 Update

                               By October, Park had 47 of 60 hotels open with average occupancy of 43%

                                                                                                                                                                      42%    43%
                                                                                                                                                    39%

                           60                                                                                                            32%
                                                                                                                        30%

                                                                                                                                                                              47
(1)

                            20                                                                                                                                         46
 Number of Hotels

                                                                                                20%                                      42         44

                                                                                                                                                                       17     17
                                                                         14%                                             32               16         16
                            13
                                                                          25                     22                      14                                                   11
                                                                                                                                                     10                10
                                                                          12                                                              10                    (2)

                                                                                                  11
                            27                                                                                            8
                                                                           4                       3                                                 18                19     19
                                                                                                                                          16
                                                                           9                       8                     10

                          Total                                          Apr                    May                     Jun              Jul        Aug               Sep    Oct
                                                                                                                                                          (2)
                                                                          Urban               Resort               Suburban/Airport            Occupancy

                                                                          Apr                   May                     Jun              Jul        Aug               Sept   Oct
                    Total Occupancy %(3)                                   4%                     5%                   10%               15%        20%               22%    23%
                    # of Break-Even Hotels(3)                                1                     2                      7              11          11                13    NA

                    (1)   Includes consolidated and unconsolidated hotels open during each month, including hotels reopened mid-month
      9|            (2)   Reflects occupancy of Park’s consolidated hotels that were open during the entirety of each respective month
                    (3)   Based on Park's consolidated portfolio, including hotels that were suspended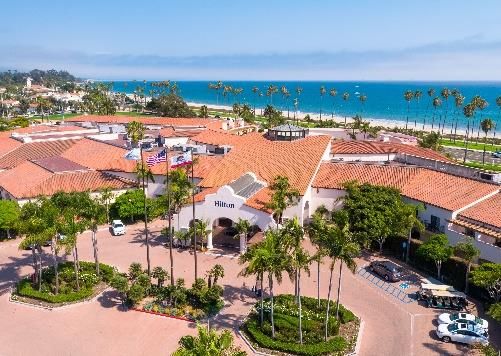
Iconic Portfolio: Top 30 Assets Best in Class
       2019 Pro-forma Hotel Adj. EBITDA Breakdown                                                                                   PK Owns One of the Highest Quality Portfolios
                                                                                                                         (1)

                                                                                                                          •      Core 30 (89% of Pro-forma Comparable Hotel Adj. EBITDA):
                                            All Other                                                                                  ✓ RevPAR of $204 is $20 higher than peers(1)
                                               11%
                                                                                                                                       ✓ Margin of 30.7% is 20bps higher than peers(1)
                                                                                                                                       ✓ EBITDA/Key of $35,500 is 14% greater than peers(1)
                                                                                                                          •      PK All Other(2) represents just ~11% of 2019 Pro-forma
                                                                                                                                 Comparable Hotel Adj. EBITDA
                                                            Core 30                                                       •      Pro-forma Comparable Hotel Portfolio generated RevPAR of
                                                             89%                                                                 $186 in 2019, in line with hotel REIT peers(1)
                                                                                                                          •      Pro-forma Comparable Hotel Portfolio: 2019 Hotel Adjusted
                                                                                                                                 EBITDA margin (29.5%) 100bps lower than hotel REIT peers(1)

                     2019 Pro-forma RevPAR                                               2019 Pro-forma Hotel Adj. EBITDA Margin                                     2019 Pro-forma Hotel Adj. EBITDA/Key

$220                                                                             32.0%                                                                     $40,000
              $204                                                                           30.7%          30.5%
                                                                                                                                                                        $35,500
$200                                                                             30.0%                                         29.5%                       $35,000
                            $186           $184                                                                                                                                     $31,262          $30,600
$180                                                                             28.0%                                                                     $30,000

$160                                                                             26.0%                                                                     $25,000

$140                                                                             24.0%                                                        23.3%        $20,000
                                                            $124                                                                                                                                                    $15,500
$120                                                                             22.0%                                                                     $15,000

$100                                                                             20.0%                                                                     $10,000
            PK          PK Pro-Forma    REIT Peers⁽¹⁾   PK All Other⁽²⁾                       PK         REIT Peers⁽¹⁾      PK Pro-Forma PK All Other⁽²⁾                  PK      REIT Peers⁽¹⁾    PK Pro-Forma PK All Other⁽²⁾
          Core 30      Comp Portfolio                                                       Core 30                        Comp Portfolio                               Core 30                   Comp Portfolio

1210 | (1) REIT peers are HST, PEB, SHO, DRH, RHP and XHR (full-service lodging REITs with a market cap over $1 billion)
        (2)    PK All Other portfolio includes Park’s 23 remaining hotels, but excludes unconsolidated joint ventures
Iconic Portfolio: Steep Discount to Replacement Cost
Park currently trades(1) at a 63% discount to replacement cost(2) vs. a 49% discount as of 12/31/19
Meeting Space Replacement
Rooms
(sq. ft.) Cost ($/key)
$19.7B
$16.5B
Core 30 21,495 1.8M
$3.2B
($769k/Key)
$19.7B
Total Portfolio(3) 30,119 2.3M
($654k/Key)
Core 30
63%
Discount to
Replacement Cost
$16.5B $7.4B
Hilton San Francisco Union Square Casa Marina, A Waldorf Astoria Resort
Park (2) Park (1)
Replacement Cost (Est.) Enterprise Value
Hilton Waikoloa Village New York Hilton Midtown
(1) Based on Park’s stock price as of 11/11/20
(2) The replacement cost estimates are based on Park internal analysis and recent construction market pricing. Estimated land values are based on market
data and recent comparable sales where applicable. This estimate is not intended to be an estimate for the fair market value of the portfolio
11 |
(3) Includes Park’s pro rata share of unconsolidated joint ventures, as of 9/30/20Right-Sizing Hotel Operating Model
Unique opportunity to enhance the hotel operating model which should lead to improved operating margins
✓ Permanent reduction of full-time, hotel-level staffing resulting in $70M annual savings
✓ Reductions in above-property cost allocations; increased productivity from opt-in stay over cleaning; right-sizing of F&B operations
✓ Partner with brands to re-assess brand standards to achieve operational efficiencies while maintaining market share premiums
✓ Technological advances to avoid unnecessary costs at low occupancy levels
Expense Savings Opportunities Revenue Opportunities
• Right-size staffing through permanent reductions and
• Ensure segmentation mix correctly aligns to leisure vs. group
complexing hotel operations yielding $70M of expected annual
vs. business transient demand trends
savings
• Adjust operations to address changing consumer preferences:
• Explore additional revenue opportunities – including
1) contactless check-in/room service; and 2) limit
opportunities within former Chesapeake portfolio
housekeeping
• Partner with brands to re-assess brand standards and • Explore alternative uses for space as trends develop and
technological solutions to drive additional profitability brand standards are altered
• Eliminate or re-purpose unprofitable F&B operations (e.g,
• Use of technology to drive ancillary business and more share
buffets) and outlets; accelerate Grab N’ Go and leasing
of wallet
opportunities
Hilton Waikoloa Village
12 |Embedded Opportunities to Potentially Enhance Value
Nearly half of Park’s Core 30 portfolio Rebrand/Reposition Expand Alt. Use
possesses potential value enhancement
Hilton Hawaiian Village
opportunities which further promote the
portfolio’s inherent real estate value Hilton Waikoloa Village
Hilton New Orleans Riverside
▪ Position hotels to Hilton Orlando Bonnet Creek
better cater to market
Rebrand / demand Waldorf Orlando
Reposition
New York Hilton Midtown
Hilton Chicago
▪ Activate underutilized W Chicago Lakeshore
real estate
Expand Waldorf Casa Marina
Hilton Denver City Center
▪ Convert portions of DoubleTree San Jose
hotels to other uses DoubleTree Crystal City
Alternative (e.g., timeshare)
Uses Hilton Santa Barbara Completed
Reach Resort, Curio Collection Completed
13 |Value Enhancement Case Studies
Rebrand / Reposition
Hilton Santa Barbara: Re-branded to Hilton from DoubleTree
▪ Transient revenues increased 19% from 2017 to 2019 on strength of more upscale brand and
transformational renovation
▪ Improved EBITDA from $16.6M in 2017 to $22.2M in 2019, a 15.4% CAGR
▪ Strong drive-to leisure appeal: highest RevPAR ($209) during Q3 2020 among Park’s portfolio Hilton Santa Barbara Beachfront Resort
The Reach Resort: Re-branded to Curio Collection by Hilton from Waldorf Astoria
▪ New affiliation allows resort to cater to lifestyle-focused travelers and serve as a
complementary alternative to Casa Marina
▪ Strong results upon reopening (pre-Covid), posting 14.7% improvement in rate from Dec
2019 to Feb 2020 versus prior period
▪ Honored with the Stella Award for Best Renovation in the Southeast The Reach Resort, Curio Collection
Expand Alternative Use
Waldorf/Hilton Bonnet Creek Hilton Waikoloa: HGV
Complex: Meeting space expansion timeshare transfer
▪ Increase meeting space from 107k ▪ Transferred 600-room
sq ft to 157k sq ft Ocean Tower to Hilton Hilton Waikoloa Village
Waldorf Astoria Orlando
▪ Expected IRR of 18% on $90M Grand Vacations to
investment reduce footprint
▪ Project likely to resume 2H 2021 ▪ Resulting smaller resort is
▪ Upon completion, Hilton to be more efficient, providing
upbranded to the group-oriented ability to yield ADR and
Signia Hilton brand Signia Hilton Bonnet Creek improve profit margin Hilton Waikoloa Village
14 |Strong and Flexible Balance Sheet
Park has raised $1.4B of corporate debt since May with proceeds used to paydown near-term maturities, boost
liquidity and enhance debt metrics
Park Total Capitalization Debt Metrics: 2Q20 vs. 3Q20
2Q20 3Q20
% of Debt Maturing through '22 (1) 28% 2%
% of Fixed Rate Debt 65% 79%
Capitalization
(2)
% of Bank Debt 39% 25%
$8.5B
(3) Liquidity Available $1.6B $1.6B
Wtd Avg Maturity of Consol. Debt 4.1 years 5.0 years
(2)
Monthly Cash Burn $59M $50M
Secured Unsecured UJV Debt Equity
Debt Mix(2) $2,000
Debt Maturity Schedule(3)(4)
$1,750
$300
$1,500
Floating Callable $1,250
$ in Millions
21% Freely $601
with
$1,000
Prepayable Premium
39% 34% $750 $1,580
(2) $500
Non- $828 $725
Fixed $174 $670 $650
Callable $250
79% $90
27% $12
$0
2020 2021 2022 2023 2024 2025 2026 2027 2028+
Term Loans Mortgage Loans Revolver Borrowings Revolver Availability Senior Notes
(1) Does not include the amount maturing under the Revolver in 2021, which will be repaid from existing lenders
(2) Reflects consolidated debt only and excludes scheduled amortizing principal payments as of 9/30/20
(3) Reflects fully extended maturities for outstanding loans as stated in each of the respective loan agreements except Hilton Denver, which matures in
15 | August 2042 but is callable by the lender beginning in August 2022
(4) Net effect from the Credit Facility Amendment results in a partial two-year extension of the Revolver total commitment amount of $901 millionBalance Sheet: Ample Liquidity
Over $1.6B of liquidity available, or 32 months of liquidity runway
Current Liquidity: $1.6B Burn Rate and Liquidity Runway: 32 months
$1,800 $1,593 $1,608 Q2 2020 Q3 2020
$1,600
$1,346
$1,400
$1,304 Effective Burn Rate $59 million $50 million
$1,200
$ in million
$1,000
Liquidity Runway 27 months 32 months
$800
$600 ▪ Note that in an extreme situation, whereby operations
$400
at all of Park’s 60 hotels are suspended, the estimated
$200
monthly burn rate is $65M
$0
4Q19 1Q20 2Q20 3Q20
Cash & Cash Equivalents Revolver Availability
Curio Cupertino Casa Marina, A Waldorf Astoria Resort Hilton Chicago
16 | (1) Assumes all hotels have suspended operationsExperienced Management Team with Track Record of Success
Chairman and CEO
Thomas J. Baltimore, Jr.
Executive Management
EVP, Design & SVP,
EVP, CFO EVP, CIO EVP, HR
Construction General Counsel
Sean M. Dell’Orto Tom Morey Jill Olander
Carl Mayfield Nancy Vu
Senior Management
SVP, Investments SVP, FP&A SVP, CAO SVP, Strategy SVP, Tax
Jonathan Fuisz Diem Larsen Darren Robb Ian Weissman Scott Winer
Key Accomplishments: 2017-2019
Asset Management Capital Allocation Balance Sheet/Dividend
✓ Improved RevPAR by $8 to $186 ✓ Sold or disposed of 25 hotels for ✓ Returned over $2.3B of capital to
✓ Improved Hotel Adjusted total proceeds of $1.2B shareholders
EBITDA margin 25bps ✓ Acquired Chesapeake Lodging ✓ Ended 2019 with pro-forma Net
✓ Increased Group mix by 247bps Trust for $2.5B, improving the Debt to Adjusted EBITDA at 4.3x
to 31% overall quality of the portfolio
17 |Strong Corporate Governance and ESG Focus
Moving Forward Accomplishments & Recognitions
2019 • Named to Newsweek’s Most Responsible
Companies 2020 list
• Park issued its first Annual Corporate
Responsibility Report in Jan ’19 and
simultaneously launched its
Responsibility page on Park’s website
• Signed the CEO Action for Diversity
• Favorable ISS Disclosure Scores indicating higher
and Inclusion™
quality disclosure and transparency practices
• Added GRI Index to second Annual relative to all real estate companies(1):
Corporate Responsibility Report for • Environmental: 4/10
enhanced ESG reporting and • Social: 2/10
disclosure • Governance: 1/10
2020 • Achieved first time GRESB Real Estate
Assessment score of 72, including 28/30 for
• Branded its internal cross- Management(2)
departmental sustainability
committee as the Park Green
Committee
• Formed Park’s Diversity & Inclusion
cross-departmental committee
• Participated in the 2020 GRESB
Assessment
(1) ISS disclosure scores based on a scale of 1 to 10, with 1 representing higher quality disclosure and transparency practices. Scores as of 11/1/20
18 |
(2) 2020 GRESB Assessment score released 11/16/20Appendix The Reach Key West, Curio Collection by Hilton
Amendment Overview and Covenant Relief
                                             Park Successfully Amended its Credit and Term Loan Facilities

   Amendment Overview                                                                                                                       Covenant                            Metric        Modification
                                                                                                                                                                                          8.50x for Q1/Q2 2022
   Upsized and Extended Revolver                                                                                                            Net Leverage Ratio                  < 7.25x   8.00x for Q3/Q4 2022
   •          $901 million of Revolver commitments extended two years to December                                                                                                         7.50x for Q1 2023
              2023                                                                                                                          EBITDA / Fixed Charges              >1.50x    No Change

   Covenant Waiver                                                                                                                          Secured Indebtedness (%)            < 45.0%   No Change
   •          Suspend compliance with all existing financial covenants tested through
              and including 12/31/21, with the test period beginning 3/31/22                                                                Unsecured Indebtedness (%) < 60.0%            No Change
   •          Pledge equity in certain subsidiaries to secure the facilities (eight high
              quality hotels—mix of urban, resort and suburban) until revolver and                                                          Unsecured Interest Coverage          > 2.0x   1.75x through Q4 2022
              2019 term loan are repaid
                                                                                                                                            Distributions - % of AFFO           < 95.0%   No Change
   •          Adjust levels of particular financial covenants after waiver period(1)
   •          Minimum liquidity covenant of $200M plus 50% of the non-extending
              Revolver commitments that mature in December 2021

   Additional Covenants Limit:
   •          Dividend and distribution payments (except to the extent required to
              maintain REIT status); permitted to make additional Restricted Payments
              as quarterly dividends not to exceed $0.01/share
   •          Stock repurchases
   •          Prepayments of other indebtedness
   •          Capital expenditures
   •          Asset dispositions and transfers
   •          Investments, including acquisitions or mergers (apply up to $1 billion of
              equity proceeds to investments prior to paying down debt)
   •          Incurrence of other indebtedness
                                                                                                                                              Hyatt Centric Fisherman’s Wharf

        (1)    Next test period is 3/31/22 with leverage < 8.5x for next two quarters (annualized EBITDA); 8.0x for next two quarters; 7.5x for one quarter; returns to 7
 20 |          .25x by September 2022; Also unsecured Interest Coverage hurdle beginning 3/31/22 will be 1.75x for two quarters and 2.0x thereafter; Annualization
                methodology will be applied during the first three quarters after the suspension period for all the covenant tests
Non-GAAP Reconciliations
Pro-forma Core 30 and Pro-forma Comparable Hotel Revenues
Full Year Full Year
(unaudited, in millions) December 31, December 31,
2016 2019
Total Revenues $ 2,727 $ 2,844
Less: Other revenue (13) (77)
Add: Revenues from hotels acquired
(1)
— 406
Less: Revenues from hotels disposed of (9) (143)
Pro-forma Hotel Revenues (1) 2,705 3,030
Less: Revenue from non-comparable hotels — (54)
(1)
Pro-forma Comparable Hotel Revenues $ 2,705 2,976
Less: Revenues from non-core 30 hotels (440)
(1)
Core 30 Pro-forma Hotel Revenues $ 2,536
21 | (1) Assumes hotels were acquired on 1/1/19Non-GAAP Reconciliations (Cont’d)
Net Income to Pro-forma Core 30 and Pro-forma Comparable Hotel Adjusted EBITDA
Full Year Full Year
(unaudited, in millions) December 31, December 31,
2016 2019
Net income $ 139 $ 316
Depreciation and amortization expense 300 264
Interest income (2) (6)
Interest expense 181 140
Income tax expense 82 35
Interest expense, income tax and depreciation and amortization
included in equity in earnings from investments in affiliates 24 23
EBITDA 724 772
Gain on sales of assets, net (1) (19)
Gain on sale of investments in affiliates (1) — (44)
Acquisition costs — 70
Severance expense — 2
Share-based compensation expense — 16
Impairment loss and casualty (gain), net 15 (18)
Impairment loss included in equity in earnigns from investments in affiliates 17 —
Other loss, net 25 —
Other items 34 7
Adjusted EBITDA 814 786
Add: Adjusted EBITDA from hotels acquired (2) — 129
Less: Adjusted EBITDA from hotels disposed of (1) (37)
Less: Adjusted EBITDA from investments in affiliates disposed of — (2)
Less: Spin-off Adjustments (3) (57) —
(2)
Pro-forma Adjusted EBITDA 756 876
Less: Adjusted EBITDA from investments in affiliates (44) (35)
Add: All other (4) 38 53
(2)
Pro-forma Hotel Adjusted EBITDA 750 894
Less: Adjusted EBITDA from other non-comparable hotels — (15)
(2)
Pro-forma Comparable Hotel Adjusted EBITDA $ 750 879
Less: Adjusted EBITDA from non-core 30 hotels (100)
Core 30 Pro-forma Hotel Adjusted EBITDA(2) $ 779
(1) Included in other gain (loss), net in the consolidated statement of operations
(2) For the year ended 12/31/19, assumes hotels were acquired on 1/1/19
(3) Spin-off Adjustments include adjustments for incremental fees based on the terms of the post spin-off management agreements and estimated
non-income taxes on certain REIT leases.
22 |
(4) Includes other revenues and other expenses, non-income taxes on TRS leases included in other property-level expenses and corporate general and
administrative expenses in the condensed consolidated statement of operations.Non-GAAP Reconciliations (Cont’d)
Net Debt and Net Debt to Pro-forma Adjusted EBITDA Ratio
(unaudited, in millions)
September 30, 2020 December 31, 2019
Debt $ 5,121 $ 3,871
Add: unamortized deferred financing costs and discount 40 18
Less: unamortized premium (4) (3)
Long-term debt, including current maturities and excluding
unamortized deferred financing cost, premiums and discounts 5,157 3,886
Add: Park's share of unconsolidated affiliates debt,
excluding unamortized deferred financing costs 225 225
Less: cash and cash equivalents (1,134) (346)
Less: restricted cash (35) (40)
Net debt $ 4,213 $ 3,725
(1)
Pro-forma Adjusted EBITDA $ 876
Net debt to Pro-forma Adjusted EBITDA ratio 4.3x
23 | (1) Excludes results from disposed hotelsDefinitions EBITDA, Adjusted EBITDA, Pro-forma Adjusted EBITDA, Hotel Adjusted EBITDA and Hotel Adjusted EBITDA Margin Earnings (loss) before interest expense, taxes and depreciation and amortization (“EBITDA”), presented herein, reflects net income (loss) excluding depreciation and amortization, interest income, interest expense, income taxes and interest expense, income tax and depreciation and amortization included in equity in earnings (losses) from investments in affiliates. Adjusted EBITDA, presented herein, is calculated as EBITDA, as previously defined, further adjusted to exclude: • Gains or losses on sales of assets for both consolidated and unconsolidated investments; • Costs associated with hotel acquisitions or dispositions expensed during theperiod; • Severance expense; • Share-based compensation expense; • Casualty gains or losses; • Impairment losses; and • Other items that management believes are not representative of the Company’s current or future operating performance. Hotel Adjusted EBITDA measures hotel-level results before debt service, depreciation and corporate expenses of the Company’s consolidated hotels, including both comparable and non-comparable hotels but excluding hotels owned by unconsolidated affiliates, and is a key measure of the Company’s profitability. The Company presents Hotel Adjusted EBITDA to help the Company and its investors evaluate the ongoing operating performance of the Company’s consolidated hotels. Hotel Adjusted EBITDA margin is calculated as Hotel Adjusted EBITDA divided by total hotel revenue. EBITDA, Adjusted EBITDA, Hotel Adjusted EBITDA and Hotel Adjusted EBITDA margin are not recognized terms under United States (“U.S.”) GAAP and should not be considered as alternatives to net income (loss) or other measures of financial performance or liquidity derived in accordance with U.S. GAAP. In addition, the Company’s definitions of EBITDA, Adjusted EBITDA, Hotel Adjusted EBITDA and Hotel Adjusted EBITDA margin may not be comparable to similarly titled measures of other companies. The Company believes that EBITDA, Adjusted EBITDA, Hotel Adjusted EBITDA and Hotel Adjusted EBITDA margin provide useful information to investors about the Company and its financial condition and results of operations for the following reasons: (i) EBITDA, Adjusted EBITDA, Hotel Adjusted EBITDA and Hotel Adjusted EBITDA margin are among the measures used by the Company’s management team to make day-to-day operating decisions and to evaluate its operating performance between periods and between REITs by removing the effect of its capital structure (primarily interest expense) and asset base (primarily depreciation and amortization) from its operating results; and (ii) EBITDA, Adjusted EBITDA, Hotel Adjusted EBITDA and Hotel Adjusted EBITDA margin are frequently used by securities analysts, investors and other interested parties as a common performance measure to compare results or estimate valuations across companies in the industry. EBITDA, Adjusted EBITDA, Pro-forma Adjusted EBITDA, Hotel Adjusted EBITDA and Hotel Adjusted EBITDA margin have limitations as analytical tools and should not be considered either in isolation or as a substitute for net income (loss) or other methods of analyzing results as reported under U.S. GAAP. 24 |
Definitions (Cont’d)
Net Debt

Net debt, presented herein, is a non-GAAP financial measure that the Company uses to evaluate its financial leverage. Net debt is calculated as (i) long-term debt, including current
maturities and excluding unamortized deferred financing costs; and (ii) the Company’s share of investments in affiliate debt, excluding unamortized deferred financing costs; reduced
by (a) cash and cash equivalents; and (b) restricted cash and cash equivalents.

The Company believes Net debt provides useful information about its indebtedness to investors as it is frequently used by securities analysts, investors and other interested parties
to compare the indebtedness of companies. Net debt should not be considered as a substitute to debt presented in accordance with U.S. GAAP. Net debt may not be comparable to
a similarly titled measure of other companies.

Net Debt to Adjusted EBITDA Ratio

Net debt to Pro-forma Adjusted EBITDA ratio, presented herein, is a non-GAAP financial measure and is included as it is frequently used by securities analysts, investors and other
interested parties to compare the financial condition of companies. Pro-forma Net debt to Pro-forma Adjusted EBITDA ratio should not be considered as an alternative to measures
of financial condition derived in accordance with U.S. GAAP and it may not be comparable to a similarly titled measure of other companies.

Core 30

Core 30, presented herein, refers to Park’s portfolio of its highest quality, upper-upscale and luxury branded hotels located in top 25 Metropolitan Statistical Areas by population and
premier resort destinations.

Pro-forma

The Company presents certain data for its consolidated hotels on a pro-forma hotel basis as supplemental information for investors: Pro-forma Hotel Revenues, Pro-forma
RevPAR, Pro-forma Total RevPAR, Pro-forma Occupancy, Pro-forma ADR, Pro-forma Adjusted EBITDA, Pro-forma Hotel Adjusted EBITDA and Proforma Hotel Adjusted EBITDA
Margin and Net debt to Pro-forma Adjusted EBITDA ratio. The Company presents pro-forma hotel results to help the Company and its investors evaluate the ongoing operating
performance of its hotels. The Company’s pro-forma metrics exclude results from property dispositions and include results from property acquisitions as though such
acquisitions occurred on the earliest period presented.

Pro-forma Comparable Hotels

The Company presents certain data for its consolidated hotels on a pro-forma comparable hotel basis as supplemental information for investors: Pro-forma Comparable
RevPAR, Pro-forma Comparable Occupancy, Pro-forma Comparable ADR, Pro-forma Comparable Total RevPAR, Pro-forma Comparable Hotel Adjusted EBITDA and Pro-forma
Comparable Hotel Adjusted EBITDA Margin. The Company presents pro-forma comparable hotel results to help the Company and its investors evaluate the ongoing operating
performance of its comparable hotels. The Company includes in pro-forma comparable hotels the operating results from the 16 hotels acquired in the Chesapeake merger in
September 2019 that remain in the portfolio as of December 31, 2019 as if they were owned as of the beginning of each of the periods presented. Pro-forma comparable
hotels also include the operating results for Park legacy hotels that: (i) were active and operating since January 1st of the previous year, and (ii) have not sustained substantial
property damage or business interruption, have not undergone large-scale capital projects and for which comparable results are not available. Due to the effects of business
interruption from Hurricane Maria at the Caribe Hilton in Puerto Rico during the first half of 2019, the results from this property were excluded from pro-forma comparable
hotels in 2019. Additionally, Park’s pro-forma comparable hotels also exclude the 12 consolidated hotels that were sold in January and February 2018, one consolidated hotel
that was returned to the lessor after the expiration of the ground lease in December 2018, one hotel returned to the lessor upon early termination of the ground lease in
December
25 |       2019, and nine consolidated hotels that were sold in 2019 and 2020. Of the 55 hotels that are consolidated as of December 31, 2019, 54 hotels have been classified
as pro-forma comparable hotels.
Definitions (Cont’d)
Occupancy

Occupancy represents the total number of room nights sold divided by the total number of room nights available at a hotel or group of hotels. Rooms nights available to guests have
not been adjusted for suspended or reduced operations at certain hotels as a result of COVID-19. Occupancy measures the utilization of the Company’s hotels’ available capacity.
Management uses occupancy to gauge demand at a specific hotel or group of hotels in a given period. Occupancy levels also help management determine achievable Average Daily
Rate (“ADR”) levels as demand for hotel rooms increases or decreases.

Average Daily Rate

ADR represents rooms revenue divided by total number of room nights sold in a given period. ADR measures average room price attained by a hotel and ADR trends provide useful
information concerning the pricing environment and the nature of the customer base of a hotel or group of hotels. ADR is a commonly used performance measure in the hotel
industry, and management uses ADR to assess pricing levels that the Company is able to generate by type of customer, as changes in rates have a more pronounced effect on
overall revenues and incremental profitability than changes in occupancy, as described above.

Revenue per Available Room

Revenue per Available Room (“RevPAR”) represents rooms revenue divided by total number of room nights available to guests for a given period. Rooms nights available to guests
have not been adjusted for suspended or reduced operations at certain hotels as a result of COVID-19. Management considers RevPAR to be a meaningful indicator of the
Company’s performance as it provides a metric correlated to two primary and key factors of operations at a hotel or group of hotels: occupancy and ADR. RevPAR is also a useful
indicator in measuring performance over comparable periods for comparable hotels.

References to RevPAR and ADR are presented on a comparable basis and references to RevPAR and ADR are presented on a currency neutral basis (prior periods are reflected using
the current period exchange rates), unless otherwise noted.

26 |
About Park and Safe Harbor Disclosure
About Park Hotels & Resorts Inc.
Park Hotels & Resorts Inc. (NYSE: PK) is the second largest publicly traded lodging real estate investment trust with a diverse portfolio of market-leading hotels and resorts with
significant underlying real estate value. Park’s portfolio currently consists of 60 premium-branded hotels and resorts with over 33,000 rooms located in prime U.S. markets with high
barriers to entry. Visit www.pkhotelsandresorts.com for more information.

Forward-Looking Statements
This supplement contains forward-looking statements within the meaning of Section 27A of the Securities Act of 1933, as amended, and Section 21E of the Securities Exchange Act
of 1934, as amended. Forward-looking statements include, but are not limited to, statements related to Park’s current expectations regarding the performance of its business,
financial results, liquidity and capital resources, the effects of competition and the effects of future legislation or regulations, the expected completion of anticipated dispositions,
the declaration and payment of future dividends, and other non-historical statements. Forward-looking statements include all statements that are not historical facts, and in some
cases, can be identified by the use of forward-looking terminology such as the words “outlook,” “believes,” “expects,” “potential,” “continues,” “may,” “will,” “should,” “could,”
“seeks,” “projects,” “predicts,” “intends,” “plans,” “estimates,” “anticipates” or the negative version of these words or other comparable words. You should not rely on forward-
looking statements since they involve known and unknown risks, uncertainties and other factors which are, in some cases, beyond the Company’s control and which could materially
affect its results of operations, financial condition, cash flows, performance or future achievements or events. Currently, one of the most significant factors is the potential adverse
effect of COVID-19, including possible resurgences, on the Company’s financial condition, results of operations, cash flows and performance, its hotel management companies and
its hotels’ tenants, and the global economy and financial markets. The extent to which COVID-19 impacts the Company, its hotel managers, tenants and guests at the Company’s
hotels will depend on future developments, which are highly uncertain and cannot be predicted with confidence, including the scope, severity and duration of the pandemic, the
actions taken to contain the pandemic or mitigate its effect, additional closures that may be mandated or advisable even after the reopening of certain of the Company’s hotels on a
limited basis, whether due to an increased number of COVID-19 cases or otherwise, and the direct and indirect economic effects of the pandemic and containment measures,
among others.

Forward-looking statements involve risks, uncertainties and assumptions. Actual results may differ materially from those expressed in these forward-looking statements. You should
not put undue reliance on any forward-looking statements and Park urges investors to carefully review the disclosures Park makes concerning risk and uncertainties in Item 1A: “Risk
Factors” in Park’s Annual Report on Form 10-K for the year ended December 31, 2019 and Quarterly Reports on Form 10-Q for the quarters ended September 30, 2020, as such
factors may be updated from time to time in Park’s filings with the SEC, which are accessible on the SEC’s website at www.sec.gov. Except as required by law, Park undertakes no
obligation to update or revise publicly any forward-looking statements, whether as a result of new information, future events or otherwise.

Supplemental Financial Information
Park refers to certain non-generally accepted accounting principles (“GAAP”) financial measures in this presentation, including earnings (loss) before interest expense, taxes and
depreciation and amortization (“EBITDA”), Adjusted EBITDA, Hotel Adjusted EBITDA, Comparable Hotel Adjusted EBITDA margin, Comparable Hotel Adjusted EBITDA per Key, Core 30
Hotel Adjusted EBITDA, Core 30 Hotel Adjusted EBITDA Margin, Net debt to Adjusted EBITDA, and Net debt to Adjusted EBITDA ratio. These non-GAAP financial measures should be
considered along with, but not as alternatives to, net income (loss) as a measure of its operating performance. Please see the schedules included in this presentation including the
“Definitions” section for additional information.

 27 |
You can also read