Investor Presentation - TSXV: EIL OTC: ERILF January 2020 - Dynamic Technologies Group
←
→
Page content transcription
If your browser does not render page correctly, please read the page content below
Investor Presentation
                 January 2020

             PRIVATE & CONFIDENTIAL

                  TSXV: EIL

                OTC: ERILF
Disclaimer

   This presentation contains forward-looking statements, within the meaning of applicable securities
   legislation, concerning Empire's business and affairs. In certain cases, forward-looking statements
   can be identified by the use of words such as "plans", "expects" or "does not expect", "budget",
   "scheduled", "estimates", "forecasts", "intends", "anticipates" or variations of such words and phrases
   or state that certain actions, events or results "may", "could", "would", "might" or "will be taken",
   "occur" or "be achieved". These forward looking statements are based on current expectations, and
   are naturally subject to uncertainty and changes in circumstances that may cause actual results to
   differ materially. Readers are cautioned not to place undue reliance on such forward-looking
   statements. Forward-looking information is provided as of the date of this presentation, and Empire
   assumes no obligation to update or revise them to reflect new events or circumstances, except as may
   be required under applicable securities laws. Neither the TSX Venture Exchange nor its Regulation
   Services Provider (as that term is defined in the policies of the TSX Venture Exchange) accepts
   responsibility for the adequacy or accuracy of this presentation.

                                                    Page 2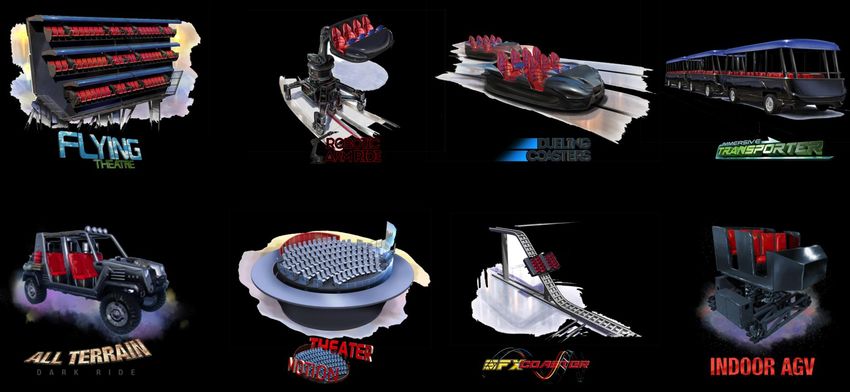
Table of Contents

                    Section
                    I.    Introduction
                    II.   Investment Highlights
                    III. Company Overview
                    IV. Industry Overview
                    V.    Financials Information

                                         Page 3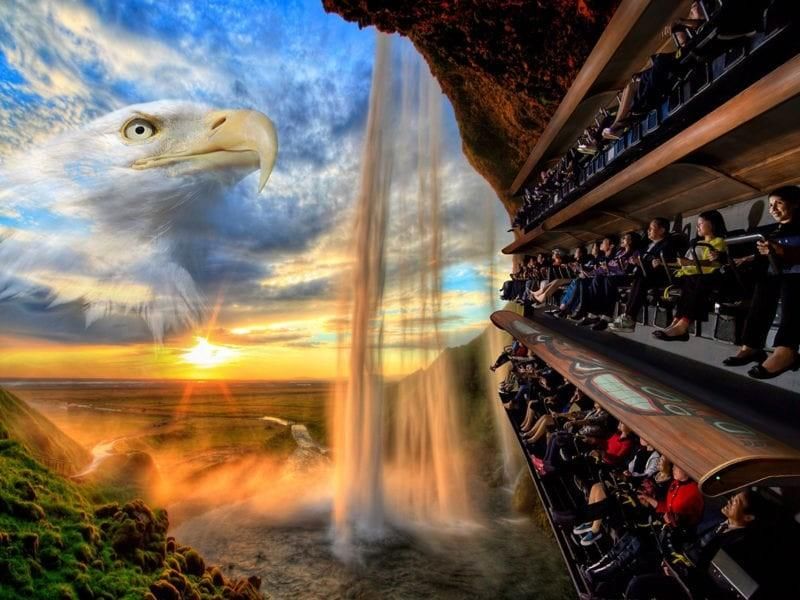
I. Introduction
Business Overview

                                                                                                    /                     1

        Dynamic Co-ventures                                                           Dynamic Attractions                       Non-Core Assets

                                                                                                                               Legacy investments in
                                                                                                                              businesses with assets in
  Co-ownership of attractions                                                      Designs & build rides                        process of being sold

• Operation and Co-ownership of                                            • Turnkey supplier of premium
  standalone attractions worldwide                                            entertainment attractions for theme parks
                                                                              and stand-alone tourist venues
                                                                           • The Group also provides maintenance and
                                                                              training for its ride systems                          ~10% stake
                                                                           • Holds IPs and licenses for the Co-ventures              (TSXV:TGH)
                                                                              initiative

                                                                                                                                     100% stake

                                               Manufacturing contracts                                                               100% stake

                                                    IP Master Licenses

                  1.   The shareholders have approved a name change from
                       Empire Industries to Dynamic Entertainment
                                                                                           Page 5
II. Investment Highlights
Investment Highlights

        #1        Developing a Recurring Revenue Model by Leveraging IP

             #2       Established Customer Relationships with Industry Leaders

              #3        Strong Partnerships for Co-Ventures in Global Markets

             #4       Compelling Industry Dynamics

        #5        Internationally Experienced Management Team

                                       Page 7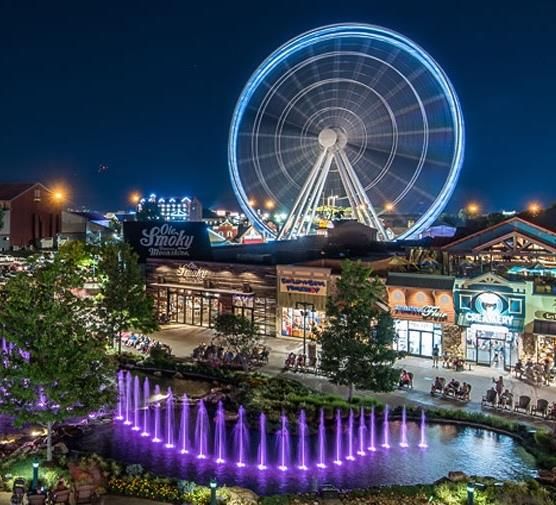
#1    Developing a Recurring Revenue Model by Leveraging IP
Robust Profitability Through a Recurring Revenue Model
• The Company’s Co-ventures business unit, Dynamic Co-
  ventures, was launched in Q4 2017
• Leverages the Company’s intellectual property and strengths as
  a supplier of iconic attractions and expands the Company’s
  reach into new markets                                                             Intellectual Property                   Expertise
• By partnering with major tourist destinations, the Company will                   Company holds more than           Company has 20+ years of
  co-own and operate award winning attractions in locations with
                                                                                    19 IPs for some of the best        experience in the global
  high tourist traffic
                                                                                         in-class attractions           theme park industry
• Expected to provide the Company with a highly profitable
  recurring revenue stream

                                                            Supported By

               Blue-chip Customer Base                                                            Co-venture Contracts

                                                                              • The first Co-venture1 was announced at The
                                                                                   Island theme park (Smoky Mountains,
                                                                                   Tennessee), which is ranked as the 6th most
                                                                                   popular theme park in the USA2
                                                                              •    Strong project economics, expected payback
  • Created 50+ attractions across the world                                       period ~3 years and a 20+ years land lease

                      1.   The Company holds an option to purchase a 50% interest in the Smoky Mountains Co-venture
                      2.   TripAdvisor 2019
                                                                                                         Page 8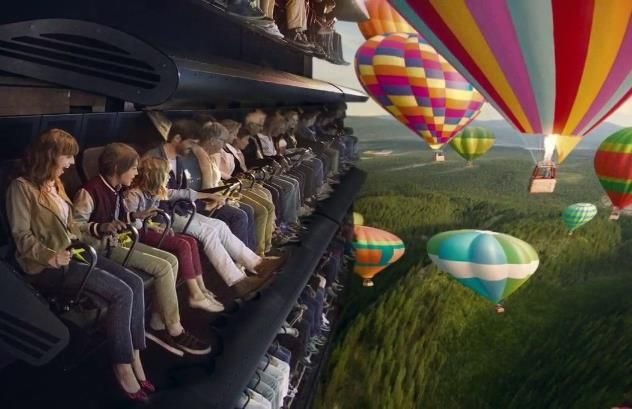
#2   Established Customer Relationships with Industry Leaders

Dynamic Attractions’ customer base includes            The Company has received strong support
 some of the world’s largest theme parks in                       from its clients
             several locations
                                                       “When you build world-class attractions, you
                                                         need world-class vendors like Dynamic.”

                                                         “The design, engineering and fabrication
                                                             were proven to be impeccable.”

                                                          “The most popular and highest-rated
                                                                attraction in the park.”

                                              Page 9
#3        Strong Partnerships for Co-Ventures in Global Markets
• The Co-venture business is a natural extension of the Company’s business model, from manufacturer of ride
  systems, to designer of turnkey media-based attractions, and now to co-own and operate its own world class
  attractions in prime locations around the world
Strong Existing Relationships within China                                Longstanding Experience in North America
                              Key Factors
      Business success in China is
                                       China is expected to become
         highly dependent on
                                        world's largest theme park             • Consummated a significant partnership in the 6th
       relationships with local
                                              market by 2020                     most popular theme park in the USA: The Island in
                parties
                                                                                 Pigeon Forge, Tennessee
                               Enabled By
                                                                                 ‒ The Co-venture attraction is scheduled to open in
  • James Chui, an Empire director and one of the Company’s                        March 2021, featuring a 39-seat Dynamic Flying
       largest shareholders, has strong connections with Chinese
                                                                                   Theatre
       industry. He is a director of multiple major companies in
       China
                                                                                 ‒ The Company has an option to purchase a 50%
  •    Through its extensive network of relationships and
       contacts, DEI has identified potential Co-venture                           interest in the Co-venture.
       partnerships in China, and is following up to qualify many
       other prospects

                                                              Supported By

 Proven Exporting & Commissioning
             Expertise
                                                    Diversified Global Supply Chain                Internationally Experienced Team

                                                                     Page 10
#4 Compelling Industry Dynamics
Global Amusement Park Industry Overview1 Global Amusement Park Guest Spending
• Global theme and amusement park spending rose 6.8% in (US$ billions)
$55 $59 $62 $66
$52
2018 to US$49 billion $40 $43 $46 $49
$35 $38
• Attendance continued to be the principal driver of global
spending, with a 3.4% gain in 2018
• During 2013-18, the theme and amusement park market 2013 2014 2015 2016 2017 2018 2019E 2020E 2021E 2022E 2023E
outpaced global economic growth Global Amusement Park Attendance
(in millions)
1,290 1,335
− Spending averaged a 6.3% CAGR2 compared to the 4.8%
1,006 1,041 1,084 1,122 1,157 1,200 1,244
931 957
average of the nominal GDP
− Theme park spending is expected to stay constant for the
2018-23 period at 6.3% CAGR2, again outpacing the projected
4.7% of global economic growth
2013 2014 2015 2016 2017 2018 2019E 2020E 2021E 2022E 2023E
Desired new attractions in next 1 to 3 years
(If the facility were to add one new attraction in the next one to three years, what would it be?
(n=154)
36% Company is well positioned to capitalize on the future
27% capital spending desires of Amusement Parks
14% 12% 12% 12%
10% 8% 8%
6% 6% 6% 6% 5% 5% 5% 5% 4% 4% 3% 3% 3% 3% 3% 3% 2% 1% 1% 1% 1%
1. Source: IAAPA Global Theme and Amusement Park Outlook: 2018-2023
Page 11
2. Compound Annual Growth Rate#5 Internationally Experienced Management Team
Guy Nelson Cindy Emerick
Chairman & CEO of Dynamic Entertainment Senior Vice President – Global Business Development
• Founded the company in 2006; Held various leadership • 25+ years of progressive leadership experience in the theme
position in the contract fabrication and construction park and attractions industry
business • Leads Global Sales and Marketing for Dynamic Attractions
• Experienced leader in international export markets rides systems and new product development
• Holds an MBA from Ivey Business School and a B.Comm • B.Sc. Material Science & Engineering from Wright State
from University of Alberta University
Hao Wang Michael Carroll
President & COO of Dynamic Attractions Vice President & Executive Producer
• Joined the company in Q4 2017 and has been active in • Joined Dynamic Entertainment in 2018; bringing his creative
repositioning the company into a product vs. project based leadership skills to the Co-venture business unit and the
manufacturer, and strengthening the creation and iconic ride supply business
development of innovative ride systems • Senior creative executive with 25+ years of International
• Previously held various executive leadership positions at a experience in the themed entertainment business
global, high-performance automobile design, engineering • Produced and directed 20+ media based attractions at three
and manufacturing company for over 20 years theme parks in the Middle East
• Mechanical Engineer, University of Waterloo • MBA from Crummer School of Business, Rollins College and
B.Sc. In Ocean Engineering from Florida Institute of
Technology
Allan Francis Jerry Pierson
Vice President - Corporate Affairs & Administration Executive Vice President – Operations (USA)
• Provides expertise in the areas of risk management, • 30+ years of experience in in the themed entertainment
industry in the US and abroad
commercial management, acquisition due diligence and
corporate governance
• Currently runs the US operations based in Orlando and also
heads the company’s controls and electrical engineering
• Over 25 years of manufacturing and engineering business department
experience • MBA from Crummer School of Business, Rollins College
• Holds an LLB from University of Manitoba, and MBA from • Associate of Science, Electronic Engineering from Pennco
Ivey School of Business Technical College, Orlando
Michael Martin Steven Turner
Chief Financial Officer Vice President - Operations (Canada)
• Joined Dynamic Entertainment Inc. in 2010 as Director of • 30+ years experience in manufacturing and assembly
Finance and Corporate Controller • Overseeing all manufacturing and assembly operations in
Canada, managing quality, production optimization, facilities
• Promoted to the role of Chief Financial Officer of Dynamic and leads new products launches
Entertainment in May, 2012 • GMI Engineering and Management Institute, Flint Michigan
• CPA (CA) 2006
Page 12III. Company Overview
Corporate Timeline

                                   • Incorporated DA to continue to
                                        designing and building some of                                                                                                                                • Added $11.5M of cash equity
• Empire Industries                                                                         • Dynamic Structures received                              • Hao Wang joined in Q4
                                        the most iconic rides for Disney
   was founded in                                                                                 a C$13M contract to design                                 2017 as President &                      • Converted $3.4M of non-core assets
                                        and Universal, taking over
   2006 and                                                                                       and supervise the installation                             COO of Dynamic                                into cash
                                        responsibility for the ride
   undertook eight                      business from Dynamic                                     of the enclosure of the TMT1                               Attractions                              • Re-acquired 26.5% of DEGL to own
   acquisitions in                      Structures                                          •     Dynamic Attractions awarded                          •     Launched Dynamic Co-                          100%
   steel fabrication               •    Completed the design for the                              4 contracts to supply it’s                                 ventures, an initiative                  • Converted $11.4M of convertible
   and manufacturing                    proprietary Dynamic Flying                                                                                                                                         preferred shares into common shares
                                                                                                  proprietary media-based                                    intended to create a
   at an investment                     Theater and sold the first 2                              attraction in South East Asia,                             recurring revenue and                    • Reduced Dec 31,2018 very stretched
   cost of $80M in                      installations in China                                    and UAE                                                    profit stream                                 payables from $45.0M to Sept 30, 2019
   two years
                                                                                                                                                                                                           $27.0M

           2006                                       2011                                                        2015                                                  2017                                            2019

                               2007                                                  2012                                                  2016                                                     2018

            • Incorporated as a steel                                • Adjusted its strategy                         • The Dynamic Motion Theater                                 • Dynamic Attractions agreed to a 5-
                  fabrication business in                                 and expanded its                                 was proclaimed the ‘2016 Best                               year strategic cooperation with a
                  Vancouver in 1926                                       proprietary product                              New Attraction’ by IAAPA2                                   theme park conglomerate in Asia
            •     Starting 2000 capitalized                               line of rides beyond                       •     Dynamic Attractions opened                             •    Dynamic Co-ventures announced
                  on its Engineering,                                     the popular Dynamic
                                                                                                                           an 80,000 sq. ft. Attractions                               the first Co-venture opportunity at
                  designing, building                                     Flying Theater to work
                                                                                                                           Development Center in                                       The Island Theme Park
                  experience in telescopes                                with world class clients
                  and complex structures                                                                                   Orlando, Florida                                       •    Opened the newest robotic dark
                  to land several iconic                                                                             •     Spun out3 its Tornado                                       ride in Warner Brothers theme
                  rides for Disney and                                                                                     Hydrovac truck business unit                                park in Abu Dhabi to critical
                  Universal                                                                                                                                                            acclaim

 Source: Company’s Annual Reports, Company Disclosure
 1.     Thirty Meter Telescope – A massive ‘next generation’ telescope, 18 floors high and a 60 meters diameter. This project is a partnership between the US, Japan, China, India, and Canada
 2.     International Attractions and Amusement Parks Association
 3.     That non-core component of Dynamic Entertainment Inc. officially became its own TSX Venture Exchange publicly listed company, Tornado Global Hydrovacs Ltd., in July 2016

                                                                                                                                     Page 14
Key Dynamic Attractions Milestones
• Entered Attractions
Industry; began
long-standing • Opened Dallas • Opened Robotic Arm
relationship with the Office began
top 2 international Dark Ride attraction
offering parts
theme park • Dark Ride • Won best themed
and services • Won Best New
operators attraction and best
Coaster Project • Developed support Attraction media-based
for international Tracked Robot • Won Best New Concept Award attraction in Europe &
theme park ride system
• Developed Attraction – IAAPA (The Middle East
with
suspended flight Concept Award – Dynamic All- • Opened Robotic Arm
International IAAPA (The Terrain Dark
simulator ride system Dark Ride attraction in
Theme Park Dynamic SFX Ride)
with international Warner Brother Abu
theme park Coaster) Dhabi
1998 2001 2005 2010 2012 2015 2017 2019
1999 2004 2007 2011 2014 2016 2018 2020
• Ride • First Project in • Won Best New
manufacturing • Commissioning
• Introduced business
China – 4th • Introduced line Attraction Concept
dimension of products that Award – IAAPA • Won best 3 of the best
Tracked acquired by (The Dynamic new rides in the
Roller Coaster includes the new
• Developed Robotic Arm Empire
Ride at IAAPA
• Duelling Coaster Flying Theater, Motion Theater) attraction world in Abu
Indoor/Outdoor Industries Ltd. • Opened an Dhabi, Kuala
at International Immersive Tram concept
coaster at Theme Park and Others Attraction R&D award for Lumpur & Osaka
international • Opened 10 showcase facility Dual • Commissioning
theme park Attractions on 4 in Orlando Powered 3 flying theaters
Continents Coaster in Bali, Kuala
Lumpur and
Doha
Source: Company Disclosure
Page 15Global Footprint
• Delivered 50+ rides globally
• Robust investment levels by major industry players in rides and theme parks has created extraordinary demand
for attractions
• DEI has averaged a $230 million project backlog in the past three years, represents 2 years of production
− Supported by a growing pipeline of prospective projects
9 10 10
4 5
4
3
Attractions
Operations and Offices
Page 16Owns a Number of Patents on its Proprietary Ride Systems
Rides Year Filed Applied or Awarded
Flying
2012
Theater
SFX Coaster
Side Slide
2015
Tilt & Drop
V-Track Support
All-Terrain
Amusement 2017
Ride &
Controls
Page 17Dynamic Attractions Overview
Business Overview Innovative and Proprietary Products
• 20+ years in the attractions business with 300+
employees world-wide
• Turnkey supplier of premium entertainment rides
− Creates customized award winning systems for some
of the world’s most famous entertainment
destinations Robotic Arm Dark Ride Dual Power Coaster
• Proprietary product lines
− High tech, immersive theatres
− Special effects roller coasters
− Autonomous vehicle (tracked & trackless)
− Independent drive and controlled “coaster vehicles”
− Protected with international patents Trackless Ride Vehicles Motion Theatre
• Parts and services
− Provides parts for rides manufactured by DEI and
others
− Offers maintenance, consulting, and training services
Recent Development Flying Theater SFX Coaster
• Dynamic Attractions’ fourth Robotic Arm Dark Ride
opened to a critical acclaim and received 2 awards: Best
Media Based Attractions and Best Themed Attraction in
the Middle East and Europe for 2019
Immersive Transportation
Page 18Dynamic Attractions Services
Complex Design & Engineering Manufacturing of Ride Equipment Mockups and R&D
Award winning designs and cutting Precision engineering is matched with With new technologies and
edge product line provides customers quality manufacturing and commodity innovations being created daily,
with the best attractions and focus on procurement executed by an Dynamic Attractions can provide its
exceeding our customers’ expectations experienced team with talents that clients with space and resources to
span multiple disciplines with the test ideas and attractions before they
newest technology are installed onsite
Operations & Training Parts & Service Creative Service
Working with parks and attraction The Parts and Service Division is The creative studio in Orlando
owners to provide training and uniquely qualified to handle any includes creative design, full media
processes that enable operators to challenge. Whether it is a single hard- production, SFX and Illusions, show
upgrade their existing rides, improve to-source part or performing a project management for Co-ventures,
maintenance efficiency and reduce customer ride upgrade, the team animatics and flight emulation, in-
downtime strive to provide clients with the best house marketing collaterals and CGI
possible customer service media production and project
management
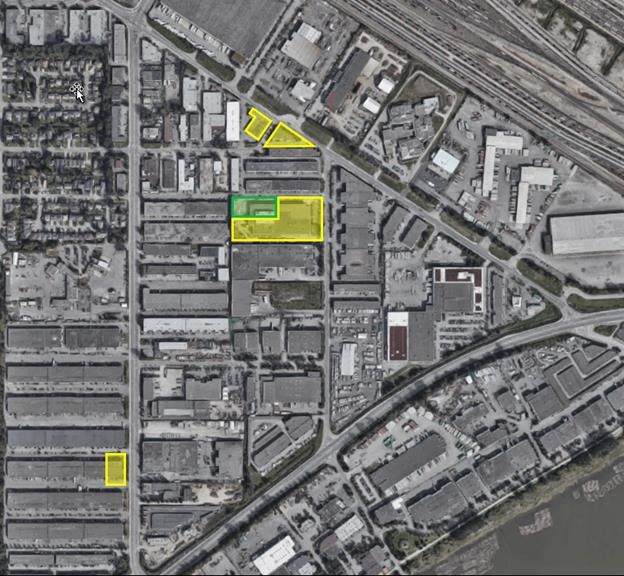
Page 19State-of-the-Art Manufacturing Facilities
The Company is in the process of repositioning shop capacity from fabrication to manufacturing
Vancouver Facility
Engineering & Manufacturing
22% reduction in square footage,
eliminating the red facility in favour of the
yellow/green facilities shown below.
• Shop: 132,226 sf
• Office: 30,475 sf
• Total: 162,701 sf
Utilized by
Major Client
Utilized by
Major Client
Orlando Facility
Show Support, Customer Centric Engineering, Parts
& Service
• Shop: 65,000 sf
• Office: 15,000 sf
• Total: 80,000 sf
Page 20Awards and Accolades
Consistently winning innovation awards
“Themed Attraction of the Year” “Advancing Technology Export Award”
“Media-Based Attraction of the Year” “Best New Attraction Concept”
“Best Technology Applied to “Best New Product”
Amusement Rides”
“Best New Attraction Concept”
“Best New Attraction Concept”
“Innovations in Technology Award”
“Best New Attraction Concept”
Source: Company Disclosure
Page 21Smoky Coming Soon: Mountains Flyers • Smoky Mountain Flyers is located at The Island in Pigeon Forge amusement park (Tennessee) • It will feature a 39-seat Dynamic Flying Theatre and is scheduled to open in 2021 • The Island is a top destination in a dense tourism region near the Smoky Mountains which draws 11 million tourists per year • Empire has an option to acquire a 22 50% share of this Co-venture.
Dynamic Flying Theatre Overview
Experience Overview                                                    Construction Overview
• Guest enters into what looks like a typical theater                     Project Steps                      Duration

• Once guests are buckled-in the show begins, the seats                     Engineering and Detailing        12‐14 weeks
  lifts into the air, transitioning from the horizontal                     Manufacturing and Fabrication    16‐22 weeks
  seating arrangement to a vertical or stacked seating                      Factory Acceptance Test          6 weeks
  arrangement                                                               Disassembly and Shipping         6-9 weeks
                                                                            Site Installation                16-20 weeks
• Due to the seating arrangement, every guest finds                         Test and Commissioning           2 weeks
  themselves to be fully immersed in the show                               Training and Operations run in   4 weeks
• The seats move in                                                      Total (Based on prior projects)     62-77 weeks
  synchronization with
  the media resulting in
  an unmatched
  experience that can
  only be compared to
  flying
• Once the show is over, the theater returns to its
  original horizontal position, similar to a typical
  theater
Attraction Overview
• High definition 4K projection on a spherical screen
Special Effects

    Winds          Scents               Vibration    Water Spritz
                        Source: Company Disclosure                  Page 23
Dynamic is an Industry Leader in Flying Theatres
Hubei in the Air Batman @ Studio City, Macau Krish: Hero’s Flight
Wuhan, China 2014 Macau, China 2015 Dubai, UAE 2016
Wings Over Washington @ Pier 57 Voyage Extraordinaire Fly Venture
Seattle, Washington 2016 France Seoul, Korea 2017 2016
Soaring Over Moscow The Island Flyer Independence Day
2016
Moscow, Russia 2017 Pigeon Forge, TN Kuala Lumpur, Malaysia 2019
Trans Studio Bali Mall of Qatar Lotte Shenyang
Bali, Indonesia Doha, Qatar Shenyang, China
Page 24Dynamic Co-ventures Investment Returns
Recurring profit and leverage drives
strong return on investment and quick
payback to investors
(Potential ~3-4 year payback)
Destination Destination
Partner Debt $13-16M2
50% Equity1 + 50% Equity1
+ Financing = Total Investment
(IP & Production
Expertise) (Market Knowledge)
Financial structure of the capital requirements will be negotiated between the local partner and Dynamic
Entertainment Inc. on a case-by-case basis. Actual results may vary significantly from these numbers
Page 25
1. Financial structure of the capital requirements will be negotiated between the local partner and Dynamic Entertainment Inc. on a case-by-case basis
2. Represents the initial investment required to setup the Flying Theater, including movie production, preshow installation, general theme of the attraction (costs largely
depends on the size of the theater.) Dynamic Attractions to be contracted to build the attractions in any Co-venture projectIndicative co-venture investment returns
Financial structure of the capital requirements will be negotiated between the local partner and Dynamic
Entertainment Inc. on a case-by-case basis. Actual results may vary significantly from these numbers
Page 26IV. Industry Overview
“Out-of-Home” competes with “In-Home” Entertainment

Participation Index of Selected Leisure Activities by US Population Ages 7+
                                   120

                                   110
 100= 2004 Rate of Participation

                                                                 2004 Participation Rate
                                   100
       Participation Index

                                    90
                                                                                                                                                 Movies
                                    80
                                                                                                                                                 Bowling            -26%
                                    70                                                                                                                              -31%
                                                                                                                                                 Golf               -35%
                                    60
                                                                                                                                                 Billiards          -46%
                                    50

                                    40
                                           2004   2005    2006        2007      2008       2009      2010    2011   2012       2013   2014     2015      2016   2017

Fidelity Range

                                             Strong “in-home” Project                                                      Strong “out-of-home” Project
                                                                                                                                               Wizarding World of
                                                                                                                    Rock Concert                  Harry Potter
                                                                                                   Weak
                                                                                                  Project

                                                                               Attractions must be high fidelity, or they
                                         Convenience                                                                                         High Fidelity
                                                                             risk substitution to convenient alternatives

                                                                                                   Page 28
Dynamic Entertainment Occupies the Sweet Spot
World class Shared Experiences
People Want to Build Social Capital
• Facilitates socialization and
encourages repeat visits
• Experience economy is thriving
Popular
in the digital age Content & IP
Is it Instagrammable?
Popular Content & IP
Immersive Film Concerts & eSports Technology Market
• Ability to leverage popular Capability Needs
videogame, film and music
studio IP to increase
marketability
Immersive, Complex Technology
Media Based, High Tech Rides Market Breakthrough
• Incorporates high fidelity film
content or interactive gaming Products
content, music & special
effects
Page 29Global Amusement Park Industry Trends1
Global Amusement Park Industry Overview Global Amusement Park Guest Spending
(US$ billions)
• Global theme and amusement park market rose 6.8% $62 $66
$59
in 2018 to US$49 billion in spending $49 $52 $55
$43 $46
$38 $40
$35
• Attendance continued to be the principal driver of
global spending, with a 3.4% gain in 2018
• During 2013-18, the theme and amusement park 2013 2014 2015 2016 2017 2018 2019E 2020E 2021E 2022E 2023E
market has outpaced global economic growth
Global Amusement Park Attendance
− Spending averages a 6.3% CAGR compared to the (in millions)
1,290 1,335
4.8% average of the nominal GDP 1,200 1,244
1,084 1,122 1,157
931 957 1,006 1,041
− Theme park spending is expected to stay constant
for the 2019-23 period at 6.3% CAGR, again
outpacing the projected 4.7% of global economic
growth 2013 2014 2015 2016 2017 2018 2019E 2020E 2021E 2022E 2023E
• Majority of the increase in global spending in 2019-23 Global Amusement Park Spending vs Nominal GDP
will be driven by gains in attendance 200
− Attendance is expected to grow at 3.6% CAGR 180
160
comparable to 3.8% for 2013-18 period 140
120
100
2012 2013 2014 2015 2016 2017 2018 2019 2020 2021 2022
1. Source: IAAPA Global Theme and Amusement Park Outlook: 2018-2023 Theme Park Spending Nominal GDP
Page 30Global Amusement Park Industry Trends
Current Attractions at Amusement Parks
(What attractions do you currently have at the facility? Please select all that apply
(n=154)
79% 79% 79%
68% 68%
58% 58% 58% 55% 55%
54%
45%
41% 41% 40%
37%
33%
29% 27%
25% 25% 25% 23%
21% 19% 18%
16% 14% 14%
8% 8% 8% 7%
Desired new attractions in next 1 to 3 years
(If the facility were to add one new attraction in the next one to three years, what would it be?
(n=154)
Company is well positioned to capitalize on the future
36%
capital spending desires of Amusement Parks
27%
14%
12% 12% 12%
10%
8% 8%
6% 6% 6% 6% 5% 5% 5% 5% 4% 4% 3% 3% 3% 3% 3% 3% 2% 1% 1% 1% 1%
Source: IAAPA Global Theme and Amusement Park 2018 Page 31V. Financial Information
Strategic Pivots
                    Pivot #1 - Completed                                                           Pivot #2                            Effect of Pivot on Employment
• Change strategic focus to contract ride manufacturing while
   surviving the 2008 to 2011 recession impact on steel                           • Recapitalize to strengthen balance sheet
   fabrication
                                                                                  • Position the Company for continued
   ‒ Net Income loss of $19.8M from continuing operations during                     global leadership in ride design and
      the recession of 2008 -2012                                                    manufacturing. Increased from 50 ride
   ‒ Net Income loss of $20.7M from discontinuing steel                              business employees in 2008 to over 300
      fabrication operations                                                         employees now
• Dividend Tornado Trucks to Empire Shareholders in 2016 for                      • Leverage attraction IP and know-how
   gain on sale of over $5.0M                                                        with co-venture investments
• Generated $63.7MM of EBITDA since 2006, excluding losses
   from first generation jobs. Used to finance the business and                                                                               Future
   to fund the R&D for the first generation jobs, $24.2MM of                                                                                  ⚫   Co-ventures
   which has been expensed                                                                                                                    ⚫   Media Based Attractions sales
                                                                                                                                              ⚫   Custom Ride Sales
• Invest in proprietary ride IP and attraction knowhow to
   supplement Universal & Disney build to print work.

                                                                              Rides Business
                                                                              ⚫   Development of proprietary IP in
                                                                                  ride design and manufacture
  CPC Qualifying Transaction                                                  ⚫   Focus on major rides for Disney &
  ⚫  Construction Boom Western Canada                                             Universal
     and Steel Fabrication
  ⚫  Completed $45 Million of acquisitions
     in this period

           2006                              2008                                 2012                           2015                            2019
                                       Contraction                                                        R&D
                                       ⚫  Start of Recession                                              ⚫  R&D investment into first generation rides
                                       ⚫  Survival Mode                                                   ⚫  Complete divestiture of steel fabrication
                                       ⚫  Begin Exit steel fabrication business

                                                                                         Page 33
Project Backlog: Demand continues to be strong
Contract Backlog1
(C$ millions) Represents more than 2 years of production
work at the current rate of production
252.0
228.0 230.0
155.0
130.0
109.0
2
2014 2015 2016 2017 2018 2019
Key Highlights
• Averaging $230 million contract backlog in the past three years
• Less than 10% of this backlog consists of the three first-generation projects that carry no future margin with the expected losses already
recognized in 2017, 2018 and 2019 results
• The contract backlog is expected to be replenished by the opportunities currently in the sales pipeline3
• In addition to its existing sales pipeline of potential new projects, the Company is continuing its business development efforts to identify
and establish future projects
1. Contract backlog is work under contract where the associated work has not yet been performed and the
associated revenue has not yet been recognized.
2. As at September 30, 2019
Page 34
3. Sales pipeline is composed of potential future projects that have been identified by the Company’s sales force,
but are not yet under contractShare Capitalization
Share Capitalization
Common Shares Outstanding Notes
Common Shares at Oct. 16, 2019 103,142,678
Preferred Shares Exchanged for Common Shares 32,906,161 Per Dec. 31, 2019 news release: 100% of Preferred holders converted to common
Private Placement 23,780,487 Per Dec. 30, 2019 news release: Issued Common Shares for gross proceeds of $9.75m
Warrants Exercised for Common Shares 3,500,000 Exercised at $0.50
Pro Forma Common Shares Outstanding 163,329,326
Other Dilutive Securities Notes
Options 4,457,067 As of November 26, 2019. Average Exercise Price: $0.45
Warrants 7,611,110 $0.75 exercise price
Total Dilutive Securities 12,068,177
Fully Diluted Equivalent Common Shares 175,397,503
Source: Company Disclosure
Page 35Capital markets information
0.55 3.50mm
3.00mm
0.50
2.50mm
0.45
2.00mm
1.50mm
0.40
1.00mm
0.35
.50mm
0.30 0
Volume Share Price
Stock Price: 52 week high/low ……………….……. $0.54/$0.31 Annual Revenues (TTM Sept. 30, 2019) …..…... $120 million
Number of Shares ..………….……………………….…163.5 million Annual Adj. EBITDA (TTM Sept. 30, 2019) …. $(13.8) million
Avg. Daily Trading Volume (last 6 months) …..…….…..… 60K Annualized Q3 2019 EBITDA …........................... $8.4 million
Market Cap (January 13, 2020) $76.8 million ($0.47/share) Long Term Funded Debt (Sept 30, 2019) ….... $35.5 millionThird Quarter 2019 Financial Highlights
YTD YTD
Q3 Q3
CDN $ M Q3 Q3
2019 2018
2019 2018
Revenue $27.000 $51.800 $95.500 $116.500
Adjusted EBITDA $2.100 $1.700 $6.000 $3.600
Adjusted EBITDA % 7.9%00 3.2%00 6.3%00 3.1%00
Net Income (loss) ($3.4)00 $0.2 00 ($1.8)00 $(2.0)00
Net Income (loss)/ Share-
($0.03)00 $0.00 00 ($0.02)00 $(0.02)00
Basic 37Industry Comparables
Market Total Revenues Market Cap /
Capitalizations [LTM] Total Revenues
($ millions) ($ millions) [LTM]
Disney (NYSE) 340,394.4 90,850.1 3.7x
Comcast (NasdaqGS) 267,216.1 141,544.3 1.9x
Customers
Evergrande (SEHK) 49,261.6 74,142.0 0.7x
Six Flags (NYSE) 3,969.2 1,953.7 2.0x
Cedar Fair (NYSE) 4,021.0 1,916.3 2.1x
Viad (NYSE) 1,761.2 1,759.4 1.0x
Comparables
IMAX China (SEHK) 1,008.8 163.6 6.1x
Brogent Technologies (GTSM) 437.1 91.2 4.8x
Sansei Technologies (TSE) 194.4 582.6 0.3x 38
Empire Industries (TSXV) 77.6 119.9 0.6x
Source: Capital IQ, Jan 13,2020; all currencies converted to CADKey capital events
Nov 2017 $3.9 M rights offering at $0.50/share
Dec 2017 $3.0 M subscription receipts at $0.50/share
Dec 2017 Jolly Admire purchases 26.5% of DEGL
May 2018 $5.0 M private placement at $0.45/share
June 2018 Shareholder warrants exercised;
$1.7 M at $0.272/share
April 2019 $38.5 M debt financing,
resulting in $19.5 M in incremental cash
May 2019 $7.55 M of 8% Convertible Preferred Shares
Oct 2019 $1.0 M proceeds at $0.50/share from
common share warrants exercised
Nov 2019 Re-acquired 26.5% of DEGL from Jolly Admire
for 381,000 Convertible Preferred Shares
Dec 2019 Sold $3.0 M of Tornado Shares for cash
Dec 2019 $9.75 M private placement at $0.41/share
Dec 2019 $0.75 M proceeds at $0.50/share
from common share warrants exercised; 39
Dec 2019 100% of $11.36 M of Convertible Preferred Shares were exchanged for 32.9 M common shares,
eliminating the company’s future dividend obligationsWhy invest now ?
• Empire’s global customers are making
unprecedented investments in new
attractions
• Empire’s high demand because of its
attractions industry leadership position,
proprietary products & IP
• Empire has recently strengthened its
balance sheet, pivoted out of its
challenged legacy businesses and
invested heavily in building its world
class, proprietary IP
• Empire has approximately two years of
contract backlog in the ride business, and
its co-venture initiative is designed to
deliver recurring revenue & profit
40Thank you
empind.com
TSXV: EIL
OTC: ERILFYou can also read