Corporation First Quarter Earnings Call - 1 Entergy - Seeking Alpha
←
→
Page content transcription
If your browser does not render page correctly, please read the page content below

Entergy

April 28, 2021
                 Corporation
                 First Quarter
                 Earnings Call
Caution regarding forward-looking statements and
                   Regulation G compliance
In this presentation, and from time to time, Entergy Corporation makes certain “forward-looking statements” within the meaning of the Private Securities Litigation Reform
Act of 1995. Such forward-looking statements include, among other things, statements regarding Entergy’s 2021 earnings guidance; its current financial and operational
outlooks; and other statements of Entergy’s plans, beliefs, or expectations included in this presentation. Readers are cautioned not to place undue reliance on these
forward-looking statements, which apply only as of the date of this presentation. Except to the extent required by the federal securities laws, Entergy undertakes no
obligation to publicly update or revise any forward-looking statements, whether as a result of new information, future events, or otherwise.
Forward-looking statements are subject to a number of risks, uncertainties, and other factors that could cause actual results to differ materially from those expressed or
implied in such forward-looking statements, including (a) those factors discussed elsewhere in this presentation and in Entergy’s most recent Annual Report on Form 10-K,
any subsequent Quarterly Reports on Form 10-Q, and Entergy’s other reports and filings made under the Securities Exchange Act of 1934; (b) uncertainties associated
with (1) rate proceedings, formula rate plans, and other cost recovery mechanisms, including the risk that costs may not be recoverable to the extent anticipated by the
utilities and (2) implementation of the ratemaking effects of changes in law; (c) uncertainties associated with efforts to remediate the effects of major storms and recover
related restoration costs; (d) risks associated with operating nuclear facilities, including plant relicensing, operating, and regulatory costs and risks; (e) changes in
decommissioning trust fund values or earnings or in the timing or cost of decommissioning Entergy’s nuclear plant sites; (f) legislative and regulatory actions and risks and
uncertainties associated with claims or litigation by or against Entergy and its subsidiaries; (g) risks and uncertainties associated with executing on business strategies,
including strategic transactions that Entergy or its subsidiaries may undertake and the risk that any such transaction may not be completed as and when expected and the
risk that the anticipated benefits of the transaction may not be realized; (h) effects of changes in federal, state, or local laws and regulations and other governmental
actions or policies, including changes in monetary, fiscal, tax, environmental, or energy policies; (i) the effects of changes in commodity markets, capital markets, or
economic conditions; (j) impacts from a terrorist attack, cybersecurity threats, data security breaches, or other attempts to disrupt Entergy’s business or operations, and/or
other catastrophic events; (k) the direct and indirect impacts of the COVID-19 pandemic on Entergy and its customers; and (l) the effects of technological change, including
the costs, pace of development and commercialization of new and emerging technologies.

This presentation includes the non-GAAP financial measures of adjusted EPS; adjusted ROE; adjusted ROE, excluding affiliate preferred; parent debt to total debt,
excluding securitization debt; FFO to debt, excluding securitization debt; FFO to debt, excluding securitization debt, return of unprotected excess ADIT, and severance and
retention payments associated with exit of EWC; and adjusted EBITDA when describing Entergy’s results of operations and financial performance. We have prepared
reconciliations of these financial measures to the most directly comparable GAAP measure, which can be found in this presentation. This presentation should be
considered together with the Entergy earnings release to which this teleconference relates, which is posted on the company’s website at www.entergy.com and which
contains further information on non-GAAP financial measures.

                                                                                                                                                                           1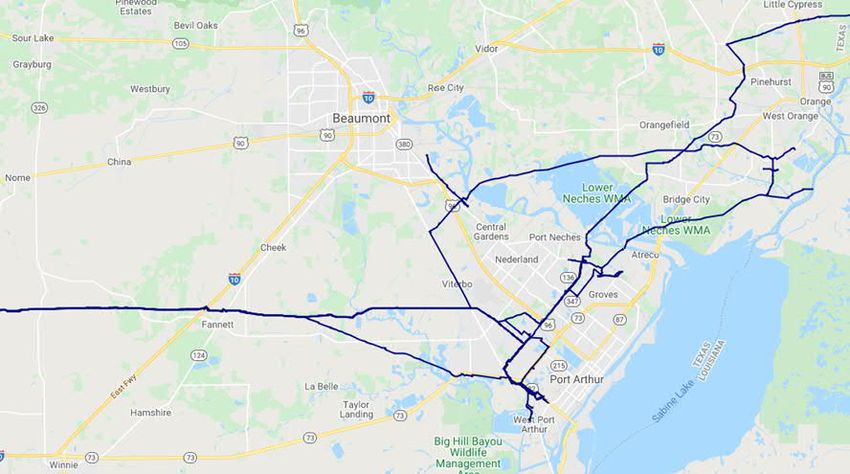
Table of contents

Section                                                  Slides
Business discussion                                      3-10
Appendix
  Environmental disclosures                              12-21
  Utility                                                22-41
  EWC                                                    42-46
  Financial disclosures                                  47-49
  Financial summaries and Regulation G reconciliations   50-55

                                                                  2
Industry leader in critical measures of sustainability

                   Among the lowest retail rates in the U.S.

                   One of the cleanest large-scale generation fleets
                   in the U.S.

                   Robust capital plan to meet our customers’
                   evolving needs
Uniquely           Strong 5% to 7% adjusted EPS growth
positioned to be   Expect dividend growth rate in line with
                   adjusted EPS growth rate by 4Q21

                   Commitment to continuous improvement

                                                                            3
2021 key deliverables
    1Q                                                  2Q                                                           3Q                                        4Q
ü   MCPS in service               ü                  E-AR 2020 solar RFP         •                                   Liberty County Solar •                    ~3M advanced
ü   MCPS in rates                                    announced (added 2Q)                                            decision (PUCT)                           meters installed
ü   NOSS in rates                 •                  E-MS IRP filing             •                                   OCPS filing (PUCT)                        (cumulative)
ü   E-TX 2021 solar RFP           •                  Walnut Bend Solar decision •                                    West Memphis Solar •                      Sunflower Solar
    announced                                        (APSC)                                                          decision (APSC)                           project completed
ü   E-LA 2020 solar RFP announced •                  E-NO annual FRP filing      •                                   E-LA renewable       •                    Searcy Solar project
    (added 1Q)                    ü                  E-MS FRP rates effective1                                       RFP selections                            completed
ü   E-AR FRP rates effective      •                  E-MS FRP decision           •                                   E-AR FRP filing      •                    E-AR IRP filing
ü   E-AR 2021 FRP rehearing and                      (MPSC)                      •                                   E-LA FRP rates       •                    E-TX Power
    FRP extension decisions       •                  E-LA FRP filing 2
                                                                                                                                                               Through decision
                                                                                                                     effective2
    (APSC) (resolved 2Q)          •                  E-TX 2020 DCRF decision •                                                                                 (PUCT)
                                                                                                                     E-TX 2021 DCRF
•   E-LA FRP extension decision                      (PUCT) (settlement filed)
                                                                                                                     filing               •                    MTEP 2021
    (LPSC) (settlement reached,   •                  E-TX 2020 TCRF decision
    expected 2Q)                                                                 •                                   E-TX 2021 TCRF                            approval
                                                     (PUCT) (settlement filed)
ü E-MS annual FRP filing                                                                                             filing               •                    E-NO FRP rates
                                                   • E-NO storm cost filing                                                                                    effective
• E-LA storm cost filing (expected                 • Indian Point 3 shutdown
    2Q)                                                                                                                                                      • E-AR FRP decision
                                                   • Indian Point sale to Holtec
ü E-TX storm cost filing (filed 2Q)                                                                                                                          • Annual dividend
ü SERI ROE initial decision (ALJ)                                                                                                                              review
                    Estimated timing as of February 2021; regulatory activity or other factors could lead to changes
                    1 Rate change up to 2% effective April 1, any rate change above 2% would be effective the month following the receipt of an MPSC order
                    2 Subject to commission approval of extension
                                                                                                                                                                                      4
First quarter Entergy adjusted EPS

Entergy adjusted EPS; $

                                                                                                 Key takeaways
                                                                                                 · Strong results to start the year
                                                                                                 · Regulatory resolutions provide
                                                                   1.47                            clarity and reduce risk
   1.14                                                                                          · Confident in steady, predictable
                                                                                                   adjusted EPS and dividend growth

  1Q20         Utility                   P&O                      1Q21

            Calculations may differ due to rounding; see Financial summaries and Regulation G reconciliations section for earnings summary
            201M and 201M diluted average common shares outstanding for 1Q21 and 1Q20, respectively
                                                                                                                                             5
First quarter Entergy adjusted EPS
Entergy adjusted EPS; $

                               (–) Nuclear and
                                                                                                     (–) Higher
                                   non-nuclear (–) Depr.                           (+) NDT
                                                                                                         OpCo debt                                          (–) 1Q20 tax
                                   generation                                          performance
                                   expenses                                            (largely offset)                                                         items, net of
          (+) Volume / weather                                                                                                                                  customer
                                                                                   (–) AFUDC
          (+) Reg. actions                                                                                                                                      sharing
          (+) E-AR reg.                                                                                                                                                                     1.47
              provision
   1.14   (–) Reg. cr. for
              decomm. items
              (largely offset)

  1Q20         Utility                Utility                 Utility                   Utility                 Utility                 P&O                      Income                     1Q21
             operating                other                   other                     other                  interest             excl. income                  taxes 1
           rev. less fuel,            O&M                   operating                  income                    exp.                  taxes
                                                                      2
           purch. power                                     expenses
              and reg.
               chrgs.1
                   See Financial summaries and Regulation G reconciliations section for earnings summary
                   201M and 201M diluted average common shares outstanding for 1Q21 and 1Q20, respectively
                   1 Utility operating revenue / regulatory charges and Utility income taxes exclude $41M in 1Q21 and $30M in 1Q20 for the return of unprotected excess ADIT to customers

                     (net effect is neutral to earnings)
                   2 Other operating expenses include nuclear refueling outage expense, depreciation expense, taxes other than income taxes, and decommissioning expense
                                                                                                                                                                                                   6
First quarter EWC as-reported EPS

EWC as-reported EPS; $

                                                                                                                                                                    0.19
   (0.55)

                                                                        (+) NDT
              (–) Shutdown                (+) Shutdown                      performance
                  of IP2                      of IP2

   1Q20         Operating                    Operating                       Other                       Income                        Other                        1Q21
              rev. less fuel                 expenses 1                     income                        taxes
               and purch.
                 power

            See Financial summaries and Regulation G reconciliations section for earnings summary
            201M and 201M diluted average common shares outstanding for 1Q21 and 1Q20, respectively
            1 Operating expenses include other O&M, nuclear refueling outage expense, depreciation expense, taxes other than income taxes, and decommissioning expense
                                                                                                                                                                           7
First quarter OCF
Key drivers reflect timing differences between expenditures and recovery

     Consolidated OCF; $M           Key drivers
                                    · Recovery timing
                                       o ~$350M fuel and purchased power cost
                                         recovery, primarily related to Winter Storm Uri
           659                         o ~$200M payments for hurricane restoration
                                         (non-capital portion)
                                    · Higher pension funding
                            (50)

          1Q20              1Q21

                                                                                           8
Credit and liquidity
FFO to debt affected by timing of storm costs vs. recovery
    Parent debt to total debt1; %                                                 FFO to debt1; %

                                                                                  8.7% excluding
                                               < 25%                              certain items2                        ³ 15%
               22.3
                                                                                               8.2
              1Q21                      Target                                               1Q21                       Target
                                                                                                                         2022

                                                                          • FFO to debt temporarily lower than target due largely
                                                                            to impact of storms, including Winter Storm Uri
                                                                          • Expect to return to targeted levels in 2022 once
                                                                            securitization proceeds received

    1   Excludes securitization debt; see appendix for Regulation G reconciliation
    2   Excludes securitization debt, return of unprotected excess ADIT, and severance and retention payments associated with exit of EWC; see appendix for Regulation G
        reconciliation
                                                                                                                                                                           9
Adjusted EPS guidance and outlooks
Entergy adjusted EPS; $
$5.60
original 6.55–6.85
guidance 6.15–6.45
5.80–6.10
midpoint 5.66
20 21E guidance 22E outlook 23E outlook
As-reported
6.90
1 Based on original 2020E guidance midpoint of $5.60
10Appendix
11Leader in sustainability
• Entergy is the only U.S. company in the
electric utility sector to be included on the
DJSI for 19 consecutive years
• In 2020, perfect scores in
ü Climate strategy
ü Environmental reporting
ü Materiality
ü Policy influence
ü Social reporting
ü Water-related risks
12Committed to maximizing clean energy
Committed to work with our regulators
and other stakeholders to balance Reliability
reliability and affordability with
environmental stewardship Our clean
energy
investment
strategy
Affordability Environmental
stewardship
13
1320 years of environmental leadership
2001 2006 2011 2019 2020
First U.S. utility Intensified Extended CO2 Introduced new
Commitment
to voluntarily set commitment with reduction goal to reduce
goal to stabilize a goal to reduce commitment Utility CO2 to achieve
greenhouse gas CO2 emissions through 2020 emission rate by net-zero
emissions by 20% below 50% below year-
emissions
year-2000 levels 2000 levels by
through 2010 2030 by 2050
14
14A track record of results
Entergy Utility CO2 emission rates; lbs per MWh
U.S. power sector average
Net
zero
2000 2010 2020 2030 2050
goal goal
Reduction vs 2000 ~20% ~37% 50% 100%
Reduction vs 2020 ~20% 100%
15
15Among the cleanest large-scale fleets in the U.S.
CO2 emission rates of top 20 privately- / investor-owned power producers; lbs per MWh
Entergy Utility
Based on MJ Bradley, Benchmarking Air Emissions of the 100 Largest Electric Power Producers in the
United States, published July 2020 (2018 data)
16
16Minimal coal generation
Coal generation of top 20 privately- / investor-owned power
producers; MWh • Less than 5% of 2020
revenue was derived from
coal assets
• Less than 2% of 2020 rate
base was comprised of coal
assets
Entergy Utility • Intend to retire all coal-fired
capacity by end of 2030
Based on MJ Bradley, Benchmarking Air Emissions of the 100 Largest Electric
Power Producers in the United States, published July 2020 (2018 data)
17Growing our renewables portfolio
Illustrative
In service, in progress, and West
announced renewables portfolio Searcy Memphis
Walnut Bend
DeSoto
537 MW in service Carpenter Remmel Stuttgart
~445 MW installations in progress Chicot
Sunflower
380 MW announced
Plus: Hinds
• Four RFPs for renewable Brookhaven
Toledo Bend
resources totaling 1,300 MW Vidalia
Springfield
Iris
Capital Region
Umbriel ECO
Agrilectric
Montauk Rain CII St. James
Liberty County Paterson
New Orleans
Solar Station
18Entergy / Mitsubishi decarbonization collaboration
Combining the strengths of industry leaders to move towards net-zero
Identified areas of collaboration
CCGT New build Storage CCGT Nuclear
innovation resource projects expansion hydrogen
Demonstrate Includes storage, Storage and Convert renewables Nuclear-supplied
hydrogen flex new build, and conversion to green hydrogen, electrolysis facility
concepts battery with battery with storage
19
19Multiple hydrogen pipelines nearby existing plants
Illustrative
Hydrogen pipeline infrastructure Multiple hydrogen pipelines nearby
Texas industrial corridor leveraging existing infrastructure
Company A pipeline
3
1 2
2 Sabine Power Plant
Hydrogen pipelines (site for proposed
Orange County Power Station)
1 Large scale storage (Spindletop)
2 Entergy’s Sabine Power Plant
3 Hydrogen storage facility (third party)
20
20Extensive and transparent sustainability reporting
Visit Entergy’s
Sustainability page
entergy.com/sustainability
21
21Utility overview
E-AR E-LA E-MS
• Electric utility • Electric and gas utility • Electric utility
722,000 customers 1,096,000 electric customers 456,000 customers
• Authorized ROE: 9.15% – 10.15%1 94,000 gas customers • Authorized ROE: 9.03% – 11.08%
• Forward test year FRP • Authorized ROE: • FRP with forward-looking features
Electric 9.0% – 10.0%2
Gas 9.3% – 10.3%
• Electric FRP with riders (incl.
capacity, transmission, distribution)2,
Gas RSP
E-NO E-TX
• Electric and gas utility • Electric utility
207,000 electric customers 473,000 customers
108,000 gas customers • Authorized ROE: 9.65%
• Authorized ROE: 8.85% – 9.85% • Rate case and cost recovery riders
• FRP with forward-looking features (transmission, distribution, and
generation)
See operating company slides for more details
Customer counts at the end of period 12/31/20
1 Expected ROE range effective with the 2022 rate change
2 Commission decision pending, would be effective with 2021 rate change
22Utility 2020 electric retail sales
2020 electric retail sales; % of total
Governmental
2
E-TX
E-AR
17 Residential
19
Industrial
E-NO 32
5
42
11
E-MS
48 24
E-LA
Commercial
23Utility generation overview
2020 generation sources; % Owned and leased capability
as of 12/31/20; %
Renewables1
2 Coal Our business plan
Purchases CT/CCGT 9 supports our
18 Nuclear CT/CCGT
34 22 40 2030 commitment to
Coal 3
reduce our 2000 Utility
29 13
CO2 emission rate by
Nuclear 29
Legacy gas 50% (or better)
Legacy gas
1 Includes generation from both owned and purchased power resources as well as renewable energy credits
24Credit ratings
Credit ratings1 (outlooks)
E-AR E-LA E-MS E-NO E-TX SERI ETR
S&P A A A A- A A BBB+
(stable) (stable) (stable) (negative) (stable) (stable) (stable)
Moody’s A2 A2 A2 Baa2 Baa1 Baa1 Baa2
(stable) (stable) (stable) (stable) (positive) (stable) (stable)
1 Senior secured ratings for the OpCos and SERI; corporate credit rating for ETR
25Entergy Arkansas
E-AR (currently in rates)
Metric Detail
Authorized ROE 9.25%–10.25%
Rate base $8.4B retail rate base (2021 test year)
WACC (after-tax) 5.04%
Equity ratio 36.6% (47.0% excluding $1.8B ADIT at
0% cost rate)
Regulatory construct Forward test year FRP; result outside authorized
ROE range resets to midpoint; maximum rate
change 4% of filing year total retail revenue;
true-up of projection to actuals netted with future
projection
FRP rate change $40M retroactive to Jan. 2021 (to be collected
May to Dec. in 2021)
Riders Fuel and purchased power, MISO, capacity,
Grand Gulf, tax adjustment, energy efficiency
26Entergy Arkansas
Walnut Bend Solar and West Memphis Solar
Walnut Bend Solar West Memphis Solar
Item Details Item Details
Docket 20-052-U Docket 20-067-U
MW 100 MW 180
Location Fleener Township, AR Location West Memphis, AR
Recovery Proposed FRP or a rider Recovery Proposed FRP or a rider
mechanism mechanism
Key dates Key dates
Date Event Date Event
6/15/21 Final order (requested) 9/7/21 Final order (requested)
See Management’s Financial Discussion and Analysis in the most recent Form 10-K and/or any subsequent Form 10-Qs
27Entergy Louisiana
E-LA (currently in rates)
Metric Detail – electric1 Detail – gas
Authorized ROE 9.2%–10.4% 9.3%–10.3%
Last filed rate base $11.9B (12/31/19 test year) $0.08B (9/30/19 test
+ $0.4B for transmission rider year)
+ $1.1B for capacity rider
WACC (after-tax) 6.97% 6.96%
Equity ratio 48.63% 48.37%
Regulatory construct FRP; 60/40 customer/company RSP2
sharing outside bandwidth
FRP and certain rider $45M FRP (transmission rider) $(0.7M) IIRR-G
rate changes3 (Sept. 2020); $108M for LCPS
(April 2020) and $35M for WPEC
(Dec. 2020) included in capacity
rider (first year annual revenue
requirements)
Riders / specific Fuel, capacity, MISO, transmission Gas infrastructure
recovery
1 Pending finalization of the 2019 test year filing (docket U-35581), the 2018 test year filing (docket U-35205), and the 2017 test year filing (docket U-34951)
2
3
50 bps dead band, 51 bps–200 bps 50% sharing, >200 bps adjust to 200 bps plus 75 bps sharing; for infrastructure costs, 100% sharing above the band
Does not include MISO / other or tax reform adjustment mechanism (amount varies over time)
28Entergy Louisiana
Stipulated settlement on FRP extension
FRP extension settlement highlights (docket U-35565) – pending LPSC approval
· Extension period: three years (2021–2023 filing years)
· Allowed ROE: 9.0% – 10.0% (9.5% midpoint)
· No sharing outside allowed ROE band
· Transmission and capacity cost riders unchanged
· Added distribution rider for recovery of up to $225M of distribution investment per calendar year above annual floor
· Modified tax recovery adjustment mechanism to allow for timely recovery of future tax rate changes
· 2021 filing year submission due by 6/30/21
· 2021 filing year FRP base revenue set at $63M, excluding riders; requested rider changes to be included in FRP filing
· Cumulative FRP base revenue increases for 2022 and 2023 filing years limited to $70M, excluding riders
Key dates
Date Event
5/19/21 LPSC open session
See discussion of Rate and Regulatory Matters in the most recent Form 10-K and/or any subsequent Form 10-Qs
29Entergy Mississippi
E-MS (currently in rates)
Metric Detail
Authorized ROE 10.06% performance-adjusted midpoint (9.43% + 0.63%
performance factor); 9.03% – 11.08% range (annual
redetermination based on formula)
Rate base $3.6B (2021 forward test year)
WACC (after-tax) 6.85%
Equity ratio 48.63%
Regulatory FRP with forward-looking features; performance-based
construct bandwidth; subject to annual “look-back” evaluation;
maximum rate increase 4% of test year retail revenue
(increase above 4% requires base rate case)
FRP and certain $22M FRP (April 2021)1; $2M true-up for Choctaw (April
rider rate changes 2021); $4M for DSM added to FRP (April 2021)
Riders Fuel, Grand Gulf, MISO, unit power cost, storm damage,
ad valorem tax adjustment, vegetation, grid modernization,
restructuring credit, PMR
1 April 2021 increase capped at 2% of base-year revenues; the remaining 2% requested in rates upon Commission approval
30Entergy Mississippi
Annual FRP filing
Annual FRP – (docket 2018-UN-205)
Filing highlights 2021 test year 2020 look-back
Allowed ROE midpoint, incl. performance factor 10.06% 9.92%
Allowed ROE range 9.03%–11.08% 8.90%–10.94%
Earned ROE 5.66% 8.44%
Rate base $3.6B $3.3B
WACC (after-tax) 6.85% 6.82%
Equity ratio 48.63% 49.09%
Revenue deficiency $95.4M $18.5M
Requested rate change $44.3M1 (4% cap) plus $3.9M $18.5M
demand side management recovery
Key dates
Date Event
June 2021 Final order expected
July 2021 Permanent rates effective
See discussion of Rate and Regulatory Matters in the most recent Form 10-K and/or any subsequent Form 10-Qs
1 April 2021 increase capped at 2% of base-year revenues; the remaining 2% requested in rates upon Commission approval
31Entergy New Orleans
E-NO (currently in rates)
Metric Detail – electric Detail – gas
Authorized ROE 9.35% 9.35%
Rate base $0.8B (12/31/18 test year and $0.1B (12/31/18
known and measurables through test year and
12/31/19), $0.19B NOPS in FRP known and
interim adjustment, and $0.04B measurables
NOSS in purchased power rider through 12/31/19)
WACC (after-tax) 7.09% 7.09%
Equity ratio 50% 50%
Regulatory construct FRP with forward-looking features FRP with forward-
looking features
Base rate change and $(13M) (April 2020, retroactive to $(2M)
certain rider changes Aug. 2019) (including ~$(6M) for
depreciation rate decrease), $33M
for NOPS (Nov. 2020) and $5M for
NOSS (Jan. 2021) (first year
revenue requirements)
Riders / specific recovery Fuel and purchased power, MISO, Purchased gas
energy efficiency, environmental
32Entergy Texas
E-TX (currently in rates)
Metric Detail
Authorized ROE 9.65%
Rate base $2.4B (12/31/17 test year); plus $1.0B in cost
recovery riders
WACC (after-tax) 7.73%
Equity ratio 50.90%
Regulatory construct Rate case
Base and certain rider $53M (Oct. 2018); $16M DCRF (Oct. 2020);
rate changes1 $86M for MCPS in GCRR (Jan. 2021); $32M
TCRF (March 2021)2; $7M DCRF (March 2021)2
Riders Fuel, capacity, cost recovery riders (DCRF,
TCRF, and GCRR), rate case expenses, AMI
surcharge, tax reform, among others
1
2
Does not include the Tax Reduction rider
Interim rates as a result of settlements approved by ALJ, PUCT final decision pending
33Entergy Texas
Liberty County Solar
Project overview
Item Details
Docket 51215
MW 100
Location Liberty County, Texas
In-service date Targeted May 2023
Recovery mechanism Anticipate a combination of rate mechanisms, including base rates and fixed fuel factor
Key dates
Date Event
Sept. 2021 Final PUCT decision expected
See Management’s Financial Discussion and Analysis in the most recent Form 10-K and/or any subsequent Form 10-Qs
34Entergy Texas
Storm cost recovery filing
Storm cost determination filing (docket 51997)
• Requested recovery of $266M storm restoration costs plus cost of capital at 7.73% (after-tax)
Storm $M
Hurricane Laura 207
Hurricane Delta 41
Winter Storm Uri (restoration costs only) 5
Balance of Hurricane Harvey 13
Total 266
• Recovery via securitization (proposed legislation would allow for off-balance sheet securitized debt) to be proposed in future
financing order application
Key dates
Date Event
TBD Financing order application (timing will depend on proposed legislation)
9/13/21 PUCT order on storm cost determination (150 day statutory deadline)
TBD PUCT order on financing order case (90 day statutory deadline)
2022 Securitization completed
35System Energy Resources, Inc.
SERI – generation company
Metric Detail
Principal asset An ownership and leasehold interest in
Grand Gulf
Grand Gulf Authorized ROE 10.94%1
Nuclear Station Last calculated rate base $1.6B (3/31/21)
WACC (after-tax) 8.31%
Equity ratio 65%1,2
Regulatory construct Monthly cost of service
Energy and capacity allocation3; %
E-NO
17
E-AR
36
33
E-MS 14
E-LA
1 Ongoing proceeding at FERC challenging SERI’s authorized ROE and equity component (see next slide)
2
3
For SERI ratemaking, the sale leaseback obligation is excluded from the capital structure and instead is treated as an operating lease and recovered as an O&M cost
Percentages under SERI’s UPSA
36System Energy Resources, Inc.
FERC proceedings (1 of 2)
LPSC complaint regarding GGNS sale-leaseback renewal and uncertain tax position (docket EL18-152)
• Complaint alleging (1) SERI double-recovering costs by including both the lease payments and the capital additions in
UPSA billings and (2) SERI incorrectly excluded FIN 48 liabilities associated with uncertain tax position from UPSA
billings
• ALJ initial decision issued 4/6/20
Next step
Date Event
TBD FERC ruling on initial decision
ROE complaints and equity complaint (consolidated dockets EL17-41, EL18-142, EL18-204)
• APSC, MPSC, and LPSC filed ROE complaints at FERC; LPSC also alleged that SERI’s equity component was unjust
and unreasonable (these complaints are now consolidated)
• ALJ initial decision issued 3/24/21; Briefs on Exceptions filed 4/23/21
Next step
Date Event
5/13/21 Briefs opposing exceptions due
TBD FERC ruling on initial decision
See discussion of Rate and Regulatory Matters in the most recent Form 10-K and/or any subsequent Form 10-Qs
37System Energy Resources, Inc.
FERC proceedings (2 of 2)
UPSA formula rate complaint (docket EL20-72)
• In Sept. 2020, the LPSC, APSC, MPSC, and CCNO filed a complaint alleging two categories of UPSA rate issues
(1) violations of the filed rate that require refunds for prior periods, and
(2) elements of the UPSA that the retail regulators contend are unjust and unreasonable that require refunds for the
15-month refund period and changes to the UPSA prospectively
• In Nov. 2020, SERI filed an answer disputing the allegations and requested FERC to dismiss the complaint
Next step
Date Event
TBD FERC Order on the complaint
Prudence complaint (docket EL21-56)
• In March 2021, the LPSC, APSC, and CCNO filed a complaint alleging operational prudence claims, primarily:
(1) based on the plant’s capacity factor and alleged safety performance, SERI imprudently operated Grand Gulf
during the period 2016-2020, and
(2) the performance and/or management of the 2012 extended power uprate of Grand Gulf was imprudent
• In April 2021, SERI filed an answer disputing the allegations and requested FERC to dismiss the complaint
Next step
Date Event
May 2021 Complainant answer to SERI motion to dismiss due
TBD FERC Order on the complaint
See discussion of Rate and Regulatory Matters in the most recent Form 10-K and/or any subsequent Form 10-Qs
38Jurisdictional base rate filing frameworks
E-AR E-LA1 E-MS E-NO E-TX SERI
Latest FRP filed 7/7/20 FRP filed 5/29/20 FRP filed 3/1/21 Rate case filed Rate case filed Monthly cost of
filing date 9/21/18 5/15/18 service2
Next filing FRP: 7/7/21 FRP: 6/30/21 FRP: by 3/1/22 FRP: by 6/30/21 Rate case: Every month
date by June 20223
Rate January September April Nov. 2021 for 35 days after Immediate
effective following filing following filing following filing4 2021 filing, Sept. filing5
date in 2022–2023
Evaluation Forward test Historical test year ended Historical test Historical test 12-month Actual current
period year ended 12/31 plus transmission year ended year ended 12/31 historical test month expense
12/31 and distribution closed to 12/31 plus plus certain year with and prior month-
plant above baseline certain known known and available end balance
through 8/31 of filing year; and measurable measurable updates sheet
in-service rate adjustments changes through changes through
permitted for certain 12/31 of filing 12/31 of filing
generation additions year year
FRP term / Five years Three years No specified Three years n/a Monthly cost of
post FRP (2021–2026 (2021-2023 filing years) termination; (2021–2023 service continues
framework filing years); option to file rate filing years) until terminated
rate case after case as needed by mutual
extension agreement
period
1 Uncontested stipulated settlement for three-year extension of FRP filed in April 2021, pending LPSC approval (expected May 2021)
2 Not required to be filed per FERC order
3 Requirement to file a base case filing every four years, requirement may be extended by PUCT if non-material change in rates would result; base rate case also required
18 months after generation recovery rider becomes effective
4
5
Rate change up to 2% effective April 1, any rate change above 2% would be effective the month following the receipt of an MPSC order
May be suspended for an additional 150 days
39Deferred fuel asset and recovery mechanisms
Net deferred fuel cost
current asset (liability)
OpCo as of 3/31/21 ($M) Recovery
E-AR 3 Energy cost recovery rider re-set annually in April
• Based on prior year energy cost and projected energy sales
• Includes a true-up for over- or under-recovery, including carrying charge, for prior year
E-LA 206 Fuel adjustment clause reset monthly
• Includes a surcharge or credit for deferred fuel expense, and carrying charges, arising
from monthly reconciliation
• Surcharge/credit is calculated based on the over/under balance, and collected or
credited over an annualized period
E-MS 11 Energy adjustment clause reset annually in February
• Rate is re-determined annually and includes a true-up adjustment for over- or under-
recovery
E-NO 7 Fuel adjustment tariff reset monthly
• Rate set to recover targeted fuel and purchased power costs, adjusted by a surcharge
or credit for deferred fuel expense
E-TX (22) Fixed fuel factor revised semi-annually in March and September
• Based on market price of natural gas and fuel mix
• Over/under-recovery tracked and fuel refunds/surcharges issued as necessary
Total 204
40Renewables
Owned / In Owned Est. in
Project MW PPA service1 Project MW / PPA service1
In service Installations in progress
Remmel Hydro (E-AR) ~11 Owned 1925 Various solar projects (E-LA) ~25 PPA 2021
Carpenter Hydro (E-AR) ~62 Owned 1932 St. James Solar (E-NO) 20 PPA 2021
Toledo Bend Hydro (E-LA) ~41 PPA 1968
Iris Solar (E-NO) 50 PPA 2021
Vidalia Hydro (E-LA) ~114 PPA 1990
Agrilectric (bio-mass) (E-LA) ~9 PPA 2013 Sunflower County Solar (E-MS) 100 Owned 2021
Rain CII (waste heat) (E-LA) ~27 PPA 2013 Searcy Solar (E-AR) 100 Owned 2021
Montauk (bio-mass) (E-LA) ~3 PPA 2014 Umbriel Solar (E-TX) 150 PPA 2023
DeSoto Solar (E-MS) 0.5 Owned 2015
Announced / regulatory filings pending
Brookhaven Solar (E-MS) 0.5 Owned 2016
Hinds Solar (E-MS) 0.5 Owned 2016 Walnut Bend Solar (E-AR) 100 Owned 2022
Paterson Solar (E-NO) 1 Owned 2016 Liberty County Solar (E-TX) 100 Owned 2023
Stuttgart Solar (E-AR) 81 PPA 2017
West Memphis Solar (E-AR) 180 Owned 2023
ECO Services (waste heat) (E-LA) 6 PPA 2019
Capital Region Solar (E-LA) 50 PPA 2020 RFPs
New Orleans Residential Rooftop Solar (E-NO) 0.5 Owned 2020 2020 E-LA Solar2 300 TBD 2023
N.O. Commercial Rooftop Solar (E-NO) 5 Owned 2020 2021 E-LA Solar 500 TBD 2024
Chicot Solar (E-AR) 100 PPA 2020
2021 E-TX Solar 200 TBD 2025
New Orleans Solar Station (E-NO) 20 Owned 2020
South Alexander Development – Springfield (E-LA) ~5 PPA 2020 2021 E-AR Solar and Wind 300 TBD 2025
1 Date of COD or entry of contract
2 E-LA has concluded evaluations of the 2020 ELL Solar RFP and three proposals have been placed on the primary selection list and two proposals have been placed on the
secondary selection list; E-LA will provide additional information about the preferred proposals if and after the parties reach a definitive agreement based on the terms of the
proposal
41EWC overview
EWC nuclear plants
Indian Point 11 Indian Point 21 Indian Point 31 Palisades
Planned shut down Shut down Shut down 4/30/21 5/31/22
Net MW n/a n/a 1,041 811
Energy market n/a n/a NYISO MISO
(closest hubs) (Zone G) (Indiana)
Net book value (3/31/21)2 $385M $30M
NDT balance (3/31/21) $631M $760M $970M $545M
ARO liability balance (3/31/21)3 $251M $842M $861M $647M4
EWC non-nuclear plants
ISES 25 Nelson 65 RS Cogen6
COD 1983 1982 2002
Fuel / technology Coal Coal CCGT cogen
Net MW owned 121 60 213
Market MISO MISO MISO
1 Entergy and Holtec filed with the NY PSC an all-party proposed settlement related to Entergy’s sale of Indian Point to Holtec for decommissioning following the permanent shutdown of the
facility. With NYSPSC approval of the proposed settlement, we expect to close the transaction at the end of May 2021.
2 Entergy’s adjusted investment in the companies being sold, with Indian Point as a combined total
3 ARO liability balances are based on estimates and are subject to change
4 Includes $41M for Big Rock Point
5 Entergy plans to retire all coal-fired capacity by the end of 2030
6 In December 2020, Entergy’s wholly-owned subsidiary with a direct interest in RS Cogen, LLC entered into a membership interest purchase agreement with a subsidiary of the other 50%
equity partner to sell its 50% membership interest to the equity partner; the targeted closing date for the transaction is October 2022
42Indian Point and Palisades transactions
Transaction highlights
Item Indian Point Palisades
Structure Equity sale of IPEC owners Equity sale of Palisades owner
Purchaser Nuclear Asset Management Co., LLC Nuclear Asset Management Co., LLC (Holtec
(Holtec International subsidiary) International subsidiary)
Conditions to • Permanent shutdown and reactor defuel • Permanent shutdown and reactor defuel
close include • NRC approval • NRC approval
• NY PSC action on the ownership transfer
• NYS DEC action on the decommissioning plan
NDT • No NDT minimum balance • No NDT minimum balance
• No NDT contribution • $20M contribution at closing
• Limitations on withdrawals • Limitations on withdrawals
• Controls on investment management • Controls on investment management
Status • NRC approval received 11/23/20 • NRC filing submitted 12/23/20
• Joint settlement proposal among ETR, Holtec, NYS • Hearing requests filed by Michigan AG, four
DPS Staff, AG, NYS DEC, and all other parties filed NGOs, and one individual
with NY PSC on 4/14/21
Timeline
Event Indian Point Palisades
NRC filing November 2019 December 2020
PSC filing November 2019 n/a
Targeted close May 2021 By the end of 2022
See Management’s Financial Discussion and Analysis in the most recent Form 10-K and/or any subsequent Form 10-Qs
43EWC nuclear capacity and generation table
EWC nuclear portfolio (based on market prices as of March 31, 2021)1
ROY 21E 22E
Energy
Planned TWh of generation 5.8 2.8
% of planned generation under contract (unit contingent) 98% 99%
Average revenue per MWh on contracted volumes (in $)
56.4 47.1
(expected based on current market prices)
Capacity
Planned net MW in operation (average) 1,158 338
% of capacity sold forward
Bundled capacity and energy contracts 86% 98%
Capacity contracts 13% -
Total 99% 98%
Average revenue under contract (applies to capacity
0.1 -
contracts only) (in $/kW-month)
Total energy and capacity revenues2 (in $)
Expected sold and market total revenue per MWh 55.8 46.8
Sensitivity: -/+ $10 per MWh market price change 55.7-56.0 46.7-47.0
See Appendix F in the earnings news release for definitions
1 Reflects shutdown of IP3 (4/30/21) and Palisades (5/31/22)
2 Excludes non-cash revenue from the amortization of the Palisades below-market PPA, mark-to-market activity, and service revenues 44Estimated EWC adjusted EBITDA
As of 3/31/21
Estimated EWC adjusted EBITDA; $M
21E 22E
Operating revenues, less fuel and fuel-related expenses, and
535 160
purchased power
Other O&M and nuclear refueling outage expense (375) (140)
Severance and retention (40) (15)
Asset impairments (capital, fuel, refuel, DOE proceeds, other) (40) 50
Net gain / (loss) on sale of assets1 (285) 135
Other (95) (25)
Estimated adjusted EBITDA (300) 165
Note: The table above reflects estimates for EWC operations and the costs associated with the
strategic decision to exit the EWC business. Other items may occur during the periods presented, the
impact of which cannot reasonably be estimated at this time.
1 Net gain / (loss) on sale of assets represents current estimates (subject to change). Primary
variables in ultimate gain / (loss) include values of NDTs and asset retirement obligations, financial
results from plant operations, and the level of any unrealized deferred tax balances at closing.
45EWC capital plan
EWC forecast; $M
21E 22E
Capital plan 10 5
Estimated depreciation expense 50 20
46Financial disclosures
47Progress against guidance
Guidance YTD
Driver assumption1 result1 Full-year comments
ETR adjusted EPS 5.80-6.10 1.47
Estimated weather in billed sales Normal 0.12
Weather adj. sales growth ~2.5% (1.6)% • Current full year estimate ~2.2%
• Versus guidance, expect industrial to be lower,
residential higher (net earnings impact negligible)
Retail price updates • E-AR 2021 FRP rate change $40M
Utility other O&M (0.70) (0.14) • Current YoY estimate ~$(0.85)
• Includes adjustments for Arkansas and flex spending
Utility nuclear refueling outage exp. 0.05 0.02
Utility taxes other income taxes (0.15) -
Utility depreciation expense (0.45) (0.14)
Utility net interest expense (0.25) 0.06 • Current YoY estimate ~$(0.20)
P&O (excl. income tax and share effect) / (0.06) 0.03 • Current YoY estimate ~$(0.10), due to improved
other liquidity
Effective income tax rate ~22% 23%
Fully diluted average shares ~204 201
1 All values in $/share except where noted
482021 ETR adjusted earnings sensitivities
Estimated annual
Variable Description of sensitivity EPS impact
Utility
Retail sales growth for 1% change in residential MWh sold +/- 0.09
existing customers 1% change in commercial / governmental MWh sold +/- 0.05
1% change in industrial MWh sold +/- 0.02
Other O&M and nuclear 1% change in expense +/- 0.10
refueling outage exp.
Rate base $100 million change in rate base in rates +/- 0.02
ROE 25 basis point change in allowed ROE +/- 0.19
ETR Adjusted
Interest expense 1% change in interest rate on $1 billion debt +/- 0.04
Pension and OPEB 25 bps change in discount rate +/- 0.06
Effective tax rate 1% change in effective tax rate +/- 0.08
As of February 2021
49Financial summaries
and
Regulation G
reconciliations
50Earnings summary
Table 1: First quarter earnings summary
First Quarter
$ in millions Per share in $
2021 2020 2021 2020
As-reported
Utility 357 320 1.77 1.59
Parent & Other (60) (90) (0.30) (0.45)
EWC 38 (111) 0.19 (0.55)
Consolidated 335 119 1.66 0.59
Less adjustments
Utility - - - -
Parent & Other - - - -
EWC 38 (111) 0.19 (0.55)
Consolidated 38 (111) 0.19 (0.55)
Adjusted (non-GAAP)
Utility 357 320 1.77 1.59
Parent & Other (60) (90) (0.30) (0.45)
EWC - - - -
Consolidated 297 230 1.47 1.14
Calculations may differ due to rounding
201M and 201M diluted average common shares outstanding for 1Q21 and 1Q20, respectively
For additional details, see Appendix A in the earnings news release
51Utility book ROEs
Table 2: Utility book ROE summary
LTM ending March 31, 2021
($ in millions)
E-AR E-LA E-MS E-NO E-TX Utility1
As-reported earnings available to common stock (a) 294 1,060 144 40 231 1,837
Less adjustments:
2014/2015 IRS audit settlement (E-LA Business
Combination) 6 383 4 (1) 2 396
SERI NOPA rate base effect retroactive refund - - - - - (19)
Total adjustments (b) 6 383 4 (1) 2 377
Adjusted earnings available to common stock (non-GAAP) (c) = (a)-(b) 287 677 140 41 229 1,459
Average common equity (d) 3,270 7,104 1,630 559 2,072 15,465
Adjustment for E-LA affiliate preferred (offset at P&O)
Earnings from affiliate preferred (e) 128
Preferred investment (f) 1,391
Equity ratio in last rate proceeding (g) 48.6%
Estimated equity financing for preferred investment (h) = (f) x (g) 676
As-reported ROE (a) / (d) 9.0% 14.9% 8.8% 7.1% 11.1% 11.9%
Adjusted ROE (non-GAAP) (c) / (d) 8.8% 9.5% 8.6% 7.3% 11.0% 9.4%
Adjusted ROE, excluding affiliate preferred (non-GAAP) (c-e) / (d-h) 8.5%
Calculations may differ due to rounding
1 Utility earnings do not equal the sum of the operating companies due primarily to SERI (as-reported and adjusted earnings ~$95M and average common equity ~$905M) and
Entergy Utility Holding Co. 52Regulation G reconciliations
Table 3: ETR adjusted earnings
Reconciliation of GAAP to Non-GAAP measures
1Q21 1Q20
($ in millions, except diluted average common shares outstanding)
Net income (loss) attributable to ETR Corp. 335 119
Less adjustments:
EWC earnings 38 (111)
ETR adjusted earnings (non-GAAP) 297 230
Diluted average common shares outstanding (in millions) 201 201
($ per share)
Net income (loss) attributable to ETR Corp. 1.66 0.59
Less adjustments:
EWC earnings 0.19 (0.55)
ETR adjusted earnings (non-GAAP) 1.47 1.14
Calculations may differ due to rounding
53Regulation G reconciliations
Table 4: Parent debt to total debt, excluding securitization debt
Reconciliation of GAAP to Non-GAAP measures
($ in millions) 1Q21
Entergy Corporation notes:
Due July 2022 650
Due September 2025 800
Due September 2026 750
Due June 2028 650
Due June 2030 600
Due June 2031 650
Due June 2050 600
Total Entergy Corporation notes 4,700
Revolver draw 55
Commercial paper 1,028
Unamortized debt issuance costs and discounts (54)
Total parent debt (a) 5,728
Total debt 25,803
Less securitization debt 147
Total debt, excluding securitization debt (b) 25,656
Parent debt to total debt, excluding securitization debt (non-GAAP) (a) / (b) 22.3%
Calculations may differ due to rounding
54Regulation G reconciliations
Table 5: FFO to debt, excluding securitization debt; FFO to debt, excluding securitization debt, return of unprotected
excess ADIT, and severance and retention payments associated with exit of EWC
Reconciliation of GAAP to Non-GAAP measures
($ in millions) 1Q21
Total debt 25,803
Less securitization debt 147
Total debt, excluding securitization debt (a) 25,656
OCF (LTM) 1,981
AFUDC-borrowed funds (LTM) (43)
Less working capital in OCF (LTM):
Receivables (262)
Fuel inventory 15
Accounts payable 90
Taxes accrued 21
Interest accrued 9
Other working capital accounts (165)
Securitization regulatory charges (LTM) 124
Total (170)
FFO (LTM) (non-GAAP) (b) 2,109
FFO to debt, excluding securitization debt (non-GAAP) (b) / (a) 8.2%
Estimated return of unprotected excess ADIT (LTM) (c) 80
Severance and retention payments assoc. with exit of EWC (LTM pre-tax) (d) 55
FFO to debt, excluding securitization debt, return of unprotected excess ADIT, and (b+c+d) / (a) 8.7%
severance and retention payments assoc. with exit of EWC (non-GAAP)
Calculations may differ due to rounding
55You can also read