Energetics of magnetic transients in a solar active region plage
←
→
Page content transcription
If your browser does not render page correctly, please read the page content below
Astronomy & Astrophysics manuscript no. aa34548-18                                                                                  ©ESO 2019
                                               April 1, 2019

                                                  Energetics of magnetic transients in a solar active region plage
                                                                       L. P. Chitta1 , A. R. C. Sukarmadji2, 1 , L. Rouppe van der Voort3, 4 , and H. Peter1

                                                     1
                                                         Max-Planck-Institut für Sonnensystemforschung, Justus-von-Liebig-Weg 3, 37077 Göttingen, Germany
                                                         e-mail: chitta@mps.mpg.de
                                                     2
                                                         University of St Andrews, St Andrews, Fife KY16 9SS, UK
                                                     3
                                                         Rosseland Centre for Solar Physics, University of Oslo, P.O. Box 1029 Blindern, N-0315 Oslo, Norway
                                                     4
                                                         Institute of Theoretical Astrophysics, University of Oslo, P.O. Box 1029 Blindern, N-0315 Oslo, Norway
                                                    Received 31 October 2018 / Accepted 5 February 2019
arXiv:1902.01650v3 [astro-ph.SR] 29 Mar 2019

                                                                                                                 ABSTRACT

                                                    Context. Densely packed coronal loops are rooted in photospheric plages in the vicinity of active regions on the Sun. The photospheric
                                                    magnetic features underlying these plage areas are patches of mostly unidirectional magnetic field extending several arcsec on the
                                                    solar surface.
                                                    Aims. We aim to explore the transient nature of the magnetic field, its mixed-polarity characteristics, and the associated energetics in
                                                    the active region plage using high spatial resolution observations and numerical simulations.
                                                    Methods. We used photospheric Fe i 6173 Å spectropolarimetric observations of a decaying active region obtained from the Swedish
                                                    1-m Solar Telescope (SST). These data were inverted to retrieve the photospheric magnetic field underlying the plage as identified
                                                    in the extreme-ultraviolet emission maps obtained from the Atmospheric Imaging Assembly (AIA) on board the Solar Dynamics
                                                    Observatory (SDO). To obtain better insight into the evolution of extended unidirectional magnetic field patches on the Sun, we
                                                    performed 3D radiation magnetohydrodynamic simulations of magnetoconvection using the MURaM code.
                                                    Results. The observations show transient magnetic flux emergence and cancellation events within the extended predominantly unipo-
                                                    lar patch on timescales of a few 100 s and on spatial scales comparable to granules. These transient events occur at the footpoints
                                                    of active region plage loops. In one case the coronal response at the footpoints of these loops is clearly associated with the under-
                                                    lying transient. The numerical simulations also reveal similar magnetic flux emergence and cancellation events that extend to even
                                                    smaller spatial and temporal scales. Individual simulated transient events transfer an energy flux in excess of 1 MW m−2 through the
                                                    photosphere.
                                                    Conclusions. We suggest that the magnetic transients could play an important role in the energetics of active region plage. Both in
                                                    observations and simulations, the opposite-polarity magnetic field brought up by transient flux emergence cancels with the surrounding
                                                    plage field. Magnetic reconnection associated with such transient events likely conduits magnetic energy to power the overlying
                                                    chromosphere and coronal loops.
                                                    Key words. Sun: atmosphere — Sun: faculae, plages — Sun: magnetic fields — Sun: photosphere — Sun: corona — magnetohy-
                                                    drodynamics (MHD)

                                               1. Introduction                                                           port energy to the loops in the upper solar atmosphere (Priest
                                                                                                                         et al. 2018; Syntelis et al. 2019).
                                               The energization of the upper atmosphere of cool stars eludes
                                               comprehensive understanding. To differentiate heating mecha-                  More generally, however, at moderate spatial and tempo-
                                               nisms, the observational consequences of the spatial distribution         ral resolution, active regions are apparently covered by ex-
                                               of the energy input play a key role when the Sun is studied. The          tended plage areas composed of moderately inclined unidirec-
                                               concentrated energy input at the apex of coronal loops leads to           tional magnetic field patches (e.g., De Pontieu et al. 2003; An-
                                               a characteristic temperature (and emission structure) that is dif-        tiochos et al. 2003; Brooks et al. 2010; Narayan & Scharmer
                                               ferent from footpoint-concentrated heating (Priest et al. 1998).          2010; Buehler et al. 2015). Some of these unipolar plage areas
                                               Recently, a consensus has been reached that many, maybe most,             are associated with so-called active region moss that is also con-
                                               coronal structures are heated predominantly near their footpoints         sidered to be heated from above. Moss is observed as a low-lying
                                               (Aschwanden et al. 2007), with notable exceptions, for example,           emission in the extreme-ultraviolet (EUV) at the footpoints of
                                               for large flares that are heated from the top through reconnection        hot X-ray solar coronal loops and is structured on spatial scales
                                               (e.g., Masuda et al. 1994). In line with the scenario of footpoint        of a megameter. It exhibits brightness variations on timescales
                                               heating, photospheric observations at the base of some active             on the order of 10 s. Traditionally, this moss emission has been
                                               region coronal loops highlight the presence of mixed-polarity             considered to be caused by heat conduction from the overlying
                                               magnetic field patches that exhibit flux cancellation, a process          hot loops (Berger et al. 1999). Some recent observations suggest
                                               through which energy can be supplied to heat the overlying                that nonthermal particles produced in coronal nanoflares are re-
                                               corona (e.g., Chitta et al. 2017a, 2018). Two-dimensional (2D)            sponsible for the observed high variability in the moss (Testa
                                               and 3D magnetic reconnection models predict that such mag-                et al. 2014). Common to these interpretations is that the energy
                                               netic flux cancellation events at the solar surface, which would          source driving the heating and dynamics of the moss is localized
                                               of course be associated with prior flux emergence, would trans-           in the coronal parts of the hot loops, for instance, as a result of
                                                                                                                                                                    Article number, page 1 of 11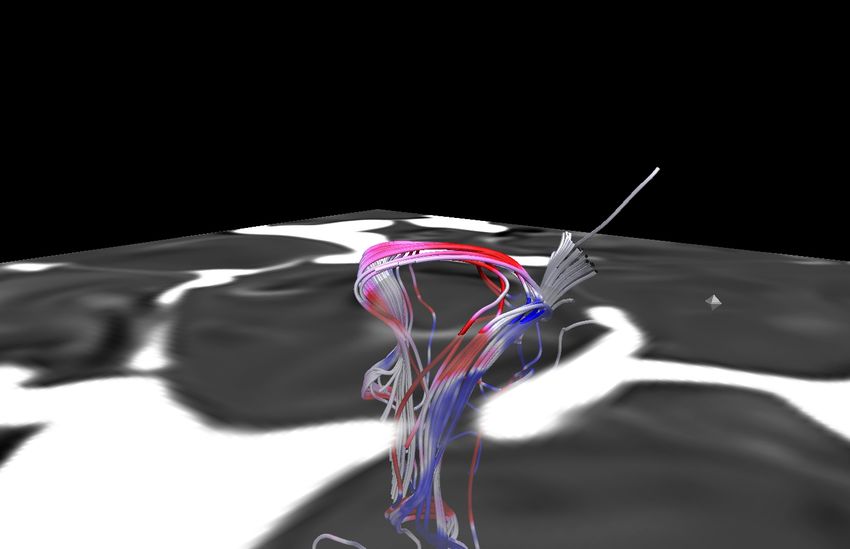
A&A proofs: manuscript no. aa34548-18

Fig. 1. Observations of the magnetic transients in a plage region. Details of the photospheric magnetic field in a decaying active region outlined by
the black box in Fig. A.1(c) are shown. Panel a: Line-of-sight magnetic field map obtained from SST observations on 26 June 2015 07:45 UT. The
three boxes (numbered 1–3; each covering an area of 5.7600 × 5.7600 ) enclose regions exhibiting transient magnetic flux emergence and cancellation
at different instances during the evolution of a predominantly positive-polarity magnetic field patch in that active region (box 3 highlights one such
transient). Panel b: Line-of-sight magnetic field map obtained from the SDO/HMI displayed for comparison. Both maps are saturated at ±100 G.
See Sect. 2 for details.

nanoflares in the upper parts of the loops. Alternatively, it is also       sist over the horizontal extent of the simulation domain. They
possible that the energy transport from highly dynamic footpoint            transfer an energy flux in excess of 1 MW m−2 through the solar
reconnection from flux cancellation events is responsible for the           photosphere. Provided that these simulations are a true represen-
high variability seen in the moss at the footpoints of hot coronal          tation of the real Sun, such an energy flux is in principle suffi-
loops (Chitta et al. 2018). Central to understanding these details          cient to power the emission from the overlying coronal loops.
is the question of energy transport into the corona and the inher-          Our results indicate the important role of magnetic transients in
ent role of magnetic field dynamics in the process. This question           the energetics of extended unipolar active region plage areas.
pertains also to plage areas where high-rising densely packed
EUV loops are rooted (i.e., without hot X-ray loops and without
low-lying moss-like EUV emission).                                          2. Observations of magnetic transients in a plage
    Although plage areas are predominantly unipolar, continued              To examine the evolution of predominantly unidirectional mag-
action of convection persists in these extended unidirectional              netic field patches on the solar photosphere (see the Appendix A
magnetic field regions (Narayan & Scharmer 2010). Occasion-                 for details), we considered observations of the decaying active
ally, emergence of transient horizontal magnetic features driven            region from the Swedish 1-m Solar Telescope (SST; Scharmer
by the upward-convective motions (Isobe et al. 2008) is also ob-            et al. 2003), covering the area marked by the black box in
served in plage areas, which results in a mixed-polarity magnetic           Fig. A.1c. The observational target of SST is a plage region
field (Ishikawa et al. 2008; Ishikawa & Tsuneta 2009). However,             underlying non-moss coronal region. Several faint coronal fan
the widespread role of these magnetic transients in plages and in           loops are observed to be rooted in that plage area (see Fig. A.1d).
the dynamics and energetics of both moss (i.e. with hot loops)              In particular, we used spectropolarimetric observations of the
and non-moss coronal loops is not clear.                                    Fe i 6173 Å line using the CRisp Imaging SpectroPolarimeter
    To discern the properties and energetics of such emerging               (Scharmer et al. 2008) on the SST to determine the magnetic
transient horizontal magnetic features driven by magnetocon-                field properties in that region. These SST/CRISP data were
vection, we compared high-resolution observations of the photo-             recorded on 26 June 2015 between 07:09 UT and 09:40 UT.
spheric magnetic field of a plage area underlying the footpoints            The full Stokes profile of the Fe i line is obtained at eight po-
of densely packed coronal loops in a decaying active region,                sitions between ±135 mÅ centered on 6173 Å, including a far
with realistic 3D radiation magnetohydrodynamic (MHD) simu-                 red-wing position at +350 mÅ. These data were processed fol-
lations representing the loop footpoints. Our observations show             lowing the standard CRISPRED pipeline (de la Cruz Rodríguez
granular-scale transient magnetic flux emergence events at these            et al. 2015), which includes multi-object multi-frame blind de-
loop footpoints. They evolve on timescales of about 5 minutes,              convolution image restoration (van Noort et al. 2005). The re-
which is comparable to the lifetime of granules. The numeri-                stored images have a pixel scale of 0.05700 and a cadence of 16 s.
cal simulations reproduce these emerging features, which per-               The spatial resolution of the SST is five times as high as that
Article number, page 2 of 11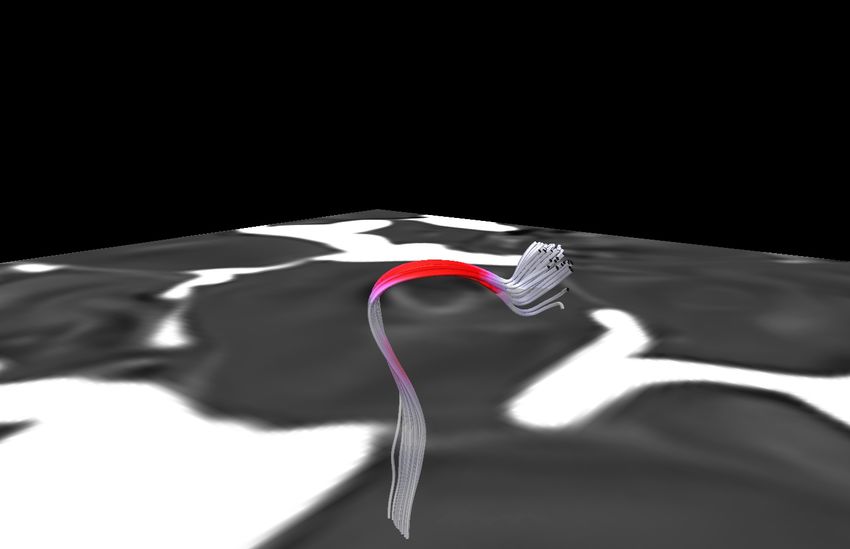
L. P. Chitta et al.: Energetics of magnetic transients in a solar active region plage

Fig. 2. Evolution of the magnetic transients in a plage region. The region covered by the panels in each row shows the SST line-of-sight magnetic
field map (saturated at ±50 G) and is marked with the respective numbered box in Fig. 1a. The rows display sequences of transient flux emergence
and cancellation. The contours are for the horizontal component of the magnetic field (blue: 150 G; red: 300 G; the contours are restricted to a
small rectangular patch that covers the transient). The bottom two rows show region 3 in Fig. 1. The left-most column corresponds to the state
prior to the emergence of transients (except for region 1, where the emergence had already begun at the start of SST observations). The right-most
column shows the state after the cancellation of transient events. See Sect. 2 for details.

of the Helioseismic and Magnetic Imager (HMI) on board the                  SDO/HMI is displayed in Fig. 1(b). Because its spatial resolu-
SDO.                                                                        tion is modest, the SDO/HMI recorded only a coarse large-scale
                                                                            pattern of the dominant positive-polarity magnetic field in this
     These spectropolarimetric observations were inverted using             plage region and does not show any signature of the small-scale
SPINOR (Frutiger et al. 2000) to obtain the magnetic field vec-             minor negative-polarity field.
tor. The average magnetic field strength in this predominantly                   The evolution of two apparent emerging features in region
unipolar region is about 250 G. The line-of-sight component of              3 is shown in the lower two rows of Fig. 2. In the third row,
the derived magnetic field from SST observations that are cospa-            a patch of minor negative-polarity magnetic field appears at
tial with the black box in Fig. A.1c is displayed in the left panel         07:20 UT. Initially, this element is connected to its conjugate
of Fig. 1. When observed at a spatial resolution of about 0.200 ,           positive-polarity magnetic field by a coherent horizontal mag-
the strong magnetic field is structured in intergranular lanes (see         netic field patch (blue contours)1 . As the emergence proceeds,
Rouppe van der Voort et al. 2005, for general properties of such            the negative-polarity element grows in size and recedes from
magnetic features). While these SST observations also show a                its counterpart, at which time the horizontal magnetic field be-
predominantly positive-polarity magnetic field in that region, we
note several instances of mixed-polarity magnetic features that              1
                                                                               The positive-polarity magnetic field patch associated with the tran-
result from flux emergence within the granules. One such case               sient event displayed in the third row emerges into the existing larger
is outlined by region 3. For comparison, the map of the line-of-            feature of the same polarity. For this reason, the horizontal magnetic
sight magnetic field from the same region as observed with the              field contours are open at the intersection of the two features.

                                                                                                                        Article number, page 3 of 11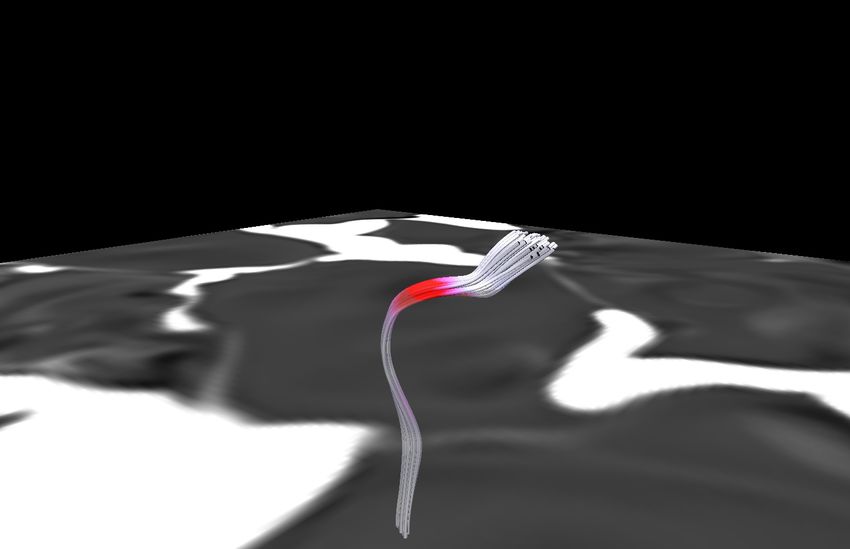
A&A proofs: manuscript no. aa34548-18

Fig. 3. Signatures of a magnetic transient in the photosphere and the
corona. The black curve shows the photospheric magnetic flux inte-
grated over the area that is covered by the minor negative-polarity fea-
tures as a function of time from region 3 in Fig. 1(a) from SST observa-
tions (see also Fig. 2). To avoid noise, only pixels with a magnetic flux
density above 10 G are considered for the integration. The blue curve
shows the coronal EUV emission recorded by the AIA 193 Å channel            Fig. 4. Simulation of a plage region. The map is a 2D snapshot from
from the blue box in Fig. A.1(d) overlying SST region 3. See Sect. 2 for    a 3D magnetoconvection simulation showing the vertical component
details.                                                                    of the magnetic field saturated at ±700 G. This snapshot roughly cor-
                                                                            responds to the average τ500 = 1 surface. Similar to Fig. 1, the three
                                                                            boxes (numbered 1–3) enclose regions exhibiting transient magnetic
                                                                            flux emergence (cf. Fig. 5). Each box covers an area of 2 Mm × 2 Mm in
comes more discrete. Finally, the negative-polarity magnetic el-            the simulation domain. See Sect. 3 for details.
ement cancels with the surrounding opposite polarity field. Af-
ter about 5 minutes, a new transient event with the emergence
of negative-polarity magnetic field is observed in the same re-             in 300 s, which amounts to a flux emergence rate on the or-
gion (fourth row). Unlike the previous case, the two polarities             der of 1015 Mx s−1 . It also exhibits flux cancellation at the same
here do not move farther apart. They instead exhibit a twisting             rate from 07:30 UT to 07:35 UT. During the second phase, the
motion, with an apparent rotation of the negative-polarity fea-             flux emergence rate is slightly lower at 6 × 10¹⁴ Mx s−1 . The
ture with respect to its positive-polarity counterpart. A sample            emission from the coronal loop footpoints overlying these tran-
of other flux emergence and cancellation events from regions 1              sients in region 3 is plotted as a blue curve (cf. the blue box
and 2 is shown in the top two rows in Fig. 2. These flux emer-              in Fig. A.1d for the exact location of the loop footpoints). The
gence events, which bring opposite-polarity magnetic features to            coronal emission closely follows the evolution of the underlying
the photosphere, lasted for about 5 to 10 minutes, which is com-            magnetic transients with an apparent lag of about 5 minutes. A
parable to the lifetime of granules. The overall extended patch             rapid drop in the coronal emission soon after the cancellation of
lasted for several hours. For this reason, we call these emerging           the negative-polarity magnetic field at the end of the first event
and cancelling events magnetic transients. These events are sim-            around 07:35 UT is very clear. This demonstrates the scenario in
ilar to those observed in the quiet-Sun regions (e.g., Martínez             which the small-scale transient events at the photosphere trigger
González & Bellot Rubio 2009).                                              a response in the corona. Flux emergence and cancellation are
     These magnetic transients are observed at the footpoints of            widely associated with magnetic reconnection, which could also
coronal loops (cf. Fig. A.1d). The opposite-polarity magnetic               be the process responsible for the modulation of coronal emis-
field brought up through emergence in plage regions could in-               sion in this case.
teract with the existing overlying field and supply energy to the               However, given the diffused and large-scale structuring
coronal loops. In fact, such embedded small-scale opposite po-              (about 1000 ) of the loop footpoints in the corona, it is difficult to
larity magnetic patches can trigger magnetic reconnection in the            associate every photospheric magnetic transient with a dynamic
lower solar atmosphere (e.g., Chitta et al. 2017b; Smitha et al.            signature in the corona. Furthermore, the energy flux transferred
2018).                                                                      by these events through the solar surface is difficult to estimate
     To illustrate the possible role of magnetic transients in coro-        properly from observations alone. Therefore, numerical experi-
nal dynamics, we considered the example of two such events                  ments are imperative to study the energetics of magnetic tran-
seen in region 3 (cf. Fig. 2). We plot the integrated magnetic              sients discussed here.
flux of the minor negative-polarity magnetic field in that re-                  Although this AR was decaying, granular-scale flux emer-
gion, which displays two distinct phases corresponding to the               gence was still ongoing. This is due to the magnetoconvection
two events (black curve in Fig. 3). During these phases, mag-               that operates on the predominantly positive-polarity field. Thus
netic flux associated with the negative-polarity field increases            even in the almost unipolar magnetized region, convection will
and decreases. In the first of two phases between 07:20 UT and              bring opposite polarities to the surface. We studied this process
07:25 UT, the flux grows from 1 × 10¹⁷ Mx to 4.5 × 10¹⁷ Mx                  through 3D MHD simulations.
Article number, page 4 of 11
L. P. Chitta et al.: Energetics of magnetic transients in a solar active region plage

Fig. 5. Simulated magnetic transients. The left panels show events of transient flux emergence in a plage simulation. Each row (numbered 1–3)
tracks the evolution of flux emergence in granules from the respective areas marked in Fig. 4. The vertical component of the magnetic field is
saturated at ±300 G. The right panels display the spatial association of the photospheric horizontal magnetic field and the vertical component of
the Poynting flux. These snapshots correspond to those displayed in the left panels. Shown in grayscale is the vertical component of the Poynting
flux. The blue and red contours outline regions with a horizontal magnetic strength of 400 G and 600 G, respectively. These snapshots roughly
correspond to the average τ500 = 1 surface. See Sect. 3 for details.

3. Simulations of magnetic transients in a plage                            main was first evolved without a magnetic field until steady-
                                                                            state convection set in. Next, to mimic the SST observations of
We used high-resolution simulations to verify the presence of               loop footpoints that contain an average magnetic field strength of
magnetic transients in regions with a predominantly unidirec-               about 250 G with predominantly unidirectional magnetic field,
tional magnetic field. These simulations will also provide better           we added a uniform magnetic field of 200 G in the vertical direc-
information on photospheric flow and magnetic field properties              tion to the simulation domain. At the top and bottom boundaries,
to estimate the energetics of magnetic transients. To this end,             the magnetic field was set to remain vertical.
we employed 3D radiation MHD simulations using the MURaM
code (Vögler et al. 2005). This code has been extensively used                  The convection advects and concentrates this uniform mag-
to simulate magnetoconvection near the solar surface covering a             netic field in the intergranular lanes. A sample snapshot of this
variety of magnetic field configurations ranging from the quiet             structured magnetic field of positive polarity in the computa-
Sun to pores to sunspots (e.g., Schüssler & Vögler 2006; Vö-                tional domain from a height corresponding roughly to the av-
gler & Schüssler 2007; Cameron et al. 2007; Rempel & Cheung                 erage τ500 = 1 surface is shown in Fig. 4. The snapshot also dis-
2014). Dynamic phenomena such as magnetic flux emergence                    plays patches of weaker magnetic field with a polarity opposite
(e.g., Cheung et al. 2007; Tortosa-Andreu & Moreno-Insertis                 to that of the main polarity. These minor negative-polarity mag-
2009), vortices, shocks, waves (e.g., Moll et al. 2012; Shelyag             netic features arise from small-scale flux emergence events in
et al. 2013), or the generation of MHD Poynting flux (Shelyag               the granules, which is a natural consequence of magnetoconvec-
et al. 2012) have also been widely studied with MURaM.                      tion. Three such events are displayed in the left panels of Fig. 5.
    To simulate the magnetoconvection at the footpoints of a                They are similar to the observed events in that they have a life-
coronal fan loop in a plage region, we focused on a shallow                 time on the order of 100 s and are randomly distributed over the
region near the solar surface that extends to 1.4 Mm in height,             horizontal extent of the domain. Weaker transients with shorter
where the top of the simulation domain reaches 600 km above                 timescales (∼50 s) are also revealed in the simulations, but their
a layer of optical depth at 500 nm of τ500 = 1. This vertical ex-           evolution is more difficult to follow.
tent is sampled by a grid of 128 pixels. The simulation domain
is periodic in both horizontal directions and covers an area of                 It is clear from these images that the flux cancellation follows
12 Mm × 12 Mm, with a mesh size of 512 × 512 pixels. This                   the emergence as the minor opposite-polarity field cancels with
12 Mm × 12 Mm horizontal extent of simulation is equivalent                 the main polarity field. To demonstrate this flux cancellation, we
to the area covered by the black boxes in Fig. A.1 or the field             considered the case of transient from region 1 in the simulations.
of view shown in Fig. 1. The bottom boundary is open for an                 The evolution of the integrated magnetic flux of minor negative
in- and outflow of mass, and the convective flux vanishes at the            polarity from this region is shown in Fig. 6. Similar to the obser-
top boundary. These simulations were run with non-gray radia-               vational case in Fig. 3, the flux emergence and cancellation rates
tive transfer including the effects of partial ionization. The do-          for this simulated transient are on the order of 1015 Mx s−1 .
                                                                                                                        Article number, page 5 of 11
A&A proofs: manuscript no. aa34548-18

Fig. 6. Flux emergence and cancellation in simulations. The emergence         Fig. 7. Statistical association of photospheric horizontal magnetic field
and cancellation of minor negative-polarity magnetic field in a transient     and the vertical component of the Poynting flux. The histogram dis-
event from region 1 in Fig. 4 is plotted as a function of time (cf. the top   played in logarithmic scaling is a joint probability density function
row in the left panel in Fig. 5). See Sect. 3 for details.                    between horizontal magnetic field strength and the vertical compo-
                                                                              nent of the Poynting flux at the photosphere, sampled for a period
                                                                              of 15 minutes. The two quantities roughly correspond to the average
                                                                              τ500 = 1 surface. See Sect. 3 for details.
     The interaction of upward and horizontal surface motions
with the magnetic field generates Poynting flux, which can prop-
agate into the upper atmosphere. The Poynting flux vector due
to surface motions is given by S = 4π  1
                                         B × (u × B), where u is the               The maps of Sz provide a spatial association with the hori-
                                                                              zontal magnetic field. In the case of these transients, however, the
flow field and B is the magnetic field.2 In particular, we are inter-         horizontal magnetic field at the surface decreases while the flux
ested in the vertical component of the Poynting flux, Sz , which is           continues to emerge. Afterward, Sz is generated by the horizon-
injected into the upper atmosphere. The quantity Sz has contribu-             tal surface motions of the pair of footpoints that were previously
tions from both the upward convective motions and the horizon-                connected by the horizontal magnetic field. The general relation
tal surface motions. We find that during the initial phases of the            of Sz with the horizontal magnetic field is of interest because it
flux emergence, upward motions contribute to Sz , and at later                can be used as a diagnostic with observations. In Fig. 7 we plot
phases, when the emerged flux is advected toward intergranu-                  the joint probability density function (PDF) between horizontal
lar lanes, horizontal surface motions dominate the energy flux.               magnetic field strength and Sz . This PDF was obtained from 200
Given the transient nature of the events, both these contributions            simulation snapshots covering 15 minutes of solar evolution to
must be taken into account to compute Sz .                                    capture a variety of emerging events in their early phases3 . For
     We show the association of Poynting flux with the transient              field strengths above 200 G, a broad tail of Sz with values in ex-
emergences in the right panels of Fig. 5. The regions of higher               cess of 5 MW m−2 is observed.
Sz (negative grayscale maps) are related to stronger horizontal                    In active regions, the chromosphere typically requires an en-
magnetic field strengths (blue and red contours). By comparing                ergy budget of 20 kW m−2 , and in the corona, the requirement
them with the events in the left panels of the figure, it is clear            is 10 kW m−2 (Withbroe & Noyes 1977). This means that only a
that this strong horizontal magnetic field is a result of flux emer-          fraction of the energy flux carried by a magnetic transient may be
gence at the surface. This horizontal magnetic field is associated            required to power individual active region loops overlying plage
with the vertical Poynting flux. As the flux emergence proceeds               areas, while most of it is expected to be dissipated deep in the
above the surface, we tracked the transfer of Sz and its evolution            solar atmosphere as a result of the small-scale nature of these
in time (Fig. B.1; see Appendix B for details). These transient               events. The question remains what happens with the energy flux
events inject an energy flux Sz of more than 1 MW m−2 through                 that is made available by transients for the whole plage region.
the solar surface.                                                            Here we provide a preliminary but conservative estimate of the
     The observational case presented in Fig. 3 suggests that de-             average energy flux associated with the magnetic transients in
spite its small-scale nature, the transient event could trigger a             plage regions by considering the event from region 1 as a pro-
coronal response. This requires some process by which the en-                 totype (cf. Figs. 4 and 5). Based on the emergence and cancel-
ergy flux associated with the transient near the photosphere is               lation of the minor opposite-polarity magnetic field, the event
carried upward. To this end, our simulations hint at a rapid re-              lasted for about 100 s (see Fig. 6). During this period, the tran-
configuration of the overlying magnetic field during the tran-                sient event possessed a total energy of E = 3 × 10¹⁹ J. This en-
sient flux emergence and cancellation (Fig. B.2). We speculate                ergy is about two orders of magnitude higher than a typical coro-
that this reconfiguration is facilitated by magnetic reconnection             nal nanoflare, which is estimated to release an energy of 1017 J
above the solar surface, which enables the energy flux to reach               (Parker 1988). In our simulations there is at least one such tran-
the upper atmosphere.
                                                                              3
                                                                                 Magnetoconvection in the photosphere will sufficiently evolve during
2
  This description of Poynting flux ignores the contribution of currents.     the period of 15 minutes, which is long enough compared to the typical
Currents will become important in the corona (Bingert 2009).                  granular timescales of 5–8 minutes.

Article number, page 6 of 11
L. P. Chitta et al.: Energetics of magnetic transients in a solar active region plage
sient event in an area of 2 Mm × 2 Mm over the course of 1 hour Acknowledgements. We thank the anonymous referee for constructive comments
of solar evolution. Thus the total number of events, n, is at least that helped to improve the manuscript. L.P.C. received funding from the Euro-
pean Union’s Horizon 2020 research and innovation program under the Marie
36 during the time period, t = 3600 s, in these simulations that Skłodowska-Curie grant agreement No. 707837. A.R.C.S. acknowledges fund-
cover an area A = 12 Mm × 12 Mm. From these values, we es- ing from the Max Planck Institute for Solar System Research for an internship.
timate a lower limit on the average energy flux associated with L.R.v.d.V. is supported by the Research Council of Norway, project number
simulated magnetic transients, nE/At of 2 kW m−2 . A proper en- 250810, and through its Centres of Excellence scheme, project number 262622.
ergy flux estimate requires a statistics from the evolution of in- The Swedish 1-m Solar Telescope is operated on the island of La Palma by the
Institute for Solar Physics of Stockholm University in the Spanish Observato-
dividual transients, which is a study on its own. Nevertheless, rio del Roque de los Muchachos of the Instituto de Astrofísica de Canarias. The
our conservative lower limit of the average energy flux based on Institute for Solar Physics is supported by a grant for research infrastructures
simulations suggests that the magnetic transients could play an of national importance from the Swedish Research Council (registration num-
important role in the energetics of an active region plage in gen- ber 2017-00625). SDO data are courtesy of NASA/SDO and the AIA and HMI
science teams. The numerical simulations presented in this work have been per-
eral, supporting the conclusions of previous studies by Ishikawa formed on the supercomputers at the GWDG. Fig. B.2 is produced by VAPOR
& Tsuneta (2009) and Isobe et al. (2008). (www.vapor.ucar.edu). This research has made use of NASA’s Astrophysics Data
System.
4. Conclusions
References
We used the SST photospheric observations and MURaM 3D
MHD simulations to study the evolution of the magnetic field Antiochos, S. K., Karpen, J. T., DeLuca, E. E., Golub, L., & Hamilton, P. 2003,
in a plage area at the footpoints of a system of non-moss fan ApJ, 590, 547
Aschwanden, M. J., Winebarger, A., Tsiklauri, D., & Peter, H. 2007, ApJ, 659,
loops that we identified in SDO/AIA images. The small granular- 1673
scale flux emergence and cancellation events found both in the Berger, T. E., De Pontieu, B., Fletcher, L., et al. 1999, Sol. Phys., 190, 409
observations and simulations suggest a very dynamic evolution Bingert, S. 2009, PhD thesis, Albert-Ludwigs-Universität
of mostly unipolar magnetic plages on the Sun at small spatial Brooks, D. H., Warren, H. P., & Winebarger, A. R. 2010, ApJ, 720, 1380
Buehler, D., Lagg, A., Solanki, S. K., & van Noort, M. 2015, A&A, 576, A27
scale. In one case, the emission from the footpoints of coronal Cameron, R., Schüssler, M., Vögler, A., & Zakharov, V. 2007, A&A, 474, 261
loops closely followed the evolution of magnetic elements un- Cheung, M. C. M., Schüssler, M., & Moreno-Insertis, F. 2007, A&A, 467, 703
dergoing emergence and cancellation (cf. Fig. 3). These findings Chitta, L. P., Peter, H., & Solanki, S. K. 2018, A&A, 615, L9
support the observational study of Ishikawa & Tsuneta (2009). Chitta, L. P., Peter, H., Solanki, S. K., et al. 2017a, ApJS, 229, 4
Chitta, L. P., Peter, H., Young, P. R., & Huang, Y.-M. 2017b, A&A, 605, A49
The authors suggested that magnetic transients in plage regions de la Cruz Rodríguez, J., Löfdahl, M. G., Sütterlin, P., Hillberg, T., & Rouppe
could contribute to chromospheric and coronal heating. Simula- van der Voort, L. 2015, A&A, 573, A40
tions show that magnetoconvection works on the (initially) ver- De Pontieu, B., Tarbell, T., & Erdélyi, R. 2003, ApJ, 590, 502
tical magnetic field and brings up small bipoles that appear as Elmore, D. F., Rimmele, T., Casini, R., et al. 2014, in Proc. SPIE, Vol. 9147,
Ground-based and Airborne Instrumentation for Astronomy V, 914707
small patches of opposite magnetic polarity in magnetograms. Frutiger, C., Solanki, S. K., Fligge, M., & Bruls, J. H. M. J. 2000, A&A, 358,
These loop-like emerging events transfer an energy flux in excess 1109
of 1 MW m−2 through the photosphere, part of which may reach Hara, H., Watanabe, T., Harra, L. K., et al. 2008, ApJ, 678, L67
the upper atmosphere through reconnection between the emerg- Ishikawa, R. & Tsuneta, S. 2009, A&A, 495, 607
Ishikawa, R., Tsuneta, S., Ichimoto, K., et al. 2008, A&A, 481, L25
ing and the overlying magnetic field, as concluded by Isobe Isobe, H., Proctor, M. R. E., & Weiss, N. O. 2008, ApJ, 679, L57
et al. (2008). One way to transfer this energy flux is through Lemen, J. R., Title, A. M., Akin, D. J., et al. 2012, Sol. Phys., 275, 17
MHD waves. Numerical models show that reconnection between Martínez González, M. J. & Bellot Rubio, L. R. 2009, ApJ, 700, 1391
the emerging and overlying magnetic field can generate high- Masuda, S., Kosugi, T., Hara, H., Tsuneta, S., & Ogawara, Y. 1994, Nature, 371,
495
frequency Alfvén waves that propagate into the solar corona Moll, R., Cameron, R. H., & Schüssler, M. 2012, A&A, 541, A68
(Isobe et al. 2008). Narayan, G. & Scharmer, G. B. 2010, A&A, 524, A3
Connecting individual flux emergence events to dynamic sig- Parker, E. N. 1988, ApJ, 330, 474
natures in the upper atmosphere, however, remains a major ob- Pesnell, W. D., Thompson, B. J., & Chamberlin, P. C. 2012, Sol. Phys., 275, 3
Priest, E. R., Chitta, L. P., & Syntelis, P. 2018, ApJ, 862, L24
servational challenge. One reason for this is the spatial resolu- Priest, E. R., Foley, C. R., Heyvaerts, J., et al. 1998, Nature, 393, 545
tion disparity between photospheric and coronal observations. Raouafi, N.-E. & Stenborg, G. 2014, ApJ, 787, 118
Nevertheless, coronal observations indicate such a reconnec- Rempel, M. & Cheung, M. C. M. 2014, ApJ, 785, 90
tion process with persistent subsonic upflows and possible unre- Rouppe van der Voort, L. H. M., Hansteen, V. H., Carlsson, M., et al. 2005, A&A,
435, 327
solved high-speed upflows near the footpoints of coronal loops Scharmer, G. B., Bjelksjo, K., Korhonen, T. K., Lindberg, B., & Petterson, B.
(Hara et al. 2008). Our results are also relevant for the studies 2003, in Proc. SPIE, Vol. 4853, Innovative Telescopes and Instrumentation
of coronal-hole plumes. It has been suggested that these struc- for Solar Astrophysics, ed. S. L. Keil & S. V. Avakyan, 341–350
tures are formed through the cancellation of the minor opposite- Scharmer, G. B., Narayan, G., Hillberg, T., et al. 2008, ApJ, 689, L69
Scherrer, P. H., Schou, J., Bush, R. I., et al. 2012, Sol. Phys., 275, 207
polarity magnetic field with the surrounding unipolar magnetic Schüssler, M. & Vögler, A. 2006, ApJ, 641, L73
patches (e.g., Raouafi & Stenborg 2014). Overall, the magnetic Shelyag, S., Cally, P. S., Reid, A., & Mathioudakis, M. 2013, ApJ, 776, L4
transients in our simulation provide an additional basis to recent Shelyag, S., Mathioudakis, M., & Keenan, F. P. 2012, ApJ, 753, L22
observational studies that found flux cancellation at the foot- Smitha, H. N., Chitta, L. P., Wiegelmann, T., & Solanki, S. K. 2018, A&A, 617,
A128
points of different coronal loop systems (Chitta et al. 2017a, Syntelis, P., Priest, E. R., & Chitta, L. P. 2019, ApJ, 872, 32
2018). The upcoming 4-m Daniel K. Inouye Solar Telescope (El- Testa, P., De Pontieu, B., Allred, J., et al. 2014, Science, 346, 1255724
more et al. 2014) will be able to resolve the photosphere down to Tortosa-Andreu, A. & Moreno-Insertis, F. 2009, A&A, 507, 949
about 30 km, which might reveal the persistent flux emergence van Noort, M., Rouppe van der Voort, L., & Löfdahl, M. G. 2005, Sol. Phys.,
228, 191
that has been predicted by simulations. Such observations will Vögler, A. & Schüssler, M. 2007, A&A, 465, L43
provide better constraints on the role of small-scale flux emer- Vögler, A., Shelyag, S., Schüssler, M., et al. 2005, A&A, 429, 335
gence and cancellation transients in the heating of active region Withbroe, G. L. & Noyes, R. W. 1977, ARA&A, 15, 363
moss, and the corona in general.
Article number, page 7 of 11A&A proofs: manuscript no. aa34548-18
Appendix A: Active region plages on the Sun period. Overall, there is a net flux of magnetic energy that will
be transported upward into the solar atmosphere.
To lay out the context for the magnetic plages, we display The magnetic flux that emerged above the surface could in-
snapshots of two active regions with a photospheric line-of- teract with the overlying field through reconnection. This pro-
sight magnetic field (left panels) and the coronal emission near cess will enable the transfer of energy flux from the emerging
1.5 MK (right panels) in Fig. A.1. The magnetic field maps are events to the solar atmosphere, which could then energize the
obtained from the Helioseismic and Magnetic Imager (HMI; coronal loops that are rooted in plage regions (cf. Fig. 3). Qual-
Scherrer et al. 2012) on board the Solar Dynamics Observatory itative signatures of such reconnection are indeed seen in our
(SDO; Pesnell et al. 2012). The coronal emission is recorded simulation. In Fig. B.2 we show a 110 s phase of a small-scale
with the 193 Å filter on the Atmospheric Imaging Assembly flux emergence and the subsequent evolution of field lines dur-
(AIA; Lemen et al. 2012) on board the SDO. ing the event within a granule4 . In the early phases of emergence,
The two active regions are at different stages of their evo- the field lines are more organized and show a tendency of loop-
lution. These examples are selected to show the general char- ing back to the surface. The flux emergence becomes clear at
acteristics of plages and the associated coronal emission (from later times with a small loop system. With the event progressing,
the low-lying moss emission and the longer loops). The exam- the initially organized field lines become highly disorganized.
ple in the top panels is an evolved region with a clear bipolar This eruption-like behavior indicates a rapid reconfiguration of
magnetic structure (left panel). The low-lying moss emission is the magnetic field through reconnection, which could transfer
evident from the AIA 193 Å snapshot (right panel). One such energy flux to the upper atmosphere. Future observations are re-
moss region is highlighted with a black box. The photospheric quired to study the observational manifestation of these recon-
counterpart of this coronal moss is a densely structured plage of nection events and their impact on the energetics of the chromo-
negative-polarity magnetic field, with an average magnetic flux sphere and corona.
density of about 300 G. The smaller gray patches between the
magnetic structures (in the boxed region) indicate photospheric
granulation. Thus the region would represent an extended patch
of unidirectional magnetic field that forms the footpoint of the
coronal moss. Similar features are found in the whole active re-
gion in both magnetic polarities. In the bottom panels, part of a
decaying active region is displayed, where the positive polarity
field is readily visible in the photosphere (bottom left panel). The
associated trailing negative-polarity magnetic field in this active
region is outside the displayed field of view. Unlike the low-lying
moss features in Fig. A.1b, the coronal emission in the decay-
ing active region is structured as a longer fan-like loop system
(black box in Fig. A.1d). Again, the footpoints of these fan loops
constitute an extended patch of unipolar magnetic field (positive
polarity in this case) that is structured by granulation, with an
average magnetic flux density of about 130 G. At least when ob-
served at a spatial resolution of about 100 with HMI, the footpoint
patches in both active regions are predominantly unidirectional,
without clear signs of a mixed-polarity magnetic field.
Appendix B: Transfer of Poynting flux through the
solar photosphere
Magnetic flux emergence in our simulation transfers Poynting
flux through the solar surface, which is sufficient to heat coro-
nal fan loops in active region plage areas (cf. Sect. 3). These
emerging events are transient in nature and generally carry an en-
ergy flux in excess of 1 MW m−2 . The complete information on
photospheric flows and magnetic field in 3D allows us to track
the transfer of energy flux with height and time. This spatio-
temporal profile of the Poynting flux, S, for one such event is dis-
played in Fig. B.1. Here we trace a flux emergence event along
a single vertical column in the 3D domain and plot the verti-
cal component of the Poynting flux, Sz , as a function of time.
Shown here is only a phase of about 90 s of the emergence event
that lasted over 200 s, which is comparable to the granular life-
time. In the initial phases of emergence (purple curves), the Sz
that is generated below the surface increases in magnitude and at
the same time is transferred across the surface. The extent of flux
emergence increases in height with time, which is seen as broad-
ening of the Sz profiles. This means that once the emergence
process is triggered, the upward convective motions continually 4
The event described in Fig. B.2 is different from the one discussed in
pushes more magnetic flux in the same region over an extended Fig. B.1
Article number, page 8 of 11L. P. Chitta et al.: Energetics of magnetic transients in a solar active region plage
Fig. A.1. Context maps showing the photospheric and coronal diagnostics of plage areas in active regions. (a) The photospheric line-of-sight
magnetic field map of an evolved active region obtained from SDO/HMI. The white and black shaded areas are the positive- and negative-polarity
magnetic field regions, saturated at ±300 G. The white box covers a patch of the active region with a predominantly negative-polarity magnetic
field in an area of 16.500 × 16.500 . (b) The map of coronal emission of the active region recorded by the SDO/AIA 193 Å filter. The black box, which
is cospatial with the white box in panel (a), identifies a coronal low-lying moss emission in this active region. Panels (c) and (d) are the same as
panels (a) and (b), but plotted for a decaying active region (weaker than the above). The black boxes have the same size as in the top panels and
cover a predominantly positive-polarity magnetic field patch in this active region. In the bottom panels the black box is the target region of the
SST co-observations. The smaller blue box corresponds to region 3 in Fig. 1. See Sect. 2 for details.
Article number, page 9 of 11A&A proofs: manuscript no. aa34548-18 Fig. B.1. Transfer of Poynting flux through the solar photosphere. Each curve represent the vertical component of the Poynting flux at a given location in a simulated flux emergence event, with in a height range of ±0.2 Mm near the solar surface. The colors denote the temporal evolu- tion of the event. See Sect. 3 for details. Article number, page 10 of 11
L. P. Chitta et al.: Energetics of magnetic transients in a solar active region plage
t=0s t = 36.7 s
0.5 1
t = 73.4 s 0.25 0.5
t = 110.5 s
0 0
-0.25 -0.5
-0.5 -1
Bz (kG) Sz (MW m-2)
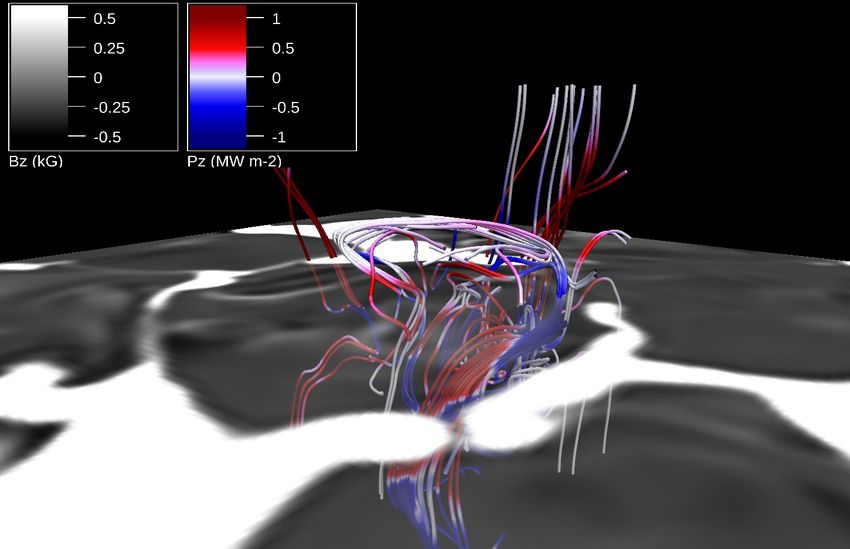
Fig. B.2. Visualisation of a simulated magnetic flux transient. Displayed here are four instances of a small flux emergence event within a granule.
The surface covers an area of 3 Mm × 3 Mm. Each snapshot is about 37 s apart. The grayscale image shows the vertical component of the magnetic
field near the photosphere. The solid curves trace the magnetic field in the 3D domain. Each field line is color coded with the vertical component
of the Poynting flux. See Sect. 3 for details.
Article number, page 11 of 11You can also read