The benefits of local IT procurement - A report prepared for Catalyst IT Ltd by Economics New Zealand Ltd - Catalyst EU
←
→
Page content transcription
If your browser does not render page correctly, please read the page content below
The benefits of local IT procurement

A report prepared for Catalyst IT Ltd by
Economics New Zealand Ltd

June 2020
Key points
      •      The local ICT sector has been making good progress but could perform better again if helped to
             achieve greater scale and sector synergies
      •      Government procurement, with a $3 billion annual spend, can play a key role in the industry’s
             further development
      •      Local procurement would benefit from the cost effectiveness of local IT companies, which have a
             staff cost advantage over Australian companies of some 25% and a larger cost advantage again
             compared to the US
      •      The domestic multiplier and tax revenue effects of local procurement substantially reduce the net
             cost to the government of local contracts. As an example, the net cost of a $1,150,000 contract
             (a million dollars plus GST) reduces by some 30% after the secondary tax revenue effects of the
             local employment and spending it induces
      •      Supporting local suppliers could also have balance of payments benefits as local suppliers
             become better able to displace previous imports of IT services and licence fees
      •      Local procurement could also even up the state of competition in IT markets, where entrenched
             competitors are otherwise difficult to challenge

Background

Catalyst commissioned this report to identify the arguments for local procurement of IT services from New
Zealand companies. It follows an earlier report on similar lines commissioned in 2011 1.

Development of the IT sector

The quality of information on the progress of the New Zealand ICT sector has been improving significantly. In
particular the Ministry of Business, Investment and Employment (MBIE) has produced a series of reports on
the sector, and Statistics New Zealand (‘Stats’) also now runs a regular information and communication
technology (ICT) supply survey every 2 – 3 years (the latest is for the 2019 financial year, and the next is due
in 2021). The industry itself, as represented by NZTech, has also compiled useful data 2.

The latest MBIE report, the Information and Communication Technology Report 20173, shows that in many
respects the sector has been making progress and realising its upside potential. The MBIE report is focused in
particular on Computer Design Services, defined as “firms engaged in providing expertise in the field of
information technology. It includes consulting services around computer hardware programming and software,
internet and web design. It also includes customised software development (except software publishing),
software installation services and systems analysis services ... this classification captures by far the majority of
New Zealand’s internationally focused IT firms”. Highlights would include:

1   A link to the earlier report can be found at https://www.catalyst.net.nz/blog/it-pays-stay-local-open-procurement
2   See for example ‘The New Zealand Tech Sector Key Metrics’, available at https://nztech.org.nz/wp-
    content/uploads/sites/8/2019/11/Tech-Sector-Key-Metrics-2018-Update.pdf
3   MBIE’s various sectoral reports are available at https://www.mbie.govt.nz/business-and-employment/economic-
    development/sector-reports-series/ and the ICT report for 2017 can be downloaded at
    https://www.mbie.govt.nz/assets/7204317066/2017-ict-report.pdf

                                                                                                        0 // 0 // June 2020
                                                                   Commercial in Confidence // www.catalyst.net.nz // Page 2
•      These IT firms have been growing reasonably rapidly. Total revenues have risen from some $5
              billion in 2009 to just shy of $7 billion in 2015, an average annual rate of growth of 5.5%. More
              recent data in Statistics New Zealand’s Information and communication technology supply survey:
              20194 show that total sales of good and services had risen further to $9,849 million in the 2019
              financial year ($6,750 million of IT services and $3,099 million of sales of published software)
       •      Jobs in the sector pay very well by New Zealand standards. In 2015 the average salary in these IT
              firms was just shy of $100K ($99,744) compared to the average national salary of just under
              $53K ($52,950). These IT firms provide significantly more managerial and professional jobs than
              the average New Zealand firm
       •      The IT firms themselves are doing well. They are high productivity firms, with markedly more
              sales revenue per employee than the national average. They are relatively high spenders on
              investment in expansion, and markedly more keen on R&D spending than the national average,
              but at the same time they are also less indebted and make a healthy return on equity: they
              earned a 33% return on equity in 2015 compared with a national average of 11%. More recent
              data in the latest Annual Enterprise Survey 5 run by Stats shows that this high rate of profitability
              has been maintained, with firms earning 31% in 2018 compared to the nationwide average of
              14%
       •      The IT firms have been doing well internationally, with strong growth in exports (covered in more
              detail later). The main export markets are the US (some 35% of the total), Australia (27%), and
              non-UK Europe (18%)

All of this represents solid progress on several dimensions. If there is one area which is more debatable, it is
scale, and the issue of whether the synergy benefits of clustering have been realised.

To be fair, it is something of a glass half full / glass half empty debate. On the glass full side, the latest MBIE
report shows that there were 54 firms with 100+ employees in 2016, when there had been only 21 ten years
earlier, and there were 48 with 50-99 employees, up from 30. The biggest (100+) firms were also responsible
for over half of the sector's new jobs over the decade (7,000 extra jobs out of a total increase of 13,100).
There is also a solid level of regional concentration: MBIE found that 16,100 of the total sectoral 30,875
employment were in Auckland and another 8,500 were in Wellington. These two regions, accounting for very
nearly 80% of the sector, also accounted for 86% of new IT jobs in the five years to 2016. There is clearly a
base platform for the productivity-enhancing agglomeration benefits that come from firms in close proximity
being able to feed off each other’s ideas.

But on the glass half empty view, of the 11,067 firms in the sector, over three-quarters (8,499, or 77%) have
no employees at all, and are effectively one-man bands 6. The IT sector is even more fragmented than
businesses in the economy as a whole, where 71% have no employees 7. At the larger end, IT companies with
10 or more employees make up 4.8% of the industry: nationally, the proportion is 6.4%. Despite the progress

4   https://www.stats.govt.nz/information-releases/information-and-communication-technology-supply-
    survey-2019
5   The latest survey for the 2018 financial year can be found at https://www.stats.govt.nz/information-releases/annual-
    enterprise-survey-2018-financial-year-provisional. The data are for the Computer System Design and Related Services
    sector, ANZSIC group M700
6   They have of course their place in the scheme of things. But one-manbands are not likely to be the basis of a
    transformational shift in national productivity and export performance.
7   The national business demographics numbers come from Stats’ https://www.stats.govt.nz/information-releases/new-
    zealand-business-demography-statistics-at-february-2019

                                                                                                                0 // 0 // June 2020
                                                                           Commercial in Confidence // www.catalyst.net.nz // Page 3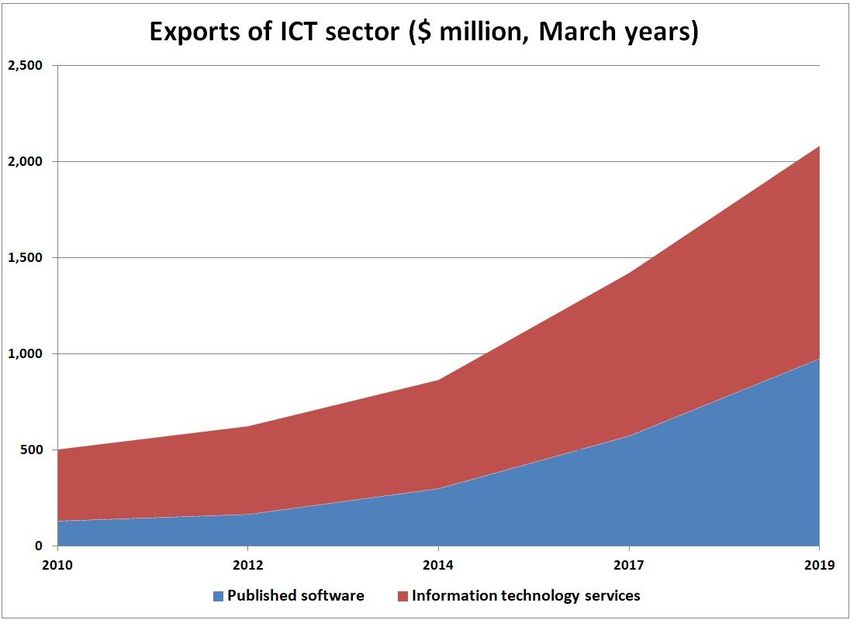
of the sector, one is left wondering whether enough companies have reached ‘take off’ scale where they are in
the running to become significant international players, and whether local IT procurement would be helpful to
enable them to bulk up to more viable international scale, including competing against international players in
our domestic market.
The case for local procurement
This report documents four reasons why increased local procurement of IT services could be in the national
interest.
One, there are efficiency benefits based on the cost advantage of New Zealand compared to Australia and the
US.
Two, there are fiscal and employment benefits from choosing New Zealand suppliers, due to the multiplier
effect of local suppliers’ higher incomes directly and indirectly spreading around the economy, and the size of
the effects is illustrated with current parameters.
Three, there are potential balance of payments benefits as local companies become better able to build on
already significant export growth, and potentially replace IT services that are currently imported.
And finally there are reasons to improve the scope for competition in IT markets.
Efficiency – more ‘bang per buck’
A procurement contract given to a New Zealand IT firm is likely to buy considerably more in way of
programming or other resource hours, as industry incomes are substantially lower than overseas whereas
industry skills are on a par with those overseas. The skills point is particularly relevant in the open source
software space, as by definition there is ‘level playing field’ access to it and users anywhere can capitalise on
the leading edge innovations of others.
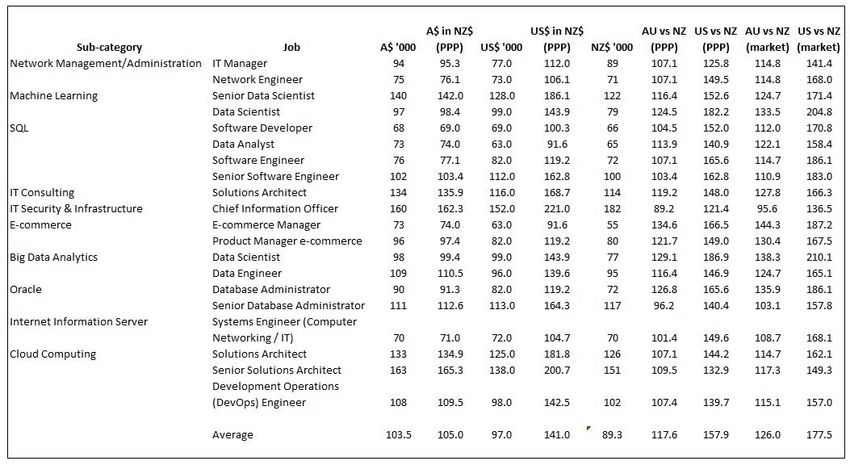
Using the latest information8 from PayScale Inc, a US company that provides detailed global compensation
data across a wide variety of countries and sectors, it is possible to estimate the cost advantage of local IT
companies compared with their Australian and US counterparts. The PayScale information is very detailed –
the New Zealand data for example covers 100 sub-categories within the IT industry alone, with a variety of job
descriptions within each sub-category – but the jobs listed in any sub-category in one country are not
necessarily available for other countries. The table below shows a selection of roles across a variety of IT
categories where comparable roles were available for New Zealand, Australia and the US.
Salary levels in Australia and the US were converted into New Zealand dollars at the ‘purchasing power parity’
(PPP) rates calculated by the OECD9. This has the advantage of using a relatively stable rate that reflects local
prices in each country and avoids the volatility of using market exchange rates. On the other hand employers
pay people at market exchange rates, so comparing prices at market rates can make sense, too. At the moment
the market rates are not enormously far from the PPP rates: the PPP exchange rate for the kiwi against the
Aussie is 98.6 Aussie cents, and the market rate is 93.3 cents. Using the PPP rate makes New Zealand look 5-
6% more expensive than using market rates. For the US dollar, the PPP rate is 68.8 US cents and the market
8 The New Zealand data are at https://www.payscale.com/research/NZ/Country=New_Zealand/Salary
9 Available at https://stats.oecd.org/ under the ‘Prices and Purchasing Parities’ tab
0 // 0 // June 2020
Commercial in Confidence // www.catalyst.net.nz // Page 4rate is 61.2 cents: again, using PPP makes New Zealand look more expensive (by some 12-13%). To keep the
table manageable, only PPP versions of NZ staff costs are shown but cost comparisons are shown on both PPP
and market bases.
The table below shows that on average Australian IT personnel costs are 17.6% above ours, and US personnel
costs are 57.9% above ours, when calculated at PPP. When calculated at market rates, the Australian costs are
26% higher, and the American costs are 77.5% higher.
Ideally New Zealand companies would compete as much on quality, responsiveness and other non-price
elements as on lower salary levels, and incomes would progressively rise to overseas levels, but while the cost
advantage is there it points to the sector being able to make further progress against overseas competition on
both cost and non-price factors.
The total annual government spend on ICT has been rather difficult to pin down precisely, although one media
report10 in 2018 said it was then in the region of $3 billion dollars. Efficient stewardship of a $3 billion spend
would be important anytime, but is even more so in an environment of likely fiscal austerity: beyond the
immediate covid fiscal stimulus, there is likely to be an extended period of careful fiscal reconsolidation. The
government could help itself, and the industry, by prioritising cost efficiency in its IT procurement criteria.
10 https://www.stuff.co.nz/business/industries/106133903/bigger-slice-of-3b-government-ict-spend-could-
go-to-small-young-firms. It was referring to a ministerial press release https://www.beehive.govt.nz/release/start-
new-era-digital-government-procurement-processes which had said ““The government spends around $3 billion a year
on ICT, including capital and operating expenditure”.
0 // 0 // June 2020
Commercial in Confidence // www.catalyst.net.nz // Page 5Domestic fiscal and multiplier effects
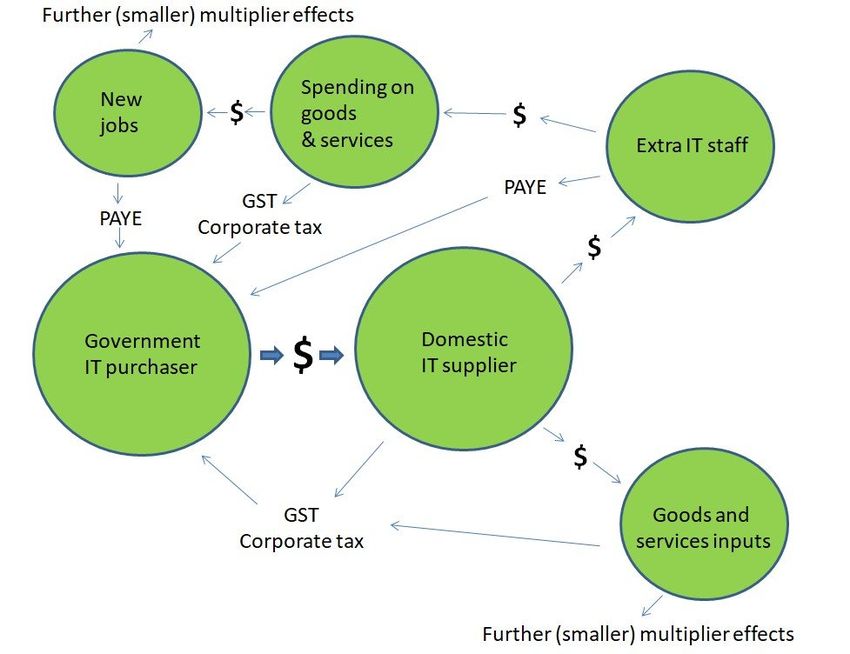
Awarding an IT contract to a domestic supplier sets in train a chain of positive fiscal and multiplier effects
which do not occur (or only on a much lower scale) when the contract is awarded to an overseas supplier.
These effects are shown in the graph below.
To put some illustrative numbers on the picture, a notional example illustrates the chain of events, using a
contract worth $1,000,000 pre-GST or $1,115,000 inclusive of GST. Of the $1,000,000 ex-GST cost of the
contract, roughly $842,500 will be spent on domestic wages, salaries, and shareholder distribution, and
$157,500 will be spent on purchase of goods and services. The split of the ex-GST cost is based on the
structure of operational expenditure in Catalyst’s 2020 accounts, but the exact split does not matter hugely:
the exercise can easily be reworked using (say) the data on IT firms in Stats’ Annual Enterprise Survey. For
those firms salary costs were 46% of total expenditure and purchases of goods and services were 50% of total
expenditure.
The first impact is a net payment of GST to the government of $114,750, being the GST due from the
domestic supplier ($150,000) less the GST already paid by the domestic supplier ($23,625 assumed in this
example, being 15% on purchases of goods and services of $157,500).
0 // 0 // June 2020
Commercial in Confidence // www.catalyst.net.nz // Page 6Looking first at the impact of domestic wages and salaries, the $842,500 in local wages generates $200,515 in
PAYE tax. This is based on an average annual income in the sector of $99,744, taken from MBIE’s latest report
(and also close to the current average across Catalyst’s business arms), which pays an average 23.8% tax rate11.
This leaves each employee with $76,005 in disposable after-tax employee income. Not all of this will be spent
domestically. It is assumed, conservatively, that 5% of this is saved (a conservative estimate as the national
household savings rate is arguably negative), that 25% is used for debt-servicing (again, conservatively
assuming that everyone has a mortgage, that mortgage payments are substantial but within a bank’s normal
lending limits, and that mortgage payments have no multiplier effects), and that 28% is spent on imports (the
share of imports of goods and services in the overall economy in the year to March 2019). These channels eat
up $44,083 of disposable income. The remainder, $31,992 per employee, will be on-spent in the domestic
economy, generating further domestic income, employment, and tax revenue. This is the well-known
‘multiplier’ effect of an increase in government spending12.
The IT company will have taken on 8.4 employees to fulfil this contract (based on a salary bill of $842,500, at
an average salary of $99,744)13. They now go out and spend their combined new disposable income of
$268,733. The government will pick up GST on this spending, let us say at 7.5% of the amount (15%, less the
GST the shops will already have paid which is assumed to halve the GST bill), which means GST of $20,155.
The businesses they spend their new income in will receive $248,578. Economy-wide14, we can expect some
18% of this to be paid as wages and salaries of $44,744. This income will result in income tax of $6,850.
There are further, smaller rounds of induced spending and tax that are not pursued further, nor,
conservatively, are payments of other items of tax included (notably corporate income tax). Let’s stop there
and see what the cumulative effects have been from the government’s perspective.
It issued an IT contract worth $1.15 million (GST inclusive). It got back PAYE of $200,515 from the salaries of
the IT company’s new hires, and another $6,850 from PAYE on increased employment resulting from the new
hires’ spending in the shops. It got GST of $114,750 from the IT company and $20,155 from the IT company
staff’s spending. In total it has got back $342,270 as its tax revenues on the increased production and
spending the contract induced, effectively reducing the cost of the contract to just over $800,000.
There are several conclusions which follow from this analysis. A key one is that the net cost to the public
sector of any project awarded to a domestic supplier, with domestic employees and high levels of domestic
purchases of goods and services, is much reduced by the tax inflows from the domestic income and spending
generated. On these illustrative estimates, the gross cost of a $1,150,000 project is reduced by just shy of
30%. The exact size of the net cost will vary from contract to contract, and different assumptions could be
made about tax rates, companies’ expense structures, or consumer behaviour, but they would not change the
overall thrust of the conclusion, which is that awarding government procurement contracts domestically sets
11 Based on the tax calculator available on the IRD website,
https://www.classic.ird.govt.nz/calculators/keyword/incometax/calculator-tax-rate.html . The calculation is for
basic statutory income tax and does not include tax credits or ACC earners’ levies.
12 The multiplier calculations assume that the economy is not already at full employment, and that increased spending can in fact draw
available underemployed resources into increased production, rather than just shifting around existing production. In current
circumstances this is a reasonable assumption. In the Reserve Bank’s latest (May) Monetary Policy Statement
https://www.rbnz.govt.nz/news/2020/05/large-scale-asset-purchases-expanded for example the Bank expects
the unemployment rate to be above its estimate of full employment until at least early 2023. Other forecasters including Treasury in
Budget 2020 have similar projections.
13 This is where the assumption of new staff being available to hire is important.
14 This is based on the economy-wide data from the Annual Enterprise Survey, where in 2018 employee costs were 18.1% of total
business expenditure.
0 // 0 // June 2020
Commercial in Confidence // www.catalyst.net.nz // Page 7in train further rounds of spending that boost local incomes, generate further tax flows, and return revenues
to the government that offset the initial cost.
Another conclusion is that this wider benefit to the fiscal accounts is invisible from the perspective of any
single agency awarding a contract. An agency commissioning an individual piece of project work will, naturally
and correctly, be concerned about value for money from spending its own budget, but it does not observe, nor
directly benefit from, the revenues its domestic procurement is generating for the government as a whole.
“Whole of government” ICT purchasing initiatives have the potential, in theory, to look at the bigger picture,
though again they tend to be more about the efficiencies to be gained from a single project purchase (on
behalf of multiple users) than about the net cost of a domestic procurement once consequent income and tax
flows are allowed for. Somewhere in the policy machinery there should be allowance made for the wider
national interest in stimulating these multiplier effects. They are particularly important in current post-covid
economic conditions, where despite already extensive fiscal stimulus, unemployment is likely to be
considerably above desirable levels for an extended period of time.
Another point is that this reduction in costs only applies to the extent that a domestic contractor is expanding
the domestic tax base by hiring people locally and by purchasing local goods and services. The tax situation of
overseas firms doing business in New Zealand can be complex, but they will almost certainly not generate
similar levels of tax to effectively offset the cost of the contract to a public sector buyer. Their workforce will
largely be overseas (outside New Zealand’s income tax regime), their purchasing will largely be overseas
(outside New Zealand GST regime), their corporate profits may not easily be subject to New Zealand company
tax, and the bulk of any ‘multiplier’ effects on incomes will also take place overseas in their own economies.
Finally, these domestic multiplier effects would be particularly valuable in present covid-affected
circumstances. The 2020 Budget recognised that a very large amount of fiscal stimulus would be needed to
offset the covid impact, and introduced a $50 billion Covid-19 Response and Recovery Fund15, which at the
time of the Budget announcement still had just over $20 billion of unallocated spending capacity. Some use of
these funds for domestic IT procurement and its multiplier effects would assist the economic recovery. It may
also be a faster way to provide fiscal support: while well-designed IT procurement cannot be implemented at
the drop of a hat, it may well compare favourably with less ‘shovel ready’ alternatives such as extensive civil
works infrastructure.
Balance of payments benefits
One very promising development is the strong growth in IT exports. Looking at what Stats calls ‘Information
technology services’ (IT technical support services; IT design, consulting and development services; Hosting
and IT infrastructure provisioning services) the $337 million of 2010 has turned into $1.108 billion as of
March ‘19, a compound growth rate of 12.9% a year, or roughly twice as fast as its previous long term
performance. Stats also counts the value of exports of published software, which have similarly grown very
strongly, from $131 million in 2010 to $976 million in 2019, a compound growth rate of 25.0% a year. Overall,
taking software and IT services together, total IT exports have topped $2 billion for the first time, as shown in
the graph below.
15 See https://treasury.govt.nz/system/files/2020-05/b20-sum-initiatives-crrf.pdf
0 // 0 // June 2020
Commercial in Confidence // www.catalyst.net.nz // Page 8Stats made an interesting comparison with our traditional agricultural exports. While IT exports in 2010 were
down there with carrots and onions, they are now in rather more refined company, or as an analyst at Stats
put it16 when the numbers were published, “Despite flying under the radar, ICT services exports are now larger
than the more celebrated Kiwi exports such as wine, which is one of our top 10 goods sold overseas”.
It is now evident that New Zealand IT companies are in a stronger place to compete not only in overseas
markets, but also for the business overseas companies have been winning in New Zealand. To the extent that
they can now substitute for overseas suppliers, there is a benefit from the point of view of the national
balance of payments.
Contracts awarded to overseas suppliers show up in the balance of payments as a debit item, ‘imports of
services’. In the latest balance of payments statistics (for calendar year 2019) 17 imports of telecommunications,
computer and information services cost $1,480 million, a figure which is rising rapidly in recent years (by
12.5% a year over the past five years). By far the largest proportion is $1,243 million of computer services,
where the principal items are IT technical consulting and support services ($509 million), IT design and
development services ($335 million), and hosting and IT infrastructure provisioning ($182 million). A further
though smaller cost in the balance of payments is licencing fees. In calendar 2019 licences to reproduce
16 https://www.stats.govt.nz/news/digital-overtakes-wine-exports
17 https://www.stats.govt.nz/information-releases/balance-of-payments-and-international-investment-
position-december-2019-quarter in the spreadsheet ‘International trade in services by service type: Year end December
2019’
0 // 0 // June 2020
Commercial in Confidence // www.catalyst.net.nz // Page 9and/or distribute computer software amounted to an import cost of $401 million, a relatively slower growing
import (up by 4.0% a year over the past five years).
Inevitably, there is always going to be substantial two-way trade in IT services as there is in other tradable
goods and services: products and services tend not to be perfect substitutes for each other, there are
overseas suppliers who are very good at what they offer, and we are always going to be simultaneously an
exporter and an importer of IT, just as we are of wine. But the strong export performance of New Zealand IT
companies in recent years suggests that there may be well be public sector contracts currently going to
overseas companies which could now be competed for by local suppliers. Again, as with the national interest
benefits arising from local multiplier effects, any agency commissioning an individual piece of project work will
not be seeing the wider big picture, and it would be useful to have some means of incorporating the
desirability of import substitution into purchasing decisions.
Support the opportunities in a strategic and high growth sector
Everyone is agreed that the IT industry is increasingly becoming central to the operation of a high-income
economy and a well-functioning government. In 2017 the then National-led government said in the ‘Building a
Digital Nation’18 part of its Business Growth Agenda that “We want New Zealand to be an adaptive and
prosperous leading Digital Nation – a nation with a thriving digital sector, where our businesses, people and
government are all using digital technology to drive innovation, improve productivity and enhance the quality
of life for all New Zealanders”. The current Labour-led government has said 19 that for the government itself
“Digital is about more than improving IT systems and processes. In the broadest sense, it means doing things
differently in an increasingly connected world — using new mindsets, skillsets, technologies and data to
benefit people, government and the economy. Accelerating the New Zealand Government’s digital
transformation will help people access personalised services when and where they need them, engage in
decisions about issues they care about, and trust in an open, transparent and inclusive government”.
While there have been a large number of useful policy initiatives, and some outstanding successes – New
Zealanders looking to get a passport or register a company, for example, can do it online in ways that many
other developed economies have been unable to match – there appear to have been no initiatives squarely
aimed at building up scale, and the synergies and productivity gains that tend to follow, even though the
benefits of building up self-reinforcing clusters have been known for a very long time, and indeed long before
‘Silicon Valley’ became the most dramatic example. As the New Zealand Porter project20 said nearly thirty years
ago, “National advantage resides as much in clusters as in individual industries. Outside of the agricultural
sector, New Zealand has not been able to create competitive clusters of industries…Central and local
governments should encourage investments that develop, or attract, specialist suppliers and industries related
to our current areas of success”. And it seems to have been forgotten that the New Zealand software industry
was actually one of the industry studies highlighted in the Porter project as being a good base to work from
and develop export sales: “The software industry…illustrates that New Zealand firms can compete in rapidly
changing technology intensive industries, despite relatively unfavourable conditions” 21.
18 https://www.mbie.govt.nz/assets/247943bfa5/building-a-digital-nation-bga.pdf
19 https://www.digital.govt.nz/digital-government/digital-transformation/nz-digital-transformation/
20 Graham Crocombe, Michael Enright, Michael Porter, Upgrading New Zealand’s Competitive Advantage, Oxford
University Press, 1991, p176
21 Crocombe et al, p58
0 // 0 // June 2020
Commercial in Confidence // www.catalyst.net.nz // Page 10That proved to be a very prescient call. New Zealand public procurement could help develop further critical
scale. In tech sectors where network effects tend to be important – everyone is on Facebook because
everyone else is – an initial head start can snowball into a position of industry strength. Again the
procurement policy criteria could usefully incorporate some appreciation of the value of the first mover
advantage and help New Zealand companies get the initial orders that can trigger subsequent network effects.
A closing word on competition in IT markets
Local procurement can, and should, coexist with strong domestic competition. It does not mean pursuing any
kind of dubious “national champion” strategy: as the recent (‘Harper’) review of Australian competition policy 22
put it in 2015, “From time to time, there are calls for competition policy to be changed to allow the formation
of ‘national champions’ — national firms that are large enough to compete globally ... While the Panel agrees
that the pursuit of scale efficiencies is a desirable economic objective, it is less clear whether, and in what
circumstances, suspending competition laws to allow the creation of national champions is desirable from
either an economic or consumer perspective ... Porter and others note that the best preparation for overseas
competition is not insulation from domestic competition but exposure to intense domestic competition”. And
in any event New Zealand will need to respect its international obligations to hold non-discriminatory
government procurement policies, not least because New Zealand would expect to benefit from other
countries’ similarly open procurement purchases.
At the same time the IT market is not the level playing field of the economics textbooks. Currently two of the
top policy concerns of competition regulators worldwide are the market dominance of a small group of tech
titans – the ‘FAANGs’ (Facebook, Amazon, Apple, Netflix, Google) – and their alleged ability to insulate
themselves from nascent competition (for example by buying out startups that might be the embryos of future
competitors). Not all the criticism is justified – these companies produce valued services in markets which
because of network effects tend to ‘tip’ towards one large incumbent in any event – but in many IT markets
the reality is a well-embedded incumbent with strategic ability to make it difficult for would-be competitors.
As this report has shown, where public sector purchasers are considering otherwise well-matched bids for
business, there are a range of economic benefits from choosing a locally-based supplier that can benefit either
the national economy as a whole or the government’s accounts, and which should be taken into account in
assessing the overall outcome of the procurement decision. A further benefit would be to help even up the
competitive playing field where incumbents have advantages that are difficult for competitors to surmount
unaided.
22 https://treasury.gov.au/publication/p2015-cpr-final-report, p318
0 // 0 // June 2020
Commercial in Confidence // www.catalyst.net.nz // Page 11You can also read