Distribution of Streptococcal Pharyngitis and Acute Rheumatic Fever, Auckland, New Zealand, 2010-2016 - CDC
←
→
Page content transcription
If your browser does not render page correctly, please read the page content below
RESEARCH

             Distribution of Streptococcal
                Pharyngitis and Acute
             Rheumatic Fever, Auckland,
              New Zealand, 2010–2016
        Jane Oliver, Arlo Upton, Susan J. Jack, Nevil Pierse, Deborah A. Williamson, Michael G. Baker

 Group A Streptococcus (GAS) pharyngitis is a key initia-           of ARF is highest. ARF rates peak among children
 tor of acute rheumatic fever (ARF). In New Zealand, ARF            5–14 years of age (4).
 cases occur more frequently among persons of certain                    ARF and rheumatic heart disease exert a major
 ethnic and socioeconomic groups. We compared GAS                   burden on developing countries. Disease rates are also
 pharyngitis estimates (1,257,058 throat swab samples)              particularly high among persons of Māori and Pa-
 with ARF incidence (792 hospitalizations) in Auckland              cific Islander ethnicity in New Zealand (4–6). During
 during 2010–2016. Among children 5–14 years of age in              2000–2009, among children 5–14 years of age, ARF in-
 primary healthcare clinics, GAS pharyngitis was detected           cidence among Māori children was 40.2 cases/100,000
 in similar proportions across ethnic groups (≈19%). Rela-          children, and among Pacific Islander children, it was
 tive risk for GAS pharyngitis was moderately elevated
                                                                    81.2/100,000. By contrast, the incidence for non-Māori,
 among children of Pacific Islander and Māori ethnicities
 compared with those of European/other ethnicities, but
                                                                    non–Pacific Islander children in New Zealand was
 risk for ARF was highly elevated for children of Pacific           2.1/100,000. Associations between ARF and socioeco-
 Islander and Māori ethnicity compared with those of Eu-            nomic deprivation have inconsistently been observed
 ropean/other ethnicity. That ethnic disparities are much           (6–10). During 2010–2013, persons living in the most
 higher among children with ARF than among those with               deprived New Zealand neighborhoods were 33 (95%
 GAS pharyngitis implies that ARF is driven by factors              CI 19–58) times more likely to be hospitalized with
 other than rate of GAS pharyngitis alone.                          ARF for the first time compared with persons living in
                                                                    the least deprived neighborhoods (6).

A    cute rheumatic fever (ARF) can cause rheu-
     matic heart disease, which in turn may pro-
duce permanent heart damage (1). ARF is an au-
                                                                         In 2011, the New Zealand government announced
                                                                    a major national Rheumatic Fever Prevention Pro-
                                                                    gramme (RFPP), aiming to reduce the national in-
toimmune disease triggered in response to group                     cidence of ARF by two thirds (to 1.4 cases/100,000
A Streptococcus (GAS) infection. GAS pharyngitis                    persons) by mid-2017 (11,12). The RFPP strongly em-
is generally considered the major initiator of ARF,                 phasized primary prevention of ARF through sore
but GAS skin infection may also play a role. Sub-                   throat management; that is, prompt detection and an-
stantial knowledge gaps with regard to ARF risk                     timicrobial treatment of GAS pharyngitis before devel-
factors and pathogenesis impair disease prevention                  opment of ARF (11,12). In areas with high rates of ARF,
and control (2,3). If GAS pharyngitis is the sole ini-              the sore throat management aspect of the RFPP had 2
tiator of ARF, then we would expect this infection                  components: school-based throat swabbing clinics and
to be most common in groups in which incidence                      rapid-response primary healthcare clinics (PHCs).
                                                                    School-based clinics operated only when schools were
Author affiliations: Murdoch Children’s Research Institute,         in session. Children with a self-reported sore throat
Melbourne, Victoria, Australia (J. Oliver); University of Otago     could have their throat swabbed free of charge, either
Wellington, Wellington, New Zealand (J. Oliver, N. Pierse,          at school or at a rapid-response PHC when certain con-
M.G. Baker); University of Melbourne, Melbourne (J. Oliver,         ditions were met. If the swab sample culture produced
D.A. Williamson); Labtests Ltd, Auckland, New Zealand               GAS, a 10-day course of oral amoxicillin was recom-
(A. Upton); University of Otago, Dunedin, New Zealand (S.J. Jack)   mended (13). The RFPP was reportedly the largest
DOI: https://doi.org/10.3201/eid2606.181462                         sore throat management program for ARF prevention

                             Emerging Infectious Diseases • www.cdc.gov/eid • Vol. 26, No. 6, June 2020                1113
RESEARCH
ever conducted (14). As of 2014, school clinics included contacts 3–35 years of age if they visited a school or
≈50,000 children (12). By December 2013, a total of 83% rapid-response clinic with a self-reported sore throat.
of school clinics had been implemented and additional Other persons contributed throat swab samples in
rapid-response clinics were being set up in PHCs. Pub- PHCs when clinicians decided to collect a sample
lic health messages about the value of seeking throat separately from the RFPP (15).
swabbing for those experiencing sore throat symptoms
were promoted to populations considered at high risk Throat Swab Sample Data Collection
for ARF (15). Since mid-2009, the sole community pathology labo-
The RFPP resulted in a large collection of high- ratory service provider for the entire Auckland region
quality diagnostic throat swab sample data, which has been Labtests (19). We obtained data on all throat
provided a unique opportunity to describe the distri- swab samples cultured at Labtests during 2010–2016:
bution of GAS pharyngitis across an entire popula- patient encrypted NHI, age, date of swab sample col-
tion and correlate the data with ARF rates. Most RFPP lection, sample source (i.e., school clinic or PHC), and
throat swab samples were collected in Auckland, culture result (e.g., GAS). Although swab samples
where ≈50% of ARF patients in New Zealand reside collected in school clinics could be distinguished from
(15). Our aim was to describe the distribution of GAS those collected in PHCs, we could not distinguish be-
pharyngitis in the Auckland population and compare tween samples collected in rapid-response clinics and
it with the distribution of ARF. those in regular PHCs.
Methods ARF Data Collection
We obtained data on ARF diagnoses during 1988–2016
Setting from the Ministry of Health (International Classifica-
In 2013, the population of New Zealand was ≈4.5 tion of Diseases, 10th Revision [ICD-10], codes I00-I02
million persons. The largest city is Auckland, where and ICD International Classification of Diseases, 9th
around one third of the population resides. In the 2013 Revision [ICD-9], codes 390–392). We also obtained
census, 10% of persons in Auckland identified their rheumatic heart disease diagnoses for the same period
ethnicity as Māori, 12% Pacific Islander, 21% Asian, (ICD-10 codes I05-I09 and ICD-9 codes 393–398). The
and 57% European/other (16). Auckland comprises 3 encrypted NHI was provided for each entry along with
district health boards (DHBs): Waitemata, Auckland, the demographic information it encoded. We identi-
and Counties Manukau. Many Auckland schools (n = fied the first ARF entry for each child and removed all
75) participated in the RFPP school program. Rapid- later entries. Because ARF precedes rheumatic heart
response clinics were widely implemented (15). disease in the causal pathway, when identifying initial
The National Health Index (NHI) is a unique pa- ARF hospitalizations, we excluded all persons who
tient identifier widely used in New Zealand health had been hospitalized for rheumatic heart disease be-
data; it can be encrypted to protect patient privacy. De- fore their first hospitalization for ARF. We excluded
mographic information encoded by the NHI includes from study all admissions for non–New Zealand citi-
New Zealand resident status, prioritized ethnicity, sex, zens. We also excluded hospital transfers; thus, only
birth date, DHB, and New Zealand Deprivation Index the first record was included for each ARF admission.
(NZDep) score. The prioritized ethnicity classification In so doing, we attempted to limit the dataset to initial
system allocates persons to a single ethnic group based presentations of ARF, in accordance with the method
on a prioritized order of Māori, Pacific Islander, Asian, adopted by the Ministry of Health in 2013 (18). We cre-
and European/other. The European/other group re- ated a dataset of initial ARF hospitalizations in Auck-
fers to non-Māori, non–Pacific Islander, and non-Asian land during 2010–2016, the initial ARF dataset, and
persons (17). The NZDep score is an ecologic mea- performed basic demographic analyses.
sure of socioeconomic deprivation corresponding to
a neighborhood (18). Deciles 1–2 (quintile 1) represent Statistical Analyses
the least deprived neighborhoods, and deciles 9–10 We performed descriptive epidemiologic analyses ac-
(quintile 5) represent the most deprived. cording to key outcome measures, stratified according
Persons eligible to have their throat swabbed and to selected demographic characteristics and whether
receive antimicrobial treatment through the RFPP GAS pharyngitis was detected. We considered a
were Māori and Pacific Islander children 4–19 years throat swab sample that produced GAS on culture
of age, all children in that age group living in quintile to indicate a case of GAS pharyngitis. Key outcome
5 neighborhoods, and eligible children’s household measures were incidence of throat swab samples (no.
1114 Emerging Infectious Diseases • www.cdc.gov/eid • Vol. 26, No. 6, June 2020Streptococcal Pharyngitis and Rheumatic Fever
samples collected/total no. children sampled), inci- swab samples collected each year increased dramati-
dence of GAS pharyngitis, and the proportion of total cally; 8 times more samples were collected in 2016
throat swab samples that indicated GAS pharyngitis. than in 2010. During 2011–2016, swabbing increased in
For all analyses, we used R version 3.3.1 (20). Be- school clinics but also increased 4-fold in PHCs. The
cause the RFPP was still being implemented in 2013, throat swabbing incidence for the Auckland popula-
our later analyses focused on 2014–2016. After 2013, tion plateaued in 2014–16; swabbing in school clinics
the annual number of swab samples collected peaked, peaked in 2014 (130.8 samples/1,000 person-years) and
remaining relatively stable with high population cov- in PHCs peaked in 2015 (114.5 samples/1,000 person-
erage. Most analyses concentrated on children 5–14 years; Figure 1; Appendix Table 1, https://wwwnc.
years of age (4). The focus is largely on samples from cdc.gov/EID/article/26/6/18-1462-App1.pdf).
PHCs because the school programs intensely targeted Of the swab samples, 163,534 were positive for
high-risk populations on the basis of ARF incidence. GAS (13.0% total samples); 64,036 were positive for
When calculating seasonal rates, we multiplied nu- streptococci of group C, group G, or both (5.1% total).
merator (swab) data by 4 to produce annualized rates. The annual proportion of samples positive for GAS
decreased from 15.3% in 2010 to 10.7% in 2011 before
Rate Calculations increasing to 15.1% in 2016 (Figure 1). However, the
If a person contributed >1 swab sample, that person annual incidence of GAS pharyngitis increased nearly
would be counted >1 time in the numerator. We cal- 8-fold from 2010 to 2016. The proportion of positive
culated intercensus population estimates and pro- GAS swab samples was higher among those collected
jections by interpolation and extrapolation, using in PHCs (15.0%) than in school clinics (12.6%) (Figure
denominator data from 2006 and 2013 population 1; Appendix Table 1).
censuses (21). When calculating mean rates, we used
the population estimate for the middle of the period. Sociodemographic Characteristics of Populations
We calculated relative risks (RRs) and 95% CIs for Contributing Throat Swab Samples
initial ARF and GAS pharyngitis from the number of We determined the sociodemographic characteristics
cases detected in the population. of populations who contributed throat swab samples
in detail for 2014–2016. Sample collection in PHCs
Results was highest among children 5–9 years of age (100,406
total swab samples, 356.6 swab samples/1,000 chil-
Settings and Time Trends in Throat Swab dren), followed by children 10–14 years (72,980 swab
Sample Collection and GAS Pharyngitis samples, 266.5/1,000 children), and then children
During 2010–2016, a total of 1,257,058 throat swabsRESEARCH
The incidence of GAS pharyngitis was highest twice the rate detected by samples collected in the
among children 5–9 years of age (82.9 cases/1,000 summer. By contrast, the proportion of GAS-positive
person-years), followed by children 10–14 years samples was lower in winter and spring than in sum-
of age (44.3 cases/1,000 person-years). GAS was mer and autumn. The seasonal pattern of ARF inci-
uncommon in throat swab samples from persons dence rates was roughly similar to that of GAS phar-
>50 years of age, although ≈15,000 swabs were col- yngitis; ARF rates were highest in autumn and winter
lected from persons in this age group each year. A (Figure 3, panel B).
much smaller secondary peak in incidence of GAS
pharyngitis was seen among adults 30–39 years of Throat Swab Sample Collection and Incidence
age, and 66.2% of those affected were female (Figure of GAS Pharyngitis by Ethnicity
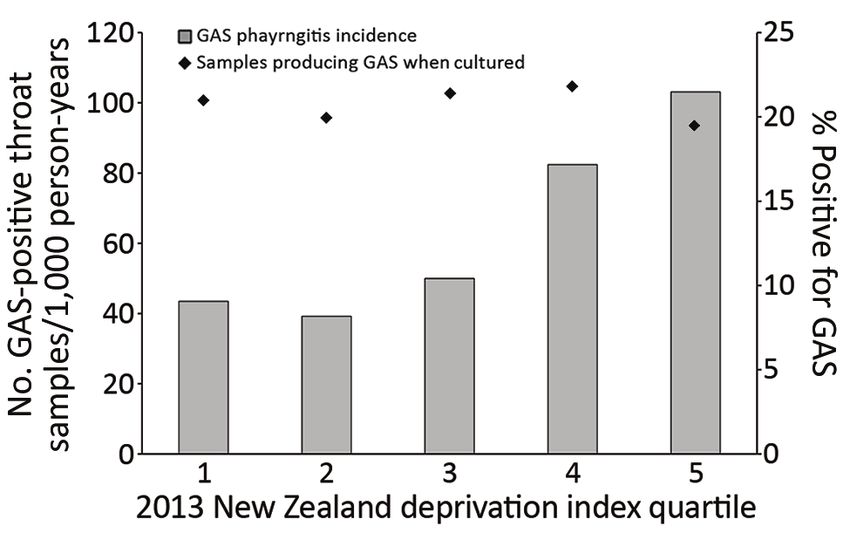
2; Appendix Table 2). Nearly one quarter of all Pacific Islander children and
In school clinics, the incidence of swab collection one fifth of all Māori children contributed >1 swab
was highest among children 5–9 years of age (1151.3 in PHCs, compared with approximately one sixth of
swabs/1,000 person-years), as was the incidence of European/other children. The proportion of samples
GAS pharyngitis (121.8 swabs/1,000 person-years). positive for GAS was similar between these groups
Of the total school clinic swab samples collected, (20.1%–22.3%), but incidence of GAS pharyngitis was
96.2% were from children 5–14 years of age, the target significantly higher among Pacific Islander (99.6 cas-
age group. es/1,000 person-years) and Māori (79.0 cases/1,000
During the study period, 792 persons were hos- person-years) children compared with those of Euro-
pitalized for initial ARF; 398 (50.3%) were children pean/other ethnicity (58.3 cases/1,000 person-years).
5–14 years of age. Because incidence of GAS phar- Incidence of GAS pharyngitis was lowest among
yngitis and ARF were both highest among children Asian children (Figure 4; Appendix Table 3).
5–14 years of age, we further restricted our analysis to
this group. Distribution of Throat Swab Sample Collection and
Incidence of GAS Pharyngitis
Seasonal Distribution of Swab Sample Collection Most throat swab samples were collected from chil-
and GAS Pharyngitis dren living in the most deprived neighborhoods; >1
The incidence (and RR) of throat swab collection was throat swab sample was contributed by approximate-
highest in winter, both in PHCs (480.3/1,000 children ly one quarter of all children from quintile 5, com-
5–14 years of age) and overall; incidence of GAS phar- pared with one eighth of all children from quintiles 1
yngitis was also highest in winter (Table; Figure 3, and 2. The proportion of GAS-positive swab samples
panel A; Appendix Table 3). In winter, the incidence from children across quintiles was similar (19.5%–
of GAS detected by swab samples collected in PHCs 21.8%), but incidence of GAS pharyngitis increased
(87.9 samples/1,000 person-years) was more than with area deprivation. For children in quintile 1,
Figure 2. Mean annual
distribution of GAS pharyngitis
in PHCs, by age group,
Auckland, New Zealand,
2014–2016. Diamonds
indicate percentages of swab
sample cultures positive for
GAS; bars above and below
indicate 95% CIs. GAS, group
A Streptococcus; PHC private
healthcare clinic.
1116 Emerging Infectious Diseases • www.cdc.gov/eid • Vol. 26, No. 6, June 2020Streptococcal Pharyngitis and Rheumatic Fever
Table. Comparison of GAS pharyngitis and ARF rates in the Auckland region, New Zealand, 2014–2016*
GAS pharyngitis in PHCs and
GAS pharyngitis in PHCs schools Initial ARF hospitalizations
Mean annual Mean annual Mean annual
Characteristic incidence† RR (95% CI) incidence† RR (95% CI) incidence† RR (95% CI)
Total 15.7 Referent NA 28.1 Referent NA 0.1 Referent NA
Age group, y
0–4 26.9 2.7 (2.6–2.9) 28.7 2.8 (2.6–2.9) 0.7 0.1 (0.0–0.4)
5–9 82.9 8.2 (7.8–8.6) 204.8 18.1 (17.4–18.9) 17.8 2.5 (1.7–3.8)
10–14 44.3 4.5 (4.2–4.7) 99.7 9.3 (8.9–9.7) 32.5 4.7 (3.3–6.7)
15–19 17.3 1.8 (1.6–1.9) 20.4 2.0 (1.9–2.1) 9.2 1.3 (0.8–2.1)
20–29 9.9 Referent 10.3 Referent 7.1 Referent
30–39 11.1 1.1 (1.1–1.2) 11.5 1.1 (1.0–1.2) 1.7 0.2 (0.1–0.5)
>40 2.5 0.3 (0.2–0.3) 2.6 0.2 (0.2–0.3) 0.0 0.0 (0.0–0.1)
Children age 5–14 y
Total 62.8 Referent NA 150.6 Referent NA 25.0 Referent NA
M 63.3 Referent 153.4 Referent 25.6 Referent
F 62.5 1.0 (1.0–1.0) 147.6 1.0 (0.9–1.0) 23.7 0.9 (0.7–1.3)
Prioritized ethnicity
Māori 79.0 1.3 (1.3–1.4) 248.7 3.4 (3.3–3.5) 35.5 86.9 (11.9–635.0)
Pacific Islander 99.6 1.7 (1.6–1.8) 383.4 4.8 (4.7–5.0) 98.3 240.4 (33.5–1,722.6)
Asian 29.2 0.5 (0.5–0.5) 41.0 0.6 (0.6–0.7) 0.0 0.7 (0.0–18.0)
European/Other 58.3 Referent 66.9 Referent 0.4 Referent
2013 New Zealand Deprivation Index quintile
1 43.5 Referent 45.4 Referent 3.0 Referent
2 39.2 0.9 (0.8–1.0) 45.6 1.0 (0.9–1.1) 2.6 0.9 (0.2–3.8)
3 50.0 1.1 (1.1–1.2) 61.6 1.4 (1.3–1.4) 6.5 2.1 (0.6–7.6)
4 82.4 1.9 (1.7–2.0) 125.7 2.7 (2.5–2.8) 24.7 8.1 (2.8–23.7)
5 103.1 2.3 (2.2–2.5) 427.6 7.7 (7.4–8.1) 76.9 25.2 (9.3–68.5)
Season
Summer 39.3 Referent 77.0 Referent 25.5 Referent
Autumn 62.3 1.6 (1.5–1.6) 185.3 2.3 (2.3–2.4) 32.6 1.3 (0.8–1.9)
Winter 87.9 2.2 (2.2–2.3) 201.7 2.5 (2.5–2.6) 31.9 1.3 (0.9–1.8)
Spring 62.1 1.6 (1.5–1.6) 138.5 1.8 (1.7–1.8) 8.5 0.3 (0.2–0.6)
District health board
Waitemata 54.4 1.0 (0.9–1.0) 67.3 0.8 (0.8–0.9) 13.4 0.6 (0.3–0.9)
Auckland 54.9 Referent 80.1 Referent 24.1 Referent
Countries Manukau 72.1 1.3 (1.2–1.4) 270.9 3.0 (2.9–3.1) 36.8 1.5 (1.0–2.3)
*ARF, acute rheumatic fever; GAS, group A Streptococcus; PHC, primary healthcare clinic; referent NA, referent not available; RR, relative risk.
†Per 1,000 person-years.
incidence was 43.5 cases/1,000 person-years, but in discrepancy was not nearly as extreme as the RR for
quintile 5, incidence was 103.1 cases/1,000 person- ARF. Higher RRs for GAS pharyngitis were also esti-
years (Figure 5; Appendix Table 3). mated for Māori and Pacific Islander children regard-
less of the sample collection setting. A similar pattern
Comparison of GAS Pharyngitis and ARF Incidence was noted for differences between NZDep quintiles.
We compared mean annual incidence of GAS pharyn- Seasonality was more pronounced for GAS pharyngitis
gitis during 2014–2016, by selected demographic char- incidence than for ARF incidence; at PHCs, GAS phar-
acteristics and swab sample source (i.e., PHC and total), yngitis was least likely in summer and most likely in
with the mean annual incidence of ARF (Table). The RR winter (RR 2.2, 95% CI 2.2–2.3).
for initial ARF was highest among children 10–14 years
of age; however, the RR for GAS pharyngitis was high- Discussion
est among children 5–9 years of age. Although ARF was The RFPP provided a unique opportunity to assess
rare among childrenRESEARCH
Figure 3. Mean annual distribution of GAS pharyngitis and ARF cases, by season, Auckland, New Zealand, 2014–2016. A) GAS-
positive throat swab samples collected from children 5–14 years of age in PHCs. Diamonds indicate percentages of swab sample
cultures positive for GAS. B) Mean annual number of first ARF episodes. ARF, acute rheumatic fever; GAS, group A Streptococcus;
PHC, private healthcare clinic.
population of children 5–14 years of age but varied be- largely detected GAS carriage. To support this view,
tween PHC and school clinic settings, suggesting that the proportion of GAS-positive samples from school
sample collection thresholds differed by setting; GAS clinics was slightly lower than the estimated preva-
pharyngitis is seasonal and shares some similarities lence of asymptomatic pharyngeal GAS carriage re-
with ARF; unlike ARF, GAS pharyngitis occurs across a ported (12%) (23). This threshold effect has several
wide range of age groups (4); and ethnic and socioeco- implications. First, we should concentrate on find-
nomic differences in GAS pharyngitis are insufficient to ings from PHCs, where the threshold for attendance
explain the marked inequities in ARF incidence. seems to be higher and a moderate proportion of cas-
A striking feature of GAS pharyngitis is the con- es are likely to represent true GAS pharyngitis (not
sistent difference in the proportion of GAS-positive viral pharyngitis with coincidental GAS detection
samples collected in PHCs and school clinics. The on swab culture) (24). Second, GAS pharyngitis in-
proportion of GAS-positive samples collected from cidence rates are likely to provide a better indication
Māori and Pacific Islander children 5–14 years of age of the distribution of this condition compared with
in PHCs (20%–21%) was nearly twice that observed the proportion of GAS-positive samples overall. The
for those collected by school programs (11%). At
PHCs, the proportion of GAS-positive samples was
similar between ethnic groups and NZDep quintiles
(except somewhat lower for Asian children). One
possible explanation could be that as children ap-
proach the level where their caregiver feels they are
sufficiently unwell to warrant visiting a PHC, the
likelihood of them having GAS pharyngitis is much
the same across ethnic groups and deprivation quin-
tiles. Consequently, the proportion of GAS-positive
samples by health service may reveal information
about the threshold at which persons seek treat-
ment there. Furthermore, the literature describes
GAS pharyngitis as a severely painful sore throat
Figure 4. Mean annual distribution of GAS pharyngitis in PHCs
(22). It is debatable whether many affected children among children 5–14 years of age, by ethnic group, Auckland,
would therefore attend school; many may have vis- New Zealand, 2014–2016. Diamonds indicate percentages
ited a rapid response PHC instead. Consequently, of swab sample cultures positive for GAS. GAS, group A
GAS-positive samples from school clinics may have Streptococcus; PHC, private healthcare clinic.
1118 Emerging Infectious Diseases • www.cdc.gov/eid • Vol. 26, No. 6, June 2020Streptococcal Pharyngitis and Rheumatic Fever
reducing swab sample collection from young chil-
dren is less certain. Although the incidence of GAS
pharyngitis was elevated in groups at highest risk
for ARF, the age distribution was much broader.
If, as hypothesized, ARF is caused by repeated un-
treated GAS pharyngitis, which eventually triggers
autoimmune reactions (priming) (1), then concen-
trating sore throat management strategies on young
children is probably justifiable. The extreme dispari-
ties in ARF rates between ethnic and socioeconomic
groups were not seen for GAS pharyngitis rates.
These observations do not support the hypothesis
that differences in observed GAS pharyngitis are a
Figure 5. Mean annual distribution of GAS pharyngitis in PHCs
key pathway propelling the observed ARF inequi-
among children 5–14 years of age, by NZDep quintile, Auckland,
New Zealand, 2014–2016. Diamonds indicate percentages ties. Consequently, other factors that may drive ARF
of swab sample cultures positive for GAS. GAS, group A need to be considered, including the role of GAS
Streptococcus; NZDep, New Zealand Deprivation Index; PHC, skin infections (31). Ethnic and socioeconomic dif-
private healthcare clinic. ferences in exposures to environmental cofactors or
host factors also need to be considered as key drivers
consistently lower proportion of GAS-positive sam- of ARF inequities (31–37).
ples from the school program, at a level equivalent to Strengths of our study include complete data-
asymptomatic detection, raises questions about the set coverage of a large, well-defined population. Well-
effectiveness of basing the RFPP in this setting at all. characterized numerators and denominators permitted
There are potential ways to improve the accuracy of analysis by key demographic attributes. Microbiological
GAS pharyngitis diagnosis, such as through clinical analyses were performed by a single provider (Labtests)
decision rules, although the validity and practicality using standardized protocols. A limitation is that swab
of such methods are debated (25–28). sample data reflect healthcare service use rather than
The value of observing the incidence of GAS phar- representative population sampling, particularly be-
yngitis in PHC settings is illustrated by seasonal distri- cause accurate RFPP coverage data were never collect-
bution patterns. GAS pharyngitis was more common ed. In addition, the RFPP deliberately targeted persons
in winter, when incidence was more than twice that in in groups at high risk for ARF, for whom GAS pharyn-
summer. Paradoxically, the proportion of GAS-positive gitis risk is potentially higher. These data cannot there-
swab samples showed the opposite pattern, being high- fore directly measure the distribution of GAS pharyn-
est in summer. This effect was caused by the large in- gitis. A second limitation with this study, and with the
crease in sample collection during winter. Most phar- RFPP in general, is that it is impossible to know which
yngitis has a viral cause (27); thus, more GAS-negative GAS-positive children have true GAS pharyngitis and
children reporting a sore throat visited a PHC in winter, which have pharyngitis from other causes and coin-
reducing the proportion of swab samples that produced cidental GAS carriage. No information about clinical
GAS in culture. The increase in sample collection during manifestations was collected, and serologic confirma-
winter was somewhat appropriate given the increased tion of infection was not sought in the RFPP (and was
rate of ARF. neither recommended nor practical) (38). It is likely that
Differences in the proportion of GAS swabs many persons for whom antimicrobial drugs were pre-
across ethnic and socioeconomic groups were insuf- scribed had viral infections and may not have benefited
ficient for explaining the marked inequities in ARF from treatment. Last, because the RFPP was not set up
incidence rates. Māori and Pacific Islander children, to be evaluated, it is impossible to know which swab
among whom risk of acquiring ARF is highest, were samples were collected in rapid-response clinics and
well targeted by the RFPP. Very low rates of ARF in which as part of routine healthcare. Regardless, the in-
non-Māori, non–Pacific Islander populations in New crease in PHC swabbing correlates strongly with, and is
Zealand have been reported (29,30), along with ≈200 most likely attributable to, RFPP implementation (15).
throat swabs collected/1,000 persons (Appendix Ta- A priority for future research is to establish the
ble 3). This observation raises the question of wheth- pathogenic significance of GAS detection in pharyngeal
er intensive swabbing of non-Māori, non–Pacific Is- swab sample cultures across different settings. Future
lander populations is appropriate. The evidence for analyses could assess the frequency of throat sample
Emerging Infectious Diseases • www.cdc.gov/eid • Vol. 26, No. 6, June 2020 1119RESEARCH
collection and GAS pharyngitis for an entire birth cohort References
of children in Auckland. Population incidence (cohort) 1. Carapetis JR, Currie BJ, Good MF. Towards understanding
the pathogenesis of rheumatic fever. Scand J Rheumatol.
studies could be useful for establishing accurate risk 1996;25:127–31, 32–3.
measures, particularly of the type conducted in Mel- 2. Parks T, Smeesters PR, Steer AC. Streptococcal skin infection
bourne, Victoria, Australia, where GAS pharyngitis sur- and rheumatic heart disease. Curr Opin Infect Dis. 2012;25:145–
veillance data were collected to investigate prevalence, 53. https://doi.org/10.1097/QCO.0b013e3283511d27
3. Carapetis JR, Beaton A, Cunningham MW, Guilherme L,
transmission, and serology (24). It would be useful to Karthikeyan G, Mayosi BM, et al. Acute rheumatic fever and
establish an ongoing surveillance and monitoring pro- rheumatic heart disease. Nat Rev Dis Primers. 2016;2:15084.
gram for ARF prevention that could assess specific in- https://doi.org/10.1038/nrdp.2015.84
tervention components, such as rapid-response clinics. 4. Carapetis JR, Steer AC, Mulholland EK, Weber M.
The global burden of group A streptococcal diseases. Lancet
A case–control study would be well suited to investigate Infect Dis. 2005;5:685–94. https://doi.org/10.1016/
factors contributing to the greatly elevated ARF risk for S1473-3099(05)70267-X
Māori and Pacific Islander children, beyond exposure 5. Jaine R, Baker M, Venugopal K. Acute rheumatic fever
to GAS pharyngitis alone (39,40). Specimens collected associated with household crowding in a developed country.
Pediatr Infect Dis J. 2011;30:315–9. https://doi.org/10.1097/
in such a study could be used for immune profiling to INF.0b013e3181fbd85b
investigate the hypothesis that cumulative exposure to 6. Gurney JK, Stanley J, Baker MG, Wilson NJ, Sarfati D.
GAS is indeed a risk factor for ARF (41). Estimating the risk of acute rheumatic fever in New Zealand by
In conclusion, we found that the RFPP dramati- age, ethnicity and deprivation. Epidemiol Infect. 2016;144:3058–
67. https://doi.org/10.1017/S0950268816001291
cally increased rates of throat swab sample collec- 7. Riaz BK, Selim S, Karim MN, Chowdhury KN, Chowdhury SH,
tion among children at high risk for ARF. Throat Rahman MR. Risk factors of rheumatic heart disease in
swab sample collection is appropriate, given the Bangladesh: a case-control study. J Health Popul Nutr.
goal of reducing ARF. However, because GAS phar- 2013;31:70–7. https://doi.org/10.3329/jhpn.v31i1.14751
8. Adanja B, Vlajinac H, Jarebinski M. Socioeconomic factors in
yngitis is common in human populations, the RFPP the etiology of rheumatic fever. J Hyg Epidemiol Microbiol
resulted in many persons who were not at high Immunol. 1988;32:329–35.
risk for ARF undergoing throat swabbing and, for 9. Zaman MM, Yoshiike N, Chowdhury AH, Jalil MQ,
many, antimicrobial drug treatment. The popula- Mahmud RS, Faruque GM, et al. Socio-economic deprivation
associated with acute rheumatic fever. A hospital-based
tion incidence of GAS pharyngitis shows some cor- case-control study in Bangladesh. Paediatr Perinat
relation with ARF risk. However, disparities in ARF Epidemiol. 1997;11:322–32. https://doi.org/10.1111/
incidence are vastly higher across ethnic and socio- j.1365-3016.1997.tb00011.x
economic groups than are disparities in GAS phar- 10. Ba-Saddik IA, Munibari AA, Al-Naqeeb MS, Parry CM,
Hart CA, Cuevas LE, et al. Prevalence of rheumatic heart
yngitis, as measured by swab sample cultures from disease among school-children in Aden, Yemen. Ann Trop
persons with self-reported pharyngitis. This incon- Paediatr. 2011;31:37–46. https://doi.org/10.1179/146532811
sistency implies that factors other than exposure to a 0Y.0000000007
single episode of GAS pharyngitis alone must drive 11. New Zealand Ministry of Health. Rheumatic fever [cited
2017 Dec 8]. http://www.health.govt.nz/our-work/
ARF development. Identifying and mitigating any diseases-and-conditions/rheumatic-fever
modifiable risk factors may hold the key to effective 12. New Zealand Ministry of Health. Progress on the Better
ARF prevention. Public Services rheumatic fever target [cited 2018 Feb 10].
http://www.health.govt.nz/about-ministry/what-we-do/
strategic-direction/better-public-services/progress-better-
Acknowledgments public-services-rheumatic-fever-target
We acknowledge Greg Morris, who extracted the data and 13. Lennon D, Kerdemelidis M, Arroll B, Sharpe N. Once-daily
provided guidance on data cleaning. amoxicillin for group A streptococcal (GAS) sore throat as
the other first-line option: a clarification of the NZ sore throat
J.O. was supported by a full-time PhD scholarship from guidelines. N Z Med J. 2011;124:116–9.
Lotteries Health Research. 14. Lennon D, Kerdemelidis M, Arroll B. Meta-analysis of
trials of streptococcal throat treatment programs to pre-
vent rheumatic fever. Pediatr Infect Dis J. 2009;28:e259–64.
About the Author https://doi.org/10.1097/INF.0b013e3181a8e12a
15. Jack SJ, Williamson DA, Galloway Y, Pierse N, Zhang J,
Dr. Oliver is a postdoctoral public health researcher. This Oliver J, et al. Primary prevention of rheumatic fever in the
study formed part of her doctoral thesis, which concerns 21st century: evaluation of a national programme. Int J
ARF, its risk factors, and determinants. She currently Epidemiol. 2018;47:1585–93. https://doi.org/10.1093/ije/
dyy150
works in infectious disease research at the University of 16. Statistics New Zealand. 2013 Census QuickStats about a
Melbourne and at Murdoch Children’s Research place: Auckland Region [cited 2018 Feb 13] http://www.
Institute. Her major focus is on streptococcal diseases and stats.govt.nz/Census/2013-census/profile-and-summary-
Buruli ulcer. reports/quickstats-about-a-place.aspx
1120 Emerging Infectious Diseases • www.cdc.gov/eid • Vol. 26, No. 6, June 2020Streptococcal Pharyngitis and Rheumatic Fever
17. Ministry of Health. HISO 10001:2017 ethnicity data protocols national epidemiological study. Lancet. 2012;379:1112–9.
[cited 2018 Feb 13]. https://www.health.govt.nz/ https://doi.org/10.1016/S0140-6736(11)61780-7
publication/hiso-100012017-ethnicity-data-protocols 32. Free S, Howden-Chapman P, Pierse N, Viggers H; Housing,
18. Salmond CE, Crampton P. Development of New Zealand’s Heating and Health Study Research Team. More effective
deprivation index (NZDep) and its uptake as a national home heating reduces school absences for children with
policy tool. Can J Public Health. 2012;103(Suppl 2):S7–11. asthma. J Epidemiol Community Health. 2010;64:379–86.
19. Labtests. About Labtests [cited 2018 Feb 13]. http://www. https://doi.org/10.1136/jech.2008.086520
labtests.co.nz/about-us/about-labtests 33. Pierse N, Arnold R, Keall M, Howden-Chapman P, Crane J,
20. R Core Team. R: A language and environment for statistical Cunningham M; Heating Housing and Health Study Group.
computing. Vienna (Austria): R Foundation for Statistical Modelling the effects of low indoor temperatures on the lung
Computing; 2014. function of children with asthma. J Epidemiol Community
21. Statistics New Zealand. Estimates and projections [cited 2018 Health. 2013;67:918–25. https://doi.org/10.1136/
Feb 15]. http://www.stats.govt.nz/browse_for_stats/ jech-2013-202632
population/estimates_and_projections.aspx 34. Anderson P, Craig E, Jackson G, Jackson C. Developing a
22. Wannamaker LW. Perplexity and precision in the diagnosis tool to monitor potentially avoidable and ambulatory care
of streptococcal pharyngitis. Am J Dis Child. 1972; sensitive hospitalisations in New Zealand children. N Z Med
124:352–8. J. 2012;125:25–37.
23. Shaikh N, Leonard E, Martin JM. Prevalence of 35. Baker MG, McDonald A, Zhang J, Howden-Chapman P.
streptococcal pharyngitis and streptococcal carriage in Infectious diseases attributable to household crowding in New
children: a meta-analysis. Pediatrics. 2010;126:e557–64. Zealand: a systematic review and burden of disease estimate
https://doi.org/10.1542/peds.2009-2648 [cited 2020 Mar 20]. https://www.health.govt.nz/publication/
24. Danchin MH, Rogers S, Kelpie L, Selvaraj G, Curtis N, infectious-diseases-attributable-household-crowding-new-
Carlin JB, et al. Burden of acute sore throat and group A zealand-systematic-review-and-burden-disease
streptococcal pharyngitis in school-aged children and their 36. Grimes A, Tim Denne T, Howden-Chapman P, Arnold R,
families in Australia. Pediatrics. 2007;120:950–7. Telfar-Barnard L, Preval N, et al. Cost benefit analysis of the
https://doi.org/10.1542/peds.2006-3368 Warm Up New Zealand: Heat Smart Programme [cited 2017
25. Centor RM. When should patients seek care for sore Apr 4]. https://motu.nz/our-work/urban-and-regional/
throat? Ann Intern Med. 2013;159:636–7. https://doi.org/ housing/cost-benefit-analysis-of-the-warm-up-new-zealand-
10.7326/0003-4819-159-9-201311050-00012 heat-smart-programme
26. Aalbers J, O’Brien KK, Chan WS, Falk GA, Teljeur C, 37. Woodward A, Crampton P, Howden-Chapman P, Salmond C.
Dimitrov BD, et al. Predicting streptococcal pharyngitis in Poverty—still a health hazard. N Z Med J. 2000;113:67–8.
adults in primary care: a systematic review of the diagnostic 38. Heart Foundation of New Zealand. Group A streptococcal
accuracy of symptoms and signs and validation of the Centor sore throat management guideline. 2014 Update [cited 2017
score. BMC Med. 2011;9:67. https://doi.org/10.1186/ Apr 4]. https://www.heartfoundation.org.nz/resources/
1741-7015-9-67 group-a-streptococcal-sore-throat-management
27. Mistik S, Gokahmetoglu S, Balci E, Onuk FA. Sore throat in 39. Oliver JR, Pierse N, Stefanogiannis N, Jackson C, Baker MG.
primary care project: a clinical score to diagnose viral sore Acute rheumatic fever and exposure to poor housing conditions
throat. Fam Pract. 2015;32:263–8. https://doi.org/10.1093/ in New Zealand: a descriptive study. J Paediatr Child Health.
fampra/cmv015 2017;53:358–64. https://doi.org/10.1111/jpc.13421
28. McIsaac WJ, Kellner JD, Aufricht P, Vanjaka A, Low DE. 40. Baker MG, Gurney J, Oliver J, Moreland NJ, Williamson
Empirical validation of guidelines for the management of DA, Pierse N, et al. Risk factors for acute rheumatic fever:
pharyngitis in children and adults. [Erratum s in: JAMA. literature review and protocol for a case-control study in
2005;294:2700]. JAMA. 2004;291:1587–95. https://doi.org/ New Zealand. Int J Environ Res Public Health. 2019;16:4515.
10.1001/jama.291.13.1587 https://doi.org/10.3390/ijerph16224515
29. Gurney J. The incidence of acute rheumatic fever in New 41. Raynes JM, Frost HR, Williamson DA, Young PG, Baker EN,
Zealand, 2010–2013. N Z Med J. 2015;128:65–7. Steemson JD, et al. Serological evidence of immune priming
30. Jaine R, Baker M, Venugopal K. Epidemiology of acute by group A streptococci in patients with acute rheumatic
rheumatic fever in New Zealand 1996–2005. J Paediatr fever. Front Microbiol. 2016;7:1119. https://doi.org/10.3389/
Child Health. 2008;44:564–71. https://doi.org/10.1111/ fmicb.2016.01119
j.1440-1754.2008.01384.x
31. Baker MG, Barnard LT, Kvalsvig A, Verrall A, Zhang J, Address for correspondence: Jane Oliver, 792 Elizabeth St,
Keall M, et al. Increasing incidence of serious Melbourne 3000, Victoria, Australia; email: jane.oliver@
infectious diseases and inequalities in New Zealand: a unimelb.edu.au
Emerging Infectious Diseases • www.cdc.gov/eid • Vol. 26, No. 6, June 2020 1121Article DOI: https://doi.org/10.3201/eid2606.181462
Distribution of Streptococcal Pharyngitis
and Acute Rheumatic Fever, Auckland, New
Zealand, 2010–2016
Appendix
Appendix Table 1. Throat swabs and GAS detection by year and source, Auckland, total population, 2010–2016
Swabs collected
Swab rate (per GAS+ve swab Prevalence of
Denominator No. swabs 1,000 person- No. GAS+ve rate (per 1,000 GAS positive
Source Year population per year years) swabs per year person-years) swabs (%)
PHC and 2010 1314698.6 38145 29.0 5842 4.4 15.3
School 2011 1329943.7 51614 38.8 7969 6.0 15.4
2012 1345188.9 61256 45.5 8580 6.4 14.0
2013 1360434.0 167776 123.3 24009 17.6 14.3
2014 1375679.1 304147 221.1 32521 23.6 10.7
2015 1390924.3 324863 233.6 37853 27.2 11.7
2016 1406143.7 309257 219.9 46760 33.3 15.1
2010–2016* 1360434.0 179579.7 132.0 23362.0 17.2 13.0
1
2010–2012 1329943.7 50338.3 37.8 7463.7 5.6 14.8
2014–2016* 1390924.3 312755.7 224.9 39044.7 28.1 12.5
PHC 2010 1314698.6 38145 29.0 5842 4.4 15.3
2011 1329943.7 49993 37.6 7814 5.9 15.6
2012 1345188.9 54220 40.3 7920 5.9 14.6
2013 1360434.0 82266 60.5 12565 9.2 15.3
2014 1375679.1 124248 90.3 16227 11.8 13.1
2015 1390924.3 159242 114.5 22179 15.9 13.9
2016 1406143.7 155903 110.9 27158 19.3 17.4
2010–2016* 1360434.0 94859.6 69.7 14243.6 10.5 15.0
2010–2012* 1329943.7 47452.7 35.7 7192.0 5.4 15.2
2014–2016* 1390924.3 146464.3 105.3 21854.7 15.7 14.9
School 2010 1314698.6 0 0.0 - - -
2011 1329943.7 1621 1.2 155 0.1 9.6
2012 1345188.9 7036 5.2 660 0.5 9.4
2013 1360434.0 85510 62.9 11444 8.4 13.4
2014 1375679.1 179899 130.8 16294 11.8 9.1
2015 1390924.3 165621 119.1 15674 11.3 9.5
2016 1406143.7 153354 109.1 19602 13.9 12.8
2010–2016* 1360434.0 84720.1 62.3 10638.2 7.8 12.6
2010–2012* 1329943.7 2885.7 2.2 217.6 0.2 7.5
2014–2016* 1390924.3 166291.3 119.6 17190.0 12.4 10.3
*Mean annual average.
Page 1 of 3Appendix Table 2. Mean annual PHC throat swabs and GAS detection by age group, Auckland, 2014-2016
Swabs collected Individuals swabbed (≥1 swabs/year)
GAS Individuals Individuals Proportion
Swabs/ swabs/1,0 swabbed/ with of
1,000 GAS 00 Proportion 1,000 Individuals GAS/1,000 individuals
Age person- swabs person- of GAS Incident person- with GAS person- with GAS
group Swabs (N) years (N) years swabs (%) swabs (N) years (N) years (%)
69 1349.7 12.2 23.3 0.2 1.7 1204.7 10.9 22.3 0.2 1.9
Total 146464.3 105.3 21854.7 15.7 14.9 97513.0 70.1 18348.0 13.2 18.8
Page 2 of 3Appendix Table 3. Mean annual PHC throat swabs and GAS detection, Auckland, 5-14 year old children, 2014-2016
Swabs collected Children swabbed (≥1 swabs/year)
GAS swabs per Proportion of Children Children with Proportion of
Swabs/1,000 GAS swabs 1,000 GAS swabs Incident swabbed/1,000 Children with GAS/1,000 children with
Characteristic Swabs (N) population (N) population (%) swabs (N) population GAS (N) population GAS (%)
Gender
Male 27737.3 287.7 6101.3 63.3 22.0 15500.0 160.8 4816.3 50.0 31.1
Female 30056.7 328.2 5720.7 62.5 19.0 16048.7 175.2 4484.0 49.0 27.9
Unknown 1.3 0.0 0.7 - 53.8 1.3 0.0 0.7 0.0 53.8
Prioritised ethnicity
Māori 12170.7 393.1 2445.0 79.0 20.1 6181.7 199.6 1931.0 61.8 30.9
Pacific 17103.3 480.5 3546.7 99.6 20.7 8605.7 241.8 2783.0 78.2 32.3
Asian 7208.3 194.4 1083.3 29.2 15.0 4400.0 118.7 900.3 24.3 20.5
Other 21313.0 261.5 4747.7 58.3 22.3 12362.7 151.7 3704.7 45.5 30.0
NZDep Quintile
1 (Low deprivation) 9089.0 207.6 1904.7 43.5 21.0 5425.0 123.9 1500.7 34.3 27.7
2 7509.0 195.6 1505.0 39.2 20.0 4541.3 118.3 1206.3 31.4 26.6
3 7171.0 233.5 1535.0 50.5 21.4 4631.3 150.8 1258.3 41.0 27.2
4 10202.0 377.9 2223.7 82.4 21.8 5780.7 214.1 1762.7 65.3 30.5
5 (High deprivation) 23800.3 527.7 4648.7 103.1 19.5 12065.3 267.5 3663.7 81.2 30.4
Missing 23.7 165.6 5.7 39.8 24.1 14.3 100.1 5.7 39.6 39.9
Season
Summer 29086.7 154.7 7386.7 39.3 26.9 25554.7 135.9 6884.0 36.6 26.9
Autumn 47414.7 252.2 11714.7 62.3 27.6 38925.3 207.1 10729.3 57.1 27.6
Winter 90288.0 480.3 16517.3 87.9 21.8 68102.7 362.3 14836.0 78.9 21.8
Spring 64392.0 342.6 11672.0 62.1 20.6 51645.3 274.7 10626.7 56.5 20.6
DHB
WDHB 16481.7 245.7 3650.7 54.4 22.2 9441.0 140.8 2859.7 42.6 30.3
ADHB 12699.3 262.8 2653.0 54.9 20.9 7186.3 148.7 2099.3 43.5 29.2
CMDHV 26313.3 377.2 5030.7 72.1 19.1 13485.3 193.3 3937.0 56.4 29.2
Other 2301.0 - 488.3 - 21.2 1437.3 - 405.0 - 28.2
Mean annual total 57795.3 307.5 11822.7 62.8 20.5 31550.0 167.8 9301.0 49.5 29.5
Page 3 of 3You can also read