Changing patterns of financial intermediation: Implications for central bank policy - Bis
←
→
Page content transcription
If your browser does not render page correctly, please read the page content below

Changing patterns of financial intermediation:
Implications for central bank policy

South African Reserve Bank

Abstract

South Africa has attracted substantial inflows of foreign capital since the 2008
global financial crisis, but this has not coincided with or resulted in major changes in
financial intermediation – including in the shadow banking sector. Instead, debt
growth has been concentrated in the public sector: the government debt ratio has
nearly doubled since the crisis albeit at relatively low levels, with a threefold increase
in non-resident holding of rand-denominated government bonds, contributing to
the financing of widening fiscal and current account deficits. Private sector credit
growth, by contrast, has stagnated amid stricter bank lending criteria and balance
sheet consolidation by households. Although the shadow banking system has
expanded, this increase has come at the expense of the banks, and remains
relatively small. South Africa’s vulnerability to global monetary shocks has been
reflected primarily in the widening of the twin deficits. The more recent monetary
policy response has been a gradual tightening cycle, complemented by fiscal
consolidation.
Key words: financial crisis, banking, financial markets, international financial markets
JEL classification: G01, G21, G10, G15

BIS Papers No 83                                                                       347
For South Africa, the problems posed in the outline for this meeting ring half true.
South Africa is indeed exposed to global monetary shocks. It has attracted
significant amounts of foreign capital in the period since the 2008 global financial
crisis and has seen those flows abate as policymakers in the United States shift
towards monetary policy tightening. Domestic monetary policy has been adjusted in
response to the depreciating currency and its pass-through effects, and consistent
with the country’s flexible inflation target framework. Yet, this experience was not
shaped by changes in financial intermediation. It is, therefore, necessary to consider
developments in foreign financing separately from financial intermediation.
     Foreign financing: Before the crisis, South Africa had already developed a
sophisticated financial system. Financial inflows from abroad typically entered South
Africa as portfolio flows into the Johannesburg Stock Exchange, where they financed
large corporates. By contrast, small and medium enterprises tended to rely on
domestic banks. The biggest change, since the crisis, has been that the state has
become a larger borrower. These debt instruments have proven popular with
foreign investors, but most of these purchases have been made on domestic
markets, meaning that the debt is foreign-held but rand-denominated. Non-
resident investors’ holdings of rand-denominated debt and equity have increased
from about 10% and 17% in 2005 to 36% and 22% in 2014, respectively.
     Financial intermediation: The overall pattern of credit growth in South Africa
has contradicted that seen in many other emerging markets (although it matches
that of many advanced economies). Before the 2008 crisis, there was a large
increase in private sector credit extension driven by mortgage lending, which in turn
pushed up house prices. The state, by contrast, enjoyed buoyant revenues which
permitted it to post small fiscal surpluses. Following the crisis, fiscal policy switched
to running deficits, of about 5% of GDP. Private sector credit growth, by contrast,
stagnated as banks raised lending standards and overstretched households
consolidated their balance sheets. South Africa’s shadow banking system expanded,
growing from approximately 13% of financial assets of all financial intermediaries to
18% by the end of 2014. However, this is still a relatively small part of the financial
system. Furthermore, more than half of the shadow banking system is made up of
money market funds, which are regulated and therefore not markedly “shadowy”.
     South Africa is therefore exposed to global monetary shocks, but in old and
familiar ways. As before the crisis, it has attracted capital inflows into a deep and
liquid stock market. To this it has added significant sovereign borrowing. Its
fragilities are large current account and fiscal deficits. These are significant
vulnerabilities but they are not new or unfamiliar threats.

348                                                                        BIS Papers No 83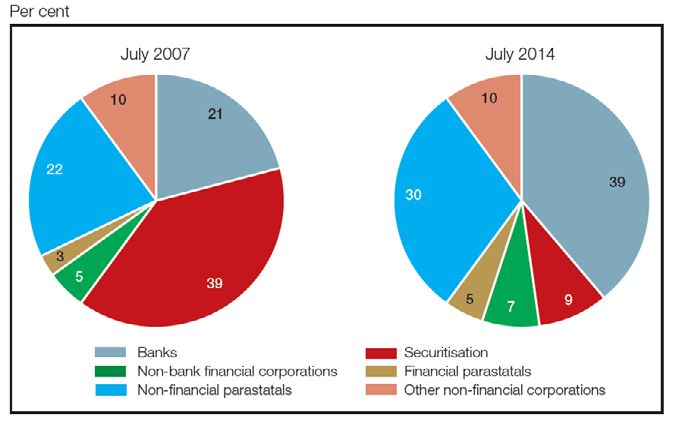
A. The role of banks

                 (1.) How did the relative importance of banks and market-based financing
                      change in EMEs over the past decade?
                 Banks have continued to dominate financing in South Africa over the past decade.
                 There has been quite strong growth in the share of financing from non-bank
                 financial intermediaries, albeit from a low base.
                      The share of banks’ total assets relative to all financial intermediaries has been
                 declining since 2008 and reached 31% in 2013 (see Graph 1). However, banks,
                 insurers and pension funds still account for the largest share of total financial assets.
                 Assets of other financial intermediaries, a proxy for the shadow banking system,
                 continued to increase and reached 24% of total financial assets of financial
                 intermediaries in 2013.

Distribution of total assets between financial intermediaries in South Africa                     Graph 1

                      Non-bank financial institutions (NBFIs) play an important role in the financial
                 system. They complement the commercial banking sector by addressing needs on
                 which banks do not normally focus. Most NBFIs are actively involved in the
                 securities markets and in the mobilisation and allocation of long-term financial
                 resources. Examining the sources of credit extended, it would appear that credit
                 extended by NBFIs continued to grow but remains relatively small in size, relative to
                 total bank lending (see Graph 2).

                 BIS Papers No 83                                                                      349
Credit extension by banks and non bank financial intermediaries Graph 2
(2.) How has the composition of assets and liabilities of domestic banks
changed? What does this imply for the liquidity, maturity and credit risks
banks face, as well as their credit extension decisions (pricing, etc.)? In
particular, what is the structure of their lending (eg (i) households vs
corporates; (ii) fixed vs variable rate; (iii) collateral practices; (iv) domestic
vs foreign currency) and how has it changed? How has the degree of
competition evolved? And what has been the role of
government-owned banks/financial intermediaries?
Composition of liabilities
Since 2008, domestic banks have reduced reliance on domestic currency deposits
and increased funding from subordinated debt securities and foreign currency
deposits and funding (see Graph 3). These changes have been made gradually since
2008 (see Table 1). However, foreign currency deposits and funding continue
constitute less than 10% of total liabilities (see Graph 9).
350 BIS Papers No 83Year on year movement in domestic banks’ liabilities (excluding derivative
financial instruments) Table 1
Nov-08 Nov-09 Nov-10 Nov-11 Nov-12 Nov-13 Nov-14
% % % % % % %
Collateralised borrowing - - - 0.00 0.00 0.00 0.02
Deposits denominated in FX 3.55 2.20 2.29 2.68 2.71 3.04 3.85
Deposits denominated in ZAR 82.00 84.01 84.40 82.96 79.92 80.97 78.66
FX funding 2.27 2.48 2.22 2.78 3.20 3.11 4.07
Other borrowed funds 0.45 0.74 0.67 0.65 0.67 0.69 0.78
Other liabilities 2.55 1.93 2.33 2.24 2.83 2.41 2.74
Other trading liabilities 1.79 0.81 0.57 0.53 0.64 0.53 0.60
Repos 4.79 4.53 3.68 4.04 3.71 2.91 2.98
Sub debt securities 2.61 3.29 3.83 4.12 6.32 6.32 6.31
Total 100.00 100.00 100.00 100.00 100.00 100.00 100.00
Composition of South African banks liabilities Graph 3
R billions
4,000
3,500
3,000
2,500
2,000
1,500
1,000
500
0
Collateralised borrowing Deposits denominated in FX
Deposits denominated in ZAR FX funding
Other borrowed funds Other liabilities
Other trading liabilities Repos
Sub debt securities
The maturity structure of domestic banks’ liabilities indicates that there has
been increasing reliance on short-term liabilities (with a maturity of up to one
month) and less reliance on longer-term (more than six months) (see Table 2 and
Graph 4).
BIS Papers No 83 351Term structure of domestic bank liabilities Table 2
Nov-08 Nov-09 Nov-10 Nov-11 Nov-12 Nov-13 Nov-14
% % % % % % %
Short term 53.26 51.61 53.48 54.29 53.59 55.51 58.39
Medium term 19.27 19.72 18.76 17.55 17.32 17.96 15.99
Long term 27.46 28.66 27.76 28.16 29.09 26.53 25.62
Total 100.00 100.00 100.00 100.00 100.00 100.00 100.00
Term structure of the South African banking sector’s liabilities Graph 4
R biillions
4,500
4,000
3,500
3,000
2,500
2,000
1,500
1,000
500
0
Sum of Short term Sum of Medium term Sum of Long term
Composition of assets
The composition of South African banks’ sector assets has changed marginally since
2008, with increases in gross loans and advances and decreases in investment and
trading assets (see Table 3 and Graph 5).
Composition of South African banking sector assets Table 3
Nov-08 Nov-09 Nov-10 Nov-11 Nov-12 Oct-13 Nov-14
% % % % % % %
Cash 2 2 2 2 3 3 3
Gross loans and advances 74 78 77 75 77 79 79
Investments and trading assets 24 20 20 22 20 18 19
Total 100 100 100 100 100 100 100
352 BIS Papers No 83Composition of South African banking sector assets Graph 5
R billions
4,500
4,000
3,500
3,000
2,500
2,000
1,500
1,000
500
0
Jan-08 Jul-08 Jan-09 Jul-09 Jan-10 Jul-10 Jan-11 Jul-11 Jan-12 Jul-12 Jan-13 Jul-13 Jan-14 Jul-14
Gross loans and advances Investments and trading assets Cash
Since 2008, increases in gross loans and advances have been driven largely by
increases in the other loans and advances category (which consists mainly of term
loans. The category increased by ZAR 472 billion, of which ZAR 237 billion was to
non-financial corporates and ZAR 138 billion was to households) and mortgages
(mortgages to households have increased by ZAR 281 billion since 2008, largely to
households and non-financial corporates) (see Graph 6). Unsecured retail lending
(largely personal term loans) has shown significant amount of growth since 2008,
but the strong growth trend has tempered since 2013 (see Graph 7).
Composition of gross loans and advances Graph 6
R billions
3,500
3,000
2,500
2,000
1,500
1,000
500
0
Jan-08 Jul-08 Jan-09 Jul-09 Jan-10 Jul-10 Jan-11 Jul-11 Jan-12 Jul-12 Jan-13 Jul-13 Jan-14 Jul-14
Credit cards Lease and instalment sales Mortgages Overdrafts
FX loans and advances Pref shares Repos Interbank loans in ZAR
Interbank loans in FX Other loans and advances
BIS Papers No 83 353Gross unsecured retail credit exposure of the South African banking sector Graph 7
R billions Per cent
600 50
45
500
40
35
400
30
300 25
20
200
15
10
100
5
0 0
Jan Mar May Jul Sep Nov Jan Mar May Jul Sep Nov Jan Mar May Jul Sep Nov Jan Mar May Jul Sep Nov
11 12 13 14
Retail revolving credit SME retail
Retail other (> R30 000) Retail other (significantly since 2008 (in the year to 30 November 2008, on average, 88% of
lending in mortgages, leasing and financing transactions was flexible rate. In the
year to 30 November 2014, on average, 87% of lending in mortgages, leasing and
financing transactions was flexible rate.)
The South African banking sector has steadily increased the amount of foreign
currency lending since 2011 from a relatively low base. Foreign currency loans and
advances to total assets have been increasing from a low of 3.85% in March 2011 to
7.47% in November 2014 (see Graph 9).
Foreign currency deposits and funding to total liabilities and foreign currency
loans and advances to total assets Graph 9
In the South African banking sector, the five largest banks dominate the sector
(as measured by asset size, the five largest banks have held, on average,
approximately 90% of banking sector assets since 2008). The sector has seen
increasing competition from smaller banks in niche areas, such as unsecured retail
lending, but this has not made significant changes to the composition of the total
sector in terms of asset size.
The role of government-owned financial institutions has, to a large extent, been
focused on development finance and financial inclusion. Their activities are
mandated by the legislation supporting those entities (most government financial
institutions have their own legislation which mandates the objectives and purpose
of the institution (they fall outside the scope of the Banks Act, 1990). Examples of
government financial institutions include the Land Bank (which is focused on the
agricultural sector), the Development Bank of Southern Africa (to promote regional
economic development), the Industrial Development Corporation of South Africa (a
development finance institution) and the Post Office Savings Bank (a retail bank).
Note: the responses to this questionnaire are based on entities registered in terms
of the Banks Act, 1990.
BIS Papers No 83 355(3.) How have international banks’ business models (eg centralised vs
subsidiary) evolved since the 2008 financial crisis? Does the nature of a
bank’s business model influence the supply of credit during periods of
adverse external shocks?
The South African banking sector did not experience significant instability following
the 2008 financial crisis. The major impact on the South African banking sector was
largely due to indirect effects (for example, lower exports due to lower demand
from European customers). South African banking groups have been focusing on
expanding their activities onto the African continent (that is, expanding into Africa
other than South Africa). The business models adopted for this expansion strategy
differ between banking groups. The three most commonly followed strategies were
to acquire existing in-country operations, to establish greenfield operations (usually
subsidiaries) or to purchase minority stakes in existing African banking groups.
The nature of DSIB’s business models have changed since the 2008 financial
crisis from both a geographical and an asset class perspective. For example, certain
banking groups have restructured their international operations by selling
operations outside Africa and increasing their focus on African operations. There
has also been a change in product mix, such that the growth in mortgages
moderated following the crisis in 2008 and there has been increasing growth in
unsecured retail exposures (see Graph 7 above). However, the aggregate level of
gross loans and advances of the banking sector was not significantly influenced by
any movements or changes in the supply of credit from branches of foreign banks
operating in South Africa during the 2008 financial crisis (compared with, for
example, the case in some developed market economies).
Note: No South African banking groups have been classified as Globally
Systemically Important Banking institutions (G-SIBS). The response to the question
on “international banks” is based on the Domestic Systemically Important Banking
Institutions (DSIBs) that have banking operations outside the Republic of South
Africa.
B. The role of debt securities markets
(4.) What is the structure of the debt held in the form of securities, both
sovereign and corporate (size, maturity, fixed/flexible rate, collateral and
currency) and how has it evolved?
Government is still by far the largest borrower in the domestic market, despite rising
private sector issuance. National government’s domestic debt has increased
significantly since the global crisis, with a shift to Treasury bills and longer-term
fixed interest bonds. National government’s domestic debt increased 3.3 times in
nominal terms, from ZAR 432 billion in 2005 to ZAR 1.4 trillion in 2014, of which
almost 99% is on average marketable. Of the marketable portion, Treasury bills
almost doubled between 2005 and 2014, reaching 14% of the total, while bonds
decreased by 6 percentage points to 86% in 2014. From 2005 to 2014, the maturity
composition of bonds changed with short-term bonds decreasing from 23% to 9%
whilst long-term bonds increased to 91%. The average maturity of domestic bonds
(mostly fixed interest) increased from 99 months in 2005 to 154 months in 2014.
356 BIS Papers No 83National government’s debt profile continues to be dominated by domestic
rand-denominated debt. Rand-denominated domestic private sector debt (mostly
flexible rate) in issue increased from ZAR 137 billion in 2005 to ZAR 450 billion in
2014. Foreign debt, meanwhile, has increased from ZAR 39 billion in 2005 to ZAR
144 billion in 2014. Over the same period, the average maturity of foreign currency-
denominated bonds increased from 78 months to 95 months. The currency
composition of this debt shifted in favour of dollars, rising from 44% of the total to
79%. Euro exposure declined sharply in 2014.
The domestic marketable debt of non-financial public enterprises increased by
ZAR 141 billion from 2005 to ZAR 207 billion in 2014. Over the medium term,
funding of state-owned companies will be contingent on restructuring with
capitalisation funded from the sale of non-strategic state assets and not added to
national government debt.
How has the relative importance of domestic and international debt
issuance changed?
Government and private sector issuers favour domestic rand-denominated
issuance. In the second quarter of 2014, South Africa’s total foreign currency debt
denominated in US dollars amounted to US$62 billion (of which 28% matures in
2020 and beyond), whereas rand-denominated debt amounted to ZAR 844 billion
or US$80 billion. As a portion of total foreign debt, foreign currency-denominated
debt decreased from 58% in 2005 to 44% in 2014.
South Africa’s net worth (the net of foreign liabilities and assets) improved
significantly, with net liabilities declining from ZAR 346 billion in 2005 to ZAR
153 billion in 2013.
(5.) In addition, a major development over the past five years has been the
shift of borrowing by EME non-bank corporations away from banks to
international debt markets. What are the implications of this for the
financing of firms?
Recent BIS research has emphasised a new risk to global financial stability. EME
corporates have exploited loose financial conditions in developed economies to
issue offshore debt. This is used to finance real or financial investments, either
domestically or in third countries.1 The danger is that this creates large and perhaps
invisible vulnerabilities to changes in advanced country monetary policies. South
Africa, as an open economy with a relatively large number of multinational
corporations, would be a likely candidate for this sort of exposure. The evidence,
however, is mixed.
BIS research identifies three channels through which funds from offshore
borrowing may flow into the local economy: (1) loans from a foreign subsidiary to
the domestic parent, classified as debt FDI; (2) inter-company loans, classified as
trade finance; or (3) deposits with a domestic bank (which would then appear, in the
balance of payments, in “other investments – banking sector”). Analysis of South
1
See, for instance S Avdjiev, M Chui and H S Shin, “Non-financial corporations from emerging
market economies and capital flows”, BIS Quarterly Review, December 2014, or M Chui, I Fender
and V Sushko, “Risks related to EME corporate balance sheets: the role of leverage and currency
mismatch”, BIS Quarterly Review, September 2014)
BIS Papers No 83 357Africa’s balance of payments and foreign liabilities suggests that most of the
increase in foreign borrowing came through channel (1). “Debt FDI” liabilities for the
private non-banking sector have more than doubled over the 2008–13 period (see
Graph 1), rising to about a third of the non-financial corporate sector’s gross
operating surplus. Flow data, for the first three quarters of 2014, show the incurring
of debt FDI liabilities worth ZAR 44 billion. Importantly, though, most of that “debt
FDI” appears to reflect loans from foreign-based multinationals to their South
African subsidiaries, rather than capital raising by South Africa-based firms through
their foreign subsidiaries.
Debt FDI liabilities of the private non banking sector, 2000-13 Graph 10
300.0 40.0
35.0
250.0
30.0
200.0
25.0
150.0 20.0
15.0
100.0
10.0
50.0
5.0
0.0 0.0
2000 2002 2004 2006 2008 2010 2012
In billions of Rand (left) As pct of gross operating surplus (right)
Liabilities classified as “short-term loans and trade finance” have also increased
in recent years – from ZAR 25 billion in 2010 to ZAR 55 billion in 2012 and ZAR
82 billion by end-2013, although flow data suggest this reflects in part valuation
effects. These liabilities, however, remain small relative to debt FDI liabilities. The
same observation applies to external liabilities in the form of bank deposits. While
they rose to R103 billion by end-2013, from as low as ZAR 63 billion in 2010, their
level has fluctuated over the years and remains similar to that seen at the end of
2008.
358 BIS Papers No 83Change in private credit as a share of GDP in 2008–13 Graph 11
50.0
40.0
30.0
20.0
10.0
0.0
-10.0
-20.0
-30.0
Higher private sector foreign debt has not fed into domestic credit creation or
property price growth – contrary to what has been observed in some other EMEs –
nor has it triggered a pickup in real gross fixed capital formation (GFCF) by the
private sector. In fact, South Africa is one of only a few large EMEs where private
credit has fallen as a share of GDP between 2008 and 2013 (see Graph 2). Equally,
the ratio of GFCF to GDP remains well below pre-crisis levels, unlike in most Asian
economies.
The fact that external debt financing is picking up from low levels, as well as the
traditional reliance on equity (as opposed to debt) financing by South Africa’s large
corporations, probably explains why the trends described above have not had
significant macro implications. In addition, South African corporates probably
exploited cheaper foreign funding to finance investments abroad. Balance of
payments data show that net outward FDI has increased significantly in recent years
(ZAR 24.5 billion in 2012, ZAR 65.2 billion in 2013 and ZAR 65.9 billion in January–
September 2014). As of end-2014, the stock of the non-financial corporate sector’s
FDI assets amounted to as much as 92% of its FDI liabilities, a much higher ratio
than in earlier years.
(6.) What would be the impact on bank and non-bank corporations’ balance
sheets of a potential tightening of global financial conditions?
In an environment of greater cross-border exposure, tighter global financial
conditions could damage corporates in several ways. Firms may find it more difficult
and costly to refinance external debt. They may suffer valuation losses on their
financial assets. Finally, FX asset-liability mismatches could affect their solvency. In
South Africa, the banking sector’s vulnerability is limited by: (1) the relatively low
level of FX assets and liabilities; (2) the fact that they are reasonably well matched;
and (3) the relatively low share of fixed income securities in their total assets.
While the FX deposit share of total bank deposits shifts in response to
exchange rate fluctuations, it has never been higher than 6% over the past decade
BIS Papers No 83 359(see Graph 3). In addition to FX deposits (ZAR 139 billion as of September 2014),
South African banks received other foreign currency funding to the tune of ZAR
133 billion, representing altogether 6.6% of total liabilities. On the asset side,
however, FX loans and advances totalled ZAR 314 billion, with an additional ZAR
163 billion of separate foreign investments. Hence, the South African banking
sector’s net external position is positive, meaning that the balance sheet should
strengthen marginally in the event of rand depreciation – the latter being the likely
consequence of a tightening in global financial conditions.
FX deposits with South African banks as share of total deposits and USD-ZAR
exchange rate, 1992–Jun 2014 Graph 12
per cent
7.0 14.0
6.0 12.0
5.0
10.0
4.0
8.0
3.0
6.0
2.0
1.0 4.0
0.0 2.0
Jan-92 Jan-95 Jan-98 Jan-01 Jan-04 Jan-07 Jan-10 Jan-13
Ratio of FX deposits USD-ZAR
At the same time, South African banks do not have a high level of exposure to
fixed income securities, which limits interest rate risk. Non-share financial
investments, as of September 2014, amounted to ZAR 707 billion, or 17% of banks’
balance sheets, the bulk of which consists of government bonds and Treasury bills,
as well as derivative instruments issued by other South African banks. Banks would
likely suffer some mark-to-market capital losses on their bond portfolios if global
yields rise, particularly if domestic and US bond yields remain tightly correlated.
Otherwise, South African banks benefit from very low exposure to higher-risk
corporate bonds or asset-backed securities.
Corporate deposits with local banks remain elevated (see question 7), although
these elevated cash holdings probably reflect domestic constraints on investment
rather than a carry trade between cheap external funding and higher domestic
interest rates. As for the risk of currency mismatches, the risk of higher FX debt
servicing costs in the event of ZAR depreciation and higher global risk aversion is
mitigated, in the case of commodity producers and manufactured goods exporters,
by the FX denomination of most of their earnings.2 At the same time, the relatively
2
Indeed, Chui et al (2014) listed South Africa, together with Brazil, Mexico and Russia, as countries
where the vulnerability of corporates should be reduced.
360 BIS Papers No 83close match between FDI assets and the liabilities of the non-bank corporate sector
(see question 5) is also a reassuring factor, even if some of these FDI assets are not
in hard currencies (about 17%, for example, are in the rest of Africa).
(7.) What is the share of corporate deposits in total bank deposits? To what
extent has it been affected by international debt issuance by
non-financial corporations? What other interactions between banks and
non-bank corporations’ balance sheets are likely to be important from
the viewpoint of monetary and financial stability?
Corporate deposits
As a percentage of total bank deposits, corporate deposits remained in a fairly
narrow range. Adjustments made by one of the big banks in October 2010 to their
classification of deposits elevated the level somewhat, but overall, prior to the
global financial crisis and post the global crisis, the composition of total deposits
remained fairly stable. According to the latest data available (October 2014),
corporate deposits remained the largest component of banking sector deposits,
accounting for 44.4% of total deposits.
Corporate deposits as percentage of total deposits Graph 13
While growth in credit extended to corporates (by banks) has remained
relatively constant (see Graph 2), the growth in bonds and commercial paper has
increased rapidly in 2011 and 2012. Following this, however, the growth in the
BIS Papers No 83 361corporate bond market3 lost momentum in 2013 and 2014, with the nominal
amount in issue increasing by only 9% in 2013, compared to 19% in 2012.
Bank loans and advances to companies compared to bond issuance and
deposit growth Graph 14
Excluding government bonds. Source: South African Reserve Bank, Annual Economic Report, 2013, p 66, JSE Limited
In 2014, lacklustre investor appetite and dwindling issuances were evident from
August following the African Bank curatorship and bank credit rating downgrades.
Some companies withdrew bond issuances in the wake of the above as borrowing
costs were driven higher. Net issuances by the private sector of ZAR 12 billion in the
first ten months of 2014 therefore fell short of the net issues of ZAR 20 billion
recorded over the same period in 2014.4
3
South African Reserve Bank, Quarterly Bulletin, September 2014.
4
South African Reserve Bank, Quarterly Bulletin, December 2014.
362 BIS Papers No 83Net issuances of bonds and commercial paper by issuer Table 4
Non-bank private companies in particular reduced their net issuances of bonds
and continued with net redemptions of commercial paper, while funding through
the issuance of securitised instruments also remained out of favour in 2014.
The banking sector, on the other hand, recorded higher net issuances,
amounting to ZAR 21 billion in the first 10 months of 2014.
This trend is reflected in Graph 3, where by showing the share of amounts
issued by type, it can be seen that in July 2014 banks accounted for almost 40% of
the amount in issue in the corporate bond market, whereas seven years ago, prior
to the financial crisis, securitisation issuances dominated with almost 40% of the
amount in issue.
Corporate bond market amounts in issue by issuer type Graph 15
Source: South African Reserve Bank, Quarterly Bulletin, September 2014.
BIS Papers No 83 363International bond issuances
While corporate deposits as a share of total deposits remained more or less
constant, and net bond issuances by the private sector slowed in the first 10 months
of 2014 compared with 2013, offshore issuances of rand-denominated debt in the
European bond markets grew rapidly in 2014. For investors, the attraction of
Eurorand debt has been the combination of high yields and highly rated issuers.
Investors have, therefore, been able to earn rand interest rates, but at lower
perceived credit risk than if they had invested directly in South Africa. Eurorand debt
has been extremely popular with retail investors who have been willing to accept
rand exchange rate risk but preferred the lower credit risk of an investment-grade
issuer. The attraction of the Eurorand market for issuers has been the low cost of
funding. Interest in rand-denominated bonds in the Japanese uridashi bond market,
however, continued to be subdued in 2014, with more redemptions than issues. As
a result, the net issues in the Eurorand market were the key driver of the overall net
issues of almost ZAR 21 billion in the first 10 months of 2014 across both markets,
as shown in Table 2.
Rand-denominated bonds issued in international bond markets, January to
October Table 5
There are several interactions on banks’ and non-bank corporations that are
likely to be important from the viewpoint of monetary and financial stability. Firstly,
banks extend credit to corporates (see Graph 4). If the cost of this funding changes,
it could result in corporates moving to the bond market for funding, or even to
other non-bank financial intermediaries. The cost of bank funding appears to have
increased recently5 as a result of changed regulatory requirements relating to the
implementation of Basel III, the impact of the bail-in of certain African Bank Limited
creditors and the consequent rating action by Moody’s Investors Service, all of
which could result in tighter funding conditions. Therefore the cost of increased
regulations and the effects it could have on credit demand should be taken into
account.
5
South African Reserve Bank, Quarterly Bulletin, December 2014.
364 BIS Papers No 83Credit to corporates Graph 16
20
15
10
5
0
-5
-10
Credit to corporates
Also, even though banks hold almost 40% of the amount of bonds in issue in
the corporate bond market, the share of non-bank financial corporations has also
increased marginally over the past seven years. It should be taken into account that
there are most likely overlaps in the holders of bank and non-bank financial bonds.
Hence bank and non-bank corporations share common investors, in addition to
investing in each other.
C. Implications for monetary policy
(8.) How have recent changes in financial intermediation affected the
transmission mechanisms of monetary policy in EMEs (eg size and speed
of pass-through of changes in policy rates, responsiveness of overall
credit conditions and asset prices, impact on debt service ratios and
through these, on the macroeconomy)?
Conventional wisdom holds that changes in monetary policy are transmitted more
slowly in countries with greater bank intermediation than in those with high market
intermediation. This reflects the fact that banks typically absorb part of the initial
tightening in monetary policy via their margins, especially if (as is normally the case
at the start of a tightening cycle) business conditions are buoyant and bank
profitability is good. Equally, they may delay the pass-through of rate cuts if they
feel the need to rebuild margins. By contrast, a market-based financing system can
actually amplify a monetary policy decision, for instance if a rate hike not only is
reflected through the whole yield curve but also results in wider corporate and
mortgage bond spreads to governments, as well as weaker equities. The “taper
BIS Papers No 83 365tantrum” of 2013 was a case in point. A financial system that shifts towards market
intermediation should therefore become more skittish (or, as proponents might
contend, nimble).
South Africa’s financial system is a hybrid one in that banks provide most
financing to households and small to medium enterprises (SMEs), whilst large
companies mostly use equity markets. This system has not changed radically since
the crisis. The private corporate bond market is growing, but it remains relatively
small and banks still account for the bulk of outstanding issues. The non-bank
financial sector has grown significantly over the past decade, but the bulk of its
assets are in the hands of pension funds and life insurance companies, which are
important buyers of government and state-owned enterprise (SOE) bonds, as well
as equities, but play a more limited role in the financing of the rest of the economy.
The shadow banking system, defined as all non-bank financial intermediaries other
than insurance companies, pension funds and public financial institutions, now
accounts for about 18% of financial intermediation, up from 13% before the crisis.
Since the 2008–09 recession, non-residents have been significant investors in
local bond and equity markets. This has transmitted super-loose monetary policies
to the domestic economy and should therefore also convey tightening. These
developments primarily affect the bigger players: government, SOEs and large
corporations. The rest of the economy should be affected more indirectly.
(9.) How [have recent changes in financial intermediation] changed the
sensitivity [of monetary policy] to global monetary and financial
conditions?
South African financial conditions have been strongly affected by global conditions
since the 2008 crisis. For instance, the correlation between the yield on South
African 10-year government bonds and US 10-year Treasuries jumped from 0.22
before the collapse of Lehmann Brothers to 0.84 afterwards. South Africa has also
been one of the EMEs most exposed to changes in global conditions, as has been
clear at least since the May 2013 “taper tantrum”. But the reasons for this seem to
have relatively little to do with financial intermediation. The causes are more likely
the old-fashioned vulnerabilities of large twin deficits.
In all the countries rocked by the “taper tantrum”, monetary policy has been
tightened, although the responses varied in their pace and timing. In South Africa,
the policy rate was raised by 50 basis points in January 2014 and by an additional
25 basis points in July 2014, despite a subdued outlook for economic growth.
(10.) How should monetary policy adapt to the changes in financial
intermediation? For instance, to what extent should it react to sharp
changes in risk premium in EME debt markets (through interest rate
and/or balance sheet measures) and respond to broader vulnerabilities?
As the previous answer makes clear, for South African monetary policy, the
traditional vulnerabilities – especially the twin deficits – are more significant than
new risks from changes in financial intermediation. Markets have become
apprehensive of EMEs with large current account deficits, which require financing
that might become scarce as global monetary conditions tighten.
The immediate consequence has been currency depreciation, realised in bursts
and interspersed with periods of relative calm. These conditions have coincided with
366 BIS Papers No 83slowing growth. The difficulty for policymakers has been crafting an appropriate
response. The risks are two-sided. Higher rates could depress output and widen an
already negative output gap. However, it is also possible that, by moving too slowly,
policymakers might ultimately allow a crisis to develop, perhaps in the form of a
“sudden stop”. Less dramatically, higher inflation from a depreciating currency could
unhinge inflation expectations, eventually requiring a stronger monetary response.
The recent collapse in oil prices has lent support to the inflation outlook, tempering
this problem. But permanently lower oil prices cannot be guaranteed, and the
benefits of cheaper oil would be diluted or possibly even nullified by additional
currency depreciation.
To achieve the right balance, it is probably necessary not to deviate too far
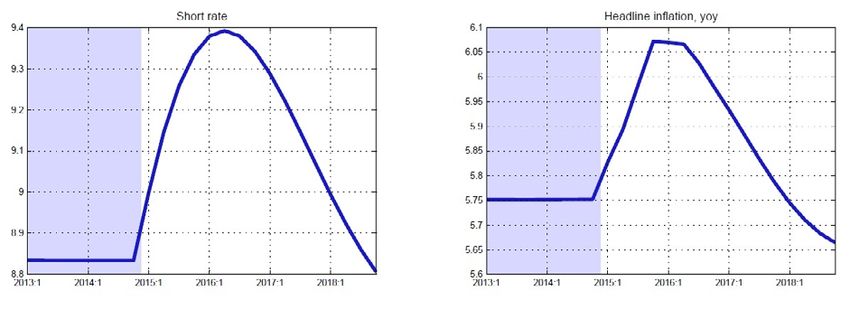
from changes in world policy rates. Within the context of the SARB’s Quarterly
Projection Model (QPM), a 100 basis point increase in international policy rates
causes depreciation which ultimately leads to an increase in the repo rate of
between 50 and 60 basis points (see Graph A.9.1). This calculation is rendered more
difficult by policy divergence between major advanced economy central banks. The
US Federal Reserve has tightened policy by tapering and recently ending
quantitative easing, and is expected to raise its policy rate in the second half of
2015. However, other major central banks have shifted to easier monetary policies,
perhaps offsetting some of the Fed’s impact on global monetary conditions.
(11.) To what extent do macroprudential policies influence the transmission
mechanism of monetary policy? How far do they complement or
substitute for interest rate policies?
In contrast to a number of other economies, South Africa has not experienced a
situation in the post-crisis period that has necessitated the implementation of
conventional macroprudential policies in order to address risks in the financial
sector. In general, both credit extension and asset prices have grown at fairly
moderate rates since the depths of the financial crisis in 2009. For example, from the
first quarter of 2010 to the third quarter of 2014, annual nominal credit and house
price growth have averaged 6.6% and 5.7%, respectively, compared to nominal GDP
growth of 8.8% over this period. In real terms, annual credit, house price and GDP
growth have averaged 1.2%, 0.3% and 2.5%, respectively.
Nevertheless, the core forecasting model of the SARB has been modified to
account for financial frictions that were not part of its structure before the global
financial crisis of 2008 and 2009. These modifications include effective lending rates
(which at times may be changing disproportionately to the policy rate, weakening
the monetary policy transmission mechanism), credit extension by shadow banks
(non-bank financial intermediaries), as well as certain balance sheet indicators such
as banks’ capital adequacy ratios, their distance-to-default and the Basel III net
stable funding ratio (NSFR). Movements in any of these variables generally reflect
changes in the behaviour of banks, which in turn affect the real economy through
various income channels in the model. Moreover, the model’s structure also
accounts for the linkages between certain macroprudential policy tools and these
financial variables, and therefore the ultimate impact of these tools on the real
economy – were they to be implemented at any stage.
Although South Africa has not recently utilised a macroprudential policy tool,
we can use the model to describe its effects. In the following example, we assume
that a build-up of excessive credit extension in the South African economy
BIS Papers No 83 367necessitates the implementation of the countercyclical capital buffer (CCCB). As
advocated by the Basel III regulations, the CCCB acts as a macroprudential add-on
to the banks’ existing capital adequacy ratio.
Graphs 17–21 indicate the impact of a 50 basis point increase in the required
capital adequacy ratio of banks following the implementation of the CCCB. The
additional capital that needs to be raised by banks leads them to curtail their
lending. This is reflected by a 1.05% decline in private sector credit extension after
four quarters, which in turn slows down real economic activity by around 0.1% after
eight quarters. Allowing monetary policy to react endogenously to the slowdown in
the real economy (within the context of the model), enables measurement of the
influence that macroprudential policy could have on monetary policy. Here, the
50 basis point increase in the countercyclical capital buffer leads to an eventual
lowering of the repo rate by around 10 basis points after eight quarters.
Spillovers from global monetary policy to the South African economy Graph 17-20
368 BIS Papers No 83The response of credit and output to a countercyclical capital buffer Graph 21
.6
.5
.4
@PCY(PSCE5_1)-@PCY(PSCE5_0)
@PCY(GDPMP6_1)-@PCY(GDPMP6_0)
.3
REPORI_1-REPORI_0
CADRAT _1-CADRAT _0 .2
.1
.0
0.0
-0.2
-0.4
-0.6
-0.8
-1.0
-1.2
I II III IV I II III IV I II III IV
2014 2015 2016
BIS Papers No 83 369You can also read