LIVING PAY CHEQUE TO PAY CHEQUE - 2020 SOUTH AFRICA CONSUMER SENTIMENT SURVEY MARCH 2020 - MCKINSEY
←
→
Page content transcription
If your browser does not render page correctly, please read the page content below
Living
pay cheque
to pay cheque
2020 South Africa
Consumer Sentiment Survey

March 2020

How South African
consumers make ends
meet in difficult times
and what their changing
behaviour means for retailers
and consumer packaged
goods manufacturers.

Authors
Marc Frederick
Damian Hattingh
Sidhika Ramlakan         March 2020
McKinsey & Company
Regarding Covid-19 The economic outlook remains grim
This article was written
before the onset of the
2020 Covid-19 pandemic. Consumer sentiment in South Africa mirrors rate than the population (0.2 percent for 2019 vs.
All facts and figures the grim situation of the country’s economy– 1.5 percent per annum).3 The IMF recently lowered
predate the outbreak. The regardless of whether you compare it to the global its South African growth forecasts to 0.8 percent
survey that this article is average, to BRIC benchmarks, or its peers in for 2020 and 1 percent for 2021.4 These forecasts,
based on was conducted
Africa, such as Nigeria and Morocco.1 however, still predate the outbreak of COVID-19,
in 2019. While it is too
early to predict the impact which can be expected to place further downward
According to the latest results from McKinsey’s
of the pandemic on the pressure on GDP growth.5
Global Consumer Sentiment Survey, an annual
South African economy,
we assume that both the
survey taken by more than 20,000 people across
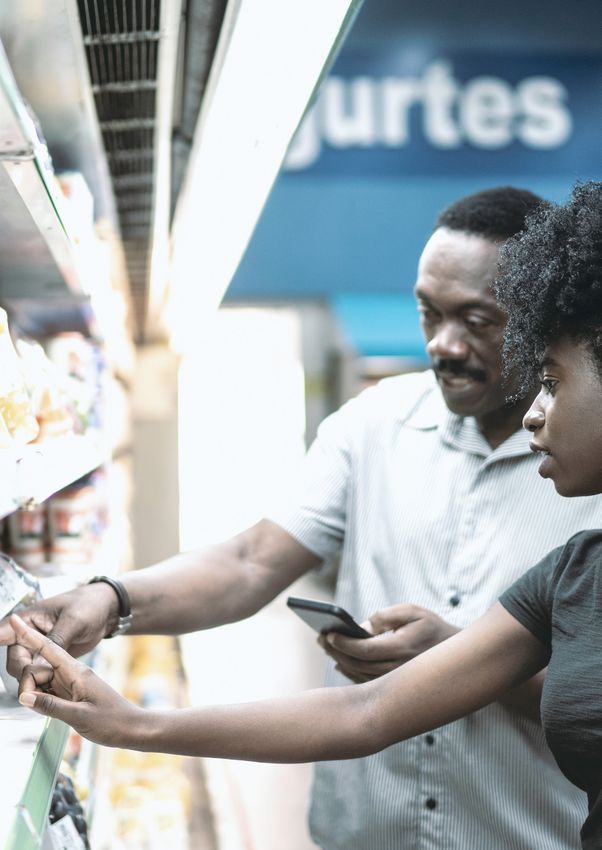
19 markets, less than a quarter (24 percent) of South Africans find it hard to make
disease itself and the
precautions taken to curb South Africans are optimistic about the country’s ends meet
its spread will further economy. This is well below the average across all Forty-three percent of South Africans find it
aggravate the situation markets surveyed (36 percent) and sub-Saharan harder now to make ends meet than 12 months
of consumers in South
Africa’s leading economy, Nigeria (43 percent). ago. This number is higher than the average of all
Africa. To corroborate this
assumption and generate South Africans are also more concerned about countries in the survey, as well as the numbers
additional insights at the job security than respondents in other countries. in Nigeria and Morocco. Almost half of all
category level, we are Sixty-eight percent of them worry that they, or a respondents in South Africa (48 percent) say
currently conducting a member of their household will lose a job in the that they are living pay cheque to pay cheque–
new survey. Results will be next year. This reflects the high unemployment the highest value of all countries surveyed
made available on https://
www.mckinsey.com/za.
rate of 29 percent (2019, up from 24 percent in (Exhibit 1). In 2019, 9.3 percent of household
2014)2 and the fact that GDP is growing at a lower income was spent to pay interest on debt, and
Exhibit 1
South Africans are under more financial distress than global, BRIC and African markets
Percent of people agreeing/strongly agreeing with each statement, 2019
South Africa Brazil Russia India China Nigeria Morocco Global Top 10 representative consuming markets
I am somewhat or very worried that I am living pay cheque to pay I am finding it harder to make ends
I or a member of my household will cheque meet now than 12 months ago
lose a job in the next year
76
70 69
68
56 56
48
43 43 43
41
37
34 35
30 31 30 30
28
25
24
Source: McKinsey 2019-2020 Sentiment Survey
Living pay cheque to pay cheque 1
McKinsey & Company

48%
of South Africans
say that they are
living pay cheque
to pay cheque

2                   Living pay cheque to pay cheque

McKinsey & Company
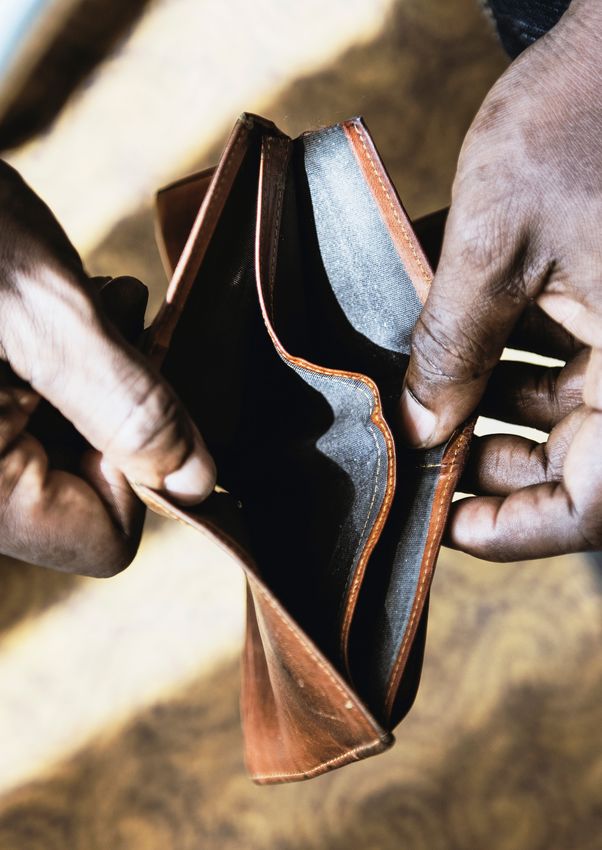
38%
the household debt-to-income ratio was were in 2018 (Exhibit 2). We see improvements
73 percent, compared to 65 percent in 2005.6 in the magnitude of five percentage points on
In Russia and Brazil, for example, the debt-to- some indicators. For example, this year more
of South Africans income ratio was only 30 percent and 55 percent respondents are optimistic about their country’s
say paying off debt respectively (latest figures available at the time of economy than in 2018 (up five percentage points),
is a top priority writing).7 According to our survey, paying off debt and fewer respondents said that they cut back on
is a top priority for South Africans (38 percent), spending (down five percentage points) or delay
on par with saving (39 percent) and ahead of purchases because of their current economic
spending money (24 percent) on everyday situation (down six percentage points). In the
necessities, education, or clothing. To free up absence of objective macroeconomic indicators to
cash, South Africans are cutting back on spending support this improvement, it could be interpreted
at the highest rate among all countries surveyed. as a sign that a growing share of consumers are
accepting the current economic situation as a new
All that said, most consumer sentiment indicators
normal and finding ways to adjust to it.
in South Africa are slightly more positive than they
Exhibit 2
Consumer spending is still cautious but less so than in previous years
Percent of people agreeing/strongly agreeing with each statement
2015 2016 2017 2018 2019
I am optimistic I cut back Given my economic
about my country’s on spending situation, I am delaying
economy purchases
64 64 64
62 62 61 60 59
56
53
25 24
23
21
19
Source: McKinsey 2019-20 Global Sentiment Survey
Living pay cheque to pay cheque 3McKinsey & Company
65%
But consumers are resourceful The most widely used strategies to save money
include:
South African consumers employ a wide range of
strategies to get what they value, which includes — Paying more attention to prices (SA: 65
of South Africans good overall product quality and good ingredients, percent; global: 36; Nigeria: 51; Morocco: 45)
are paying more while cutting back on their overall spending.
attention to prices — Looking for sales and promotions (SA: 63
For example, they shop around to get the best
percent; global: 36; Nigeria: 38; Morocco: 48)
deals (55 percent), and they look for their favourite
brands at cheaper stores (40 percent), especially — Shopping around to get the best deals (SA: 55
when it comes to household products (43 percent). percent; global: 32; Nigeria: 47; Morocco: 41)
Although they aren’t cutting back on spending as
The least-used strategies in South Africa include
aggressively as they say they did in previous years,
buying in bulk (44 percent) and using coupons or
South African consumers are still value-conscious.
discounts associated with loyalty programmes
(43 percent, down eight percentage points from
2018) (Exhibit 3).
Exhibit 3
South Africans seek value more aggressively than global, BRIC and African markets
Respondents who claim to have changed buying behaviour in some way in the last year
Percent, 2019
South Africa Brazil Russia India China Nigeria Morocco Global Top 10 representative consuming markets
I am paying more I am looking for sales and I shop around to get the I buy more in bulk I use coupons and loyalty
attention to prices promotions best deals card discounts more
often
65
63
57
55
50 51 51 51
48 48 47 47 48
45 45 44 43 43 43
40 41
39 38 38 38 38 38
37
34 35
31
25
21 21
15
Source: McKinsey 2019-2020 Sentiment Survey
4 Living pay cheque to pay chequeMcKinsey & Company Living pay cheque to pay cheque 5
McKinsey & Company

    South Africans trade down more than                    labels offer decent quality and good value for
    shoppers in any other country                          money; 50 percent of those respondents who
                                                           do intend to trade back up say that cheaper
    South Africa has the highest trade-down rate of
                                                           alternatives are good enough for everyday use,
    all countries covered in the survey.8 Twenty-two
                                                           and 38 percent say that cheaper alternatives
    percent of shoppers say they substitute branded
                                                           provide equal quality for less money.
    products with cheaper alternatives, such as more
    affordable brands or private labels/retailer brands    Compared to countries in which private label
    (compared to only 9 percent globally). Across          penetration is high, such as Germany and the UK,
    categories, shoppers trading down outnumber            South Africans who are trading down are less
    those trading up, especially when it comes to          likely to choose private labels. In South Africa,
    staples such as cleaning products, pasta, and          only 35 percent of shoppers who trade down
    bottled water. The South African trade-down rate       choose private labels over cheaper manufacturer
    is not only higher than in BRIC countries (Brazil:     brands, compared to 61 percent in Germany and
    19 percent; Russia: 15; India: 7; China: 3), but       73 percent in the UK. This could be a sign that
    also than in other African countries (Nigeria: 16      retailer private label offerings are less developed
    percent; Morocco: 15). Conversely, South African       in South Africa, or an indication of South Africans’
    trade-up rates of 6 percent are lower than all other   love of brands, or a combination of both effects.
    countries covered in the survey, including African
                                                           In two category groups, South African shoppers
    and BRIC peers (Exhibit 4).
                                                           are less likely to trade down than in others:
    Both low-income households and high-income             personal care, especially oral care, and alcoholic
    households are looking for ways to save money          beverages. Conversely, these category groups
    (LSM9 1-6: 73 percent; LSM 9-10: 70 percent),          also have the highest trade-up rates; cosmetics
    but they do it in different ways. Low-income           (12 percent), hair care (10 percent), and spirits
    households primarily trade down to less expensive      (8 percent) top the list.11 Baby boomers are even
    brands or private labels.10 The trade-down             less likely to trade down in these categories than
    rate reported by respondents in low income             younger shoppers, but they are also less likely to
    households (LSM 1-6) is 26 percent, compared to        trade up than the average consumer. This may be a
    20 percent in high income households (LSM 9-10).       sign that older consumers know what they like and
    High-income households employ a wider range            are reluctant to change their habits in these high-
    of strategies to cut spending, such as looking for     involvement categories. Additionally, we find that
    promotions, shopping around, buying in bulk, or        some South Africans are more likely to trade up
    using coupons and loyalty cards.                       when it comes to dairy milk (8 percent) and fresh
                                                           produce (7 percent). This observation is in line with
    About half (49 percent) of those who trade down
                                                           the fact that an increasing share of South Africans
    are pleased with the experience, and 61 percent
                                                           care about healthy eating and locally sourced
    say that they do not intend to trade back up,
                                                           products.
    indicating that many value brands and private

6   Living pay cheque to pay cheque
McKinsey & Company
Exhibit 4
In comparison to other countries, South Africans trade down more aggressively and
rarely trade up
Trade down rates in the last year among those who changed buying behaviour
Weighted average for categories in basket, Percent, 2019
Trade down
South
Africa Brazil Russia India China Nigeria Morocco Germany US UK Mexico
3
6
7
9
15 15 15
16
19
20
22
Trade down rate relative to trade up rate
3.6x 1.9x 1.9x 0.3x 0.1x 1.8x 1.5x 0.5x 0.8x 2.5x 1.9x
Global Top 10 representative consuming markets
Source: McKinsey 2019-2020 Sentiment Survey
Living pay cheque to pay cheque 7McKinsey & Company 8 Living pay cheque to pay cheque
McKinsey & Company

Health matters to a growing number of South African consumers
Increasingly, South Africans adopt a lifestyle of                       When it comes to packaged foods, the things
health and sustainability (LOHAS). Twenty-seven                         they care about the most are the use of real sugar
percent of South Africans report that they eat                          instead of artificial sweeteners (48 percent, up
more healthy foods (up from 22 percent in 2018)                         one percentage point), all-natural ingredients (44
and buy more locally-sourced products now than                          percent, up three percentage points), and organic
they used to a year ago (18 percent, up from 10                         ingredients (33 percent, up one percentage point).
percent in 2018) (Exhibit 5).

Exhibit 5

South Africans increasingly focus on eating healthy foods

Net changes in eating habits in the last 12 months
Difference between doing more and doing less, Percent

   2018             2019

        Eating healthy foods                           Buying locally                    Reading nutrition              Buying natural or
                                                     sourced products                     labels in stores              organic products

               27               27
                           25

          22

                                                          18
                                                                                                          16
                                                                        14
                                                                                                                                         13
                                                                   11                                11
                                                     10
                                                                                                                                     9
                                                                                             8
                                                                                                                             6

                                                                                        -5

                                                                                                                       -8
          South        Global Top 10                 South      Global Top 10           South     Global Top 10        South      Global Top 10
          Africa      representative                 Africa    representative           Africa   representative        Africa    representative
                        consuming                                consuming                         consuming                       consuming
                         markets                                  markets                           markets                         markets

Source: McKinsey 2019- 2020 Sentiment Survey

                                Living pay cheque to pay cheque                                                                                   9
McKinsey & Company
Online shopping is becoming more popular, especially in personal care
Currently, online shopping accounts for just over shoppers cite include saving time (60 percent),
1 percent of retail revenue in South Africa, but it being able to compare prices more easily than
is growing fast.12 This development is reflected offline (42 percent), and the freedom to order
in our survey. Thirty-four percent of consumers whenever they feel like it (35 percent). About
claim to have increased online spending in 2019. one in two online purchases is made using a
On average, online shoppers are younger and mobile device (43 percent in personal care).
more affluent than those who shop exclusively An overwhelming majority (63 percent) of those
offline; 85 percent of online shoppers are LSM 7 who spend more money online report a positive
and above, and 73 percent are less than 40 years experience. It stands to reason that online grocery
old. Consumers are using the online channel retail will further expand its market share at the
disproportionately to buy products like skin expense of traditional brick-and-mortar grocery
and hair-care products, cosmetics, wine, and retail, especially in categories such as personal
disposable nappies.13 The top reasons online care (Exhibit 6).
10 Living pay cheque to pay chequeMcKinsey & Company
Exhibit 6
The shift to online is largely driven by time savings and price visibility
Positive experience for those spending more in the channel in the last 12 months
Percent
2019 2018
Grocery stores Online Convenience stores Drug/health and beauty stores
63 63
48 48
45
40
38 39
Saves me Prices are Freedom Lower price Product
time easier to to order than offline range is
compare whenever greater
online online
69
60
44
42
35 35
22 22
19 19
Source: McKinsey 2019-2020 Sentiment Survey
Living pay cheque to pay cheque 11McKinsey & Company 12 Living pay cheque to pay cheque
McKinsey & Company

Opportunities for manufacturers
and retailers
The survey results demonstrate    Drive value perception through
how South African shoppers        advanced pricing and promotion
                                  management
are changing their behaviour      Value is top of mind for South African consumers.
in response to tight household    To drive improved value perception without
budgets and high economic         risking margin erosion, companies should adopt
                                  advanced approaches to pricing and promotion
uncertainty. And according        management, leveraging data and analytics.
to most forecasts, things won’t   For example, advanced analytics can help to
                                  identify items that have an above-average
get easier any time soon.
                                  influence on consumer value perception at a
This is an enormously             much more granular level than traditional market
challenging outlook for both      research. Leading players also use advanced
                                  analytical approaches to model the direct and
manufacturers and retailers.      indirect (“halo”) effect of promotions on value
On the one hand, they need to     perception.14
ensure short-term profitability   A leading European non-food retailer sought
despite the fact that consumers   to identify and prioritise items that shoppers
                                  consider value for money. The company built a
are cutting their spending.       model that statistically scored each product’s
On the other hand, they cannot    importance to consumer price perception by
                                  analysing granular internal and external data, such
compromise the long-term          as consumer research, the number of competitors
health of their businesses.       carrying the product, and competitor pricing.
In what follows, we look at       It also identified which other retailers were the
                                  true competitors for each item. The resulting
some of the avenues companies     index was linked to a dynamic pricing solution
could consider as they face       that suggests competitive pricing changes. For
this delicate balancing act.      instance, if inventory levels for a certain item
                                  are high, or if a competitor reduces the price of
                                  that item, the solution might recommend a price
                                  drop for that item. At the end of a three-month
                                  pilot, the retailer saw a 4.7 percent improvement
                                  in operating income in pilot categories, while
                                  simultaneously improving shoppers’ value for
                                  money.15
                                  In another case, a European retailer faced
                                  declining market share. Research showed
                                  that promotions were essential to attract
                                  customers. But the retailer’s promotions weren’t
                                  working. Although about one in four items was
                                  on promotion at any given time, 40 percent of
                                  promotions did not lead to sales and margin
                                  increases. It turned out that the approach the
                                  company used to measure promotion success
                                  was not adopted by all stores, and did not take
                                  all relevant effects into account. For example,

Living pay cheque to pay cheque                                                      13
McKinsey & Company
stocking up, cannibalisation, and incremental packaged goods (CPG) companies as far afield as
wastage were not covered by the existing tool. Mexico and Nigeria are driving engagement with
By leveraging advanced analytics, the retailer was hundreds of thousands of small retail customers
able to measure the true impact of promotions by using data and analytics to tailor order
including all relevant effects. To embed the new quantities, assortment, pricing, and promotional
approach across the organisation, the retailer strategies to the specific needs of individual
implemented a solution based on machine outlets. In formal retail channels, such as
learning to facilitate the promotions planning supermarkets, leading manufacturers use design
process, established a promotion centre of thinking principles to develop service models
excellence, and set up a capability development that are tailored to the unique context and needs
programme. As a result of this holistic promotions of their most important retailers. Following this
performance programme, sales increased by approach, a leading global manufacturer improved
1.3 percent and the gross margin increased by retailer satisfaction and delivered two percentage
0.5 percentage points. points in incremental top-line growth without
increasing operating costs.
Create stronger consumer
engagement to foster loyalty Use granular consumer insights to
South African consumers are willing to trade capitalise on evolving needs
across retailers, and trade away from preferred Even in a constrained economic environment,
brands, in their ongoing search for value. To changes in consumer behaviour and needs
counter this decline in loyalty, it is imperative for present retailers and manufacturers with
manufacturers and retailers in South Africa to opportunities to deliver incremental revenue
create stronger engagement with consumers. and margin. One example is the trend towards
Many South African retailers have implemented healthier eating. To capture such opportunities,
loyalty card programmes. These programmes companies need to understand the behaviour and
create a treasure trove of data. The next phase underlying needs of different consumer segments
in the evolution of consumer relationship at a granular level. New digital tools and machine
management, which is still nascent in South learning enable companies to generate highly
Africa, will be to use loyalty card data to engage granular insights 60 percent faster and with
with shoppers in a more personalised way. For 40 percent higher accuracy than in the past.
example retailers can use this data (if opted into For example, a global beverage company in the
by consumers) to develop tailored communication US used advanced analytical techniques to
and provide personalised offers that typically not identify the particular functional and emotional
only drive additional sales in the short term, but needs that millennials were most willing to pay
also foster long-term emotional engagement and a premium for, despite having a lower average
loyalty.16 South African retailers might want to take income than older shoppers. These insights
inspiration from pioneers elsewhere. A US grocery resulted in the launch of a full range of premium-
retailer, for example, uses advanced analytics priced functional beverages positioned to cater to
to distribute personalised promotional coupons needs such as health and wellness, convenience,
to over 10 million customers monthly. Thanks to and sustainability.
superior targeting, 65 percent of these vouchers
are redeemed, creating a substantial increase in Grow the value segment with an eye
store traffic, more transparency about returns on on profits
promotions spending, and a significant increase in
South African consumers are trading down to
long-term customer loyalty.
private label, and other branded products more
For manufacturers, strengthening customer than consumers in any country covered in our
engagement can take different forms. In informal global survey. Private label revenue in South Africa
retail channels, such as spaza shops, consumer has grown at 9.6 percent per annum, compared
14 Living pay cheque to pay chequeMcKinsey & Company Living pay cheque to pay cheque 15
McKinsey & Company

     to 4.4 percent for branded products. Private label       value brands have lower margins than mass
     products currently represent more than                   or premium brands. Naturally, manufacturers
     R50 billion in retail sales annually, about              worry about cannibalising their existing brands
     21 percent of the total. While this share is higher      with lower-tier innovations. To mitigate the risk
     than in most other developing markets, private           of margin loss, leading manufacturers use a
     label penetration lags developed markets such            consumer-back design-to-value (DTV) approach.
     as Germany and the UK, where the private label           This helps them design products based on the
     share is higher than 40 percent, suggesting              attributes that value segment shoppers look for,
     further headroom for growth in this area.17              while removing or streamlining those they do
                                                              not, to improve gross margins. A successful DTV
     For retailers, there is a clear imperative to
                                                              programme can also yield other improvements
     continue to drive private label sales. In particular,
                                                              across the value chain. One branded-food
     they will want to look for opportunities to position
                                                              manufacturer used data-driven DTV to create
     private labels as credible alternatives to branded
                                                              a flavour profile that matched the preferences
     products–the natural choice for consumers
                                                              of a specific consumer target segment, while
     looking to trade down. Global retailers such as
                                                              optimising the ingredient costs of the product
     Tesco, Kroger, and Loblaws have delivered better
                                                              range in question. Simultaneously, the company
     performance and improved customer price
                                                              made changes that reduced packaging
     perception by differentiating their private label
                                                              costs by 15 percent, increased shelf life, and
     portfolios, following a good, better, best logic that
                                                              reduced the supply chain’s carbon footprint.
     provides attractive propositions both to lower-
                                                              Overall, the company increased the absolute
     income shoppers and more affluent consumers.
                                                              contribution margin of its value range by eight
     Typically, these private label offerings yield better
                                                              percentage points, thereby mitigating the impact
     margins than branded alternatives.
                                                              of cannibalisation on its mainstream brands
     For manufacturers, the combination of high trade-        significantly.
     down rates and continued private label growth
     presents a risk to their core brands. Typically,

     Case example: Digital transformation
     While South African companies have started to            data architecture, IT architecture, and software
     adopt digitisation and advanced analytics, the           engineering. They created an agile, two-speed
     next step is to put these capabilities at the heart of   IT infrastructure, using the most advanced big
     everything they do. Companies that develop these         data platform for lighthouse applications. They
     capabilities at scale first will be in a privileged      also set up a data lake across 20 businesses in
     position going forward.                                  10 countries with a data volume of 200 terabytes.
                                                              The company established external partnerships
     A large retail and consumer products
                                                              to accelerate change and invested in internal
     conglomerate in the Middle East provides a
                                                              upskilling. This included the setup of an analytics
     reference case for what transformative change
                                                              training facility for all employees. To date, more
     looks like. The effort was led directly by the CEO.
                                                              than 20,000 employees have completed the
     It started with the vision to embed analytics in the
                                                              curriculum. In addition, the company trained
     DNA of the entire organisation. The objective was
                                                              200 translators to help bridge the gap between
     to make data-driven decision-making the norm
                                                              analytics specialists and business owners. The
     across all functions and divisions. The company
                                                              expected impact of implementing all use cases is
     developed a self-funding road map comprising
                                                              over USD300 million in incremental bottom line
     more than 150 use cases and recruited 30
                                                              impact by 2021.
     professionals in areas such as data science,

16   Living pay cheque to pay cheque
McKinsey & Company Living pay cheque to pay cheque 17
McKinsey & Company

     Improve productivity
     Given the current economic outlook, seeking            The trick is not to cut costs blindly, but to use
     productivity improvements is crucial for retailers     data as the basis for informed optimisation.
     and manufacturers to address short-term profit         Our experience shows that a rigorous, data-
     pressure and fund future growth. The challenge is      driven approach to measuring and optimising
     to do it in a way that does not jeopardise the long-   marketing return on investment can release
     term health of the organisation. Two examples          between 15 and 20 percent of a company’s
     of substantial drivers of operating costs that are     marketing budget without compromising top-
     often overlooked in traditional cost-cutting efforts   line performance.
     are outlined below.
                                                            A leading US manufacturer used advanced
     — Indirect costs represent a substantial share of      marketing mix modelling to optimise its
       total cost for both retailers and manufacturers,     advertising budget. The model relies on
       and unlike direct costs, are often not optimised     audience response curves and recognises a
       systematically. This is because these costs          variety of business objectives and marketing
       are less visible than direct costs, ownership is     targets as dependent variables. It produces
       often fragmented, and procurement is usually         allocation proposals and simulates the effect
       done in silos. By using digital and analytical       of different scenarios on revenue and market
       tools and adopting a cross-functional                share. With the help of the tool, the manufacturer
       approach to indirect cost optimisation,              was able to cut advertising spend by 10 percent
       retailers and manufacturers can improve              without impacting top-line performance.19
       the transparency about total spending. This

                                                                                  •••
       kind of transparency is a key prerequisite for
       more targeted purchasing, optimising both
       what and how they buy. Retailers that treat
       indirect costs as an opportunity for business        These are difficult times for South African
       transformation, rather than just a procurement       consumers, retailers and manufacturers,
       matter, can boost return on sales by as much         with no immediate relief in sight. Consumers
       as 2 percent.18                                      are increasingly mindful of how, and on what,
                                                            they spend their money. In this situation, it is
         One European retailer used digital consumer
                                                            imperative for retailers and manufacturers
         surveys and crowdsourced competitor
                                                            to find appropriate ways to meet consumers’
         benchmarks to understand, address, and
                                                            needs. Companies that understand the root
         re-test consumer perceptions of store
                                                            causes that drive consumers’ choices and
         cleanliness. This allowed them to reallocate
                                                            sharpen their value propositions accordingly
         spending on cleaning services from outside
                                                            will be best positioned to achieve above market
         the store to internal areas such as fitting
                                                            growth. In addition, companies will want to take
         rooms, delivering higher customer satisfaction
                                                            advantage of state-of-the-art approaches to
         and lower costs.
                                                            drive higher returns on their investments in
     — Many brand managers hesitate to touch                marketing, innovation, pricing, and promotions.
       marketing spending, given its strategic              Those who excel on both fronts will be well set
       importance as a driver of sales. But by doing        up to succeed in the current environment and in
       so, they are leaving money on the table.             the years to come.

18   Living pay cheque to pay cheque
McKinsey & Company
Fast facts on the survey
— The survey was fielded in September 2015, 2016, 2017, 2018, and 2019.
— The sample comprised 19 consumer markets, including South Africa, Nigeria, and Morocco.
In South Africa, approximately 1,010 consumers participated in the survey.
— The survey was conducted online, resulting in a skew. This is because internet users are younger,
more urban, and more affluent than the average of the population in most countries. To amend for the
online skew, the sample was weighted using census data for age and panel data for income/social
economic status.
— Category insights were weighted by purchase incidence.
— Regional and country weightings were conducted in line with standards defined by the McKinsey
Global Institute:20
• Sentiment questions were weighted by size of the consuming class.
• Behavioural questions were weighted by size of the consuming class and per capita consumption
of the consuming class.
— The results are based on consumer statements and reports, not on observations of actual behaviour.
In some areas, actual behaviour may deviate from stated intentions and/or reported behaviour.
Further reading
McKinsey 2020 Global Consumer Sentiment Survey: A tale of two segments
https://www.mckinsey.com/industries/consumer-packaged-goods/our-insights/mckinsey-2020-
global-consumer-sentiment-survey-a-tale-of-two-segments
Agility@Scale: Solving the growth challenge in consumer packaged goods
https://www.mckinsey.com/industries/consumer-packaged-goods/our-insights/agility-at-scale-
solving-the-growth-challenge-in-consumer-packaged-goods
How retailers can drive profitable growth through dynamic pricing
https://www.mckinsey.com/industries/retail/our-insights/how-retailers-can-drive-profitable-growth-
through-dynamic-pricing
For more highlights from the survey, see our forthcoming articles on mckinsey.com/industries/
consumer-packaged-goods/our-insights.
Marc Frederick and Damian Hattingh are partners in the Johannesburg office of
McKinsey & Company. They advise clients in the consumer and retail sectors. Sidhika Ramlakan
is a manager in the Johannesburg office.
The authors wish to thank Anne Grimmelt, Max Magni and Alex Rodriguez for their contributions to this
article through their work on the global survey.
Living pay cheque to pay cheque 19McKinsey & Company
Footnotes
1 In what follows, percentage figures are given as the share of respondents who agree or agree strongly with the statement in question
(unless otherwise noted).
2 Statistics South Africa.
3 Statistics South Africa.
4 https://www.imf.org/en/Publications/WEO/Issues/2020/01/20/weo-update-january2020 (retrieved March 5, 2020)
5 https://www.nytimes.com/2020/02/28/business/economy/coronavirus-economy.html (retrieved Mar 3, 2020).
6 South African Reserve Bank.
7 https://data.oecd.org/hha/household-debt.htm (retrieved February 27, 2020).
8 The trade-down rate is defined as agreement or strong agreement to the statement “I traded down to a less expensive brand or private
label”. Results are given as weighted averages, reflecting the share of different categories in the average shopper’s basket.
9 The SAARF Living Standards Measure (LSM) divides the population into ten LSM groups, 10 (highest) to 1 (lowest). The SAARF LSM
is a unique means of segmenting the South African market. It groups people according to their living standards, using criteria such as
degree of urbanisation and ownership of cars and major appliances. See http://www.saarf.co.za/lsm/lsms.asp (retrieved March 3,
2020) for details.
10 Baby boomers (born 1946-1964) are slightly less likely to trade down than younger consumers (19 percent: SA average; 22 percent:
Gen X; born 1965-1974: 29 percent), possibly a reflection of the high unemployment rate among younger South Africans and the higher
willingness of younger consumers to try new things.
11 The trade-up rate is defined as agreement or strong agreement to the statement “I traded up to a more expensive brand”. Results are
given as weighted averages, reflecting the share of different categories in the average shopper’s basket.
12 A figure of 1.4 percent according to World Wide Worx / Ecommerce Forum of Africa. http://www.worldwideworx.com/wp-content/
uploads/2018/12/Exec-Summary-Online-Retail-in-SA-2019.pdf (retrieved February 23, 2020).
13 Note that this ranking is not based on observed growth rates. Rather, it is based on the shares of survey participants who said they
bought more online in 2019 in the category in question than they did in 2018. Actual behaviour might differ from these statements, and
there is no weighting for volume or revenue.
14 https://www.supermarketnews.com/marketing/working-halo-effect-store-promotions (retrieved February 23, 2020).
15 https://www.mckinsey.com/industries/retail/our-insights/how-retailers-can-drive-profitable-growth-through-dynamic-pricing
(retrieved April 9, 2019).
16 Companies should consult the latest regulation applicable to the territories in which they operate, such as the Protection of Personal
Information Act (PoPI) in South Africa. See https://www.mckinsey.com/business-functions/risk/our-insights/data-privacy-what-
every-manager-needs-to-know; https://www.mckinsey.com/business-functions/risk/our-insights/gdpr-compliance-after-may-
2018-a-continuing-challenge (retrieved November 23, 2019).
17 https://www.bizcommunity.com/Article/196/168/198153.html; https://www.nielsen.com/za/en/press-releases/2018/private-label-
surges-ahead/ (retrieved Feb 26, 2020); Nielsen State of Private Label Report – 2017 Global Report.
18 Steve Hoffman and Patrik Silén, “Beyond procurement: Transforming indirect spending in retail”, Perspectives on Retail and Consumer
Goods, January 2019.
19 Jonathan Gordon et al., “Marketing Mix Modeling”, in Jesko Perrey, Retail Marketing and Branding, John Wiley & Sons, 2013.
20 https://www.mckinsey.com/mgi/overview (retrieved December 10, 2019).
20 Living pay cheque to pay chequeMcKinsey & Company Living pay cheque to pay cheque 21
March 2020
Copyright © McKinsey & Company
www.mckinsey.com
   @McKinseyAfrica
You can also read