Q2 - Industrial Market Report METROPOLITAN CHICAGO - NAI Hiffman
←
→
Page content transcription
If your browser does not render page correctly, please read the page content below
Q2 2 0 21
TRUSTED.

                                                   HIFFM A N .CO M

            Industrial
            Market Report
            M E T R O P O L I TA N C H I C A G O
Industrial
Market Report
M E T R O P O L I TA N C H I C A G O

03   Industrial Statistics
04   Industrial Market Summary

06   Industrial Construction

     Industrial Submarket Overviews
		08      Southeast Wisconsin
		 10     Lake County
		12      I-90/Northwest
		 14     Northwest Cook
		 16     North Cook
		 18     Fox Valley
		 20     DeKalb County
		 22     Central DuPage
		24      O’Hare
		 26     West Cook
		28      Chicago
		 30     I-88 Corridor
		 32     Southwest Cook
		 34     I-55 Corridor
		 36     South Cook
		 38     I-80/Joliet Corridor
		 40     I-57 Corridor

                                       Q2
		 42     Northwest Indiana

44   Capital Markets Overview

46   NAI HIffman

                                       2 0 21
Q2     2 0 21

Industrial Market Statistics

                                                                Total                                      Net          New        Under            Leasing
                                              2Q21 Total      Vacant    2Q21 Total   Availability   Absorption        Supply Construction           Activity
   Submarket                                   RBA (SF)          (SF)     Vacancy          Rate           (SF)          (SF)         (SF)              (SF)
   Southeast Wisconsin                        63,514,271    2,495,668       3.93%         6.78%       496,808              0      3,174,778          83,697
   Lake County                                75,418,385    4,274,836       5.67%         8.56%      (147,766)             0      1,261,739         695,380
   McHenry County                             28,194,169    2,587,829       9.18%         8.11%       (33,306)             0               0        117,015
   I-39 Corridor                              38,919,071    3,648,518       9.37%         9.60%        32,749              0               0        129,702
   DeKalb County                              12,629,543      587,483       4.65%         1.73%         (1,370)            0      2,567,000               0
   I-90 Northwest                             33,651,156    2,470,281       7.34%         7.35%       483,319         45,000          162,888       947,275
   Northwest Cook                             24,435,331    1,654,918       6.77%         6.85%         (6,581)            0      1,114,481         206,911
   North Cook                                 45,936,879    1,837,685       4.00%         5.34%          9,082        27,000               0        243,327
   Fox Valley                                 37,587,512    1,687,528       4.49%         4.45%       119,749              0      1,513,267         594,375
   Central DuPage                             77,036,469    3,159,582       4.10%         6.60%       461,040              0      1,170,047         751,106
   O'Hare                                    103,652,869    5,025,183       4.85%         6.06%      1,599,254       317,513          586,377   2,983,042
   West Cook                                  61,419,527    2,609,213       4.25%         6.70%      (144,203)             0      1,248,377         296,315
   Chicago North                              55,753,918    3,994,882       7.17%         7.39%      (103,923)             0               0        192,776
   Chicago South                             122,125,224    6,556,317       5.37%         6.65%       149,901        999,900      1,676,182         285,458
   I-88 Corridor                              70,827,433    3,295,278       4.65%        13.17%       947,696              0          340,193       835,089
   Southwest Cook                             37,435,472    1,110,136       2.97%         2.87%       107,296              0               0        111,942
   I-55 Corridor                             102,970,839    8,309,296       8.07%        12.47%      1,971,347             0      2,484,661     2,382,637
   South Cook                                 83,136,391    3,878,885       4.67%         6.13%       597,287        750,000      4,455,200         664,668
   I-80/Joliet Corridor                       97,785,669    3,465,043       3.54%         8.31%      3,083,696     3,026,220      5,499,271     2,102,693
   Northwest Indiana                          42,110,889    1,391,877       3.31%         4.71%      (120,606)       331,900           35,838       320,605
   I-57/Will Corridor                         18,073,752    1,066,091       5.90%         9.89%       182,728      1,015,000               0        210,928

   Total Market                         1,232,614,769      65,106,529      5.28%         7.57%      9,684,197      6,512,533    27,290,299 14,154,941

Vacancy Rate and Available Inventory
                     15%                                                                                                                                          1.3
                           11.50%
VA C A N CY R AT E

                                    10.30%
                                                                                                                                                                        SF (BILLIONS)

                                                  9.20%
                     10%                                      8.40%       7.90%                                                                                   1.2
                                                                                      7.24%
                                                                                                    6.58%         6.13%        5.87%        5.77%         5.46%

                     5%                                                                                                                                           1.1

                     0%                                                                                                                                           1.0
                           2010     2 0 11        2012        2013       2 014        2015          2016          2 0 17       2018         2019          2020

                                                                                                             VA C A N CY R AT E                     INVENTORY                 3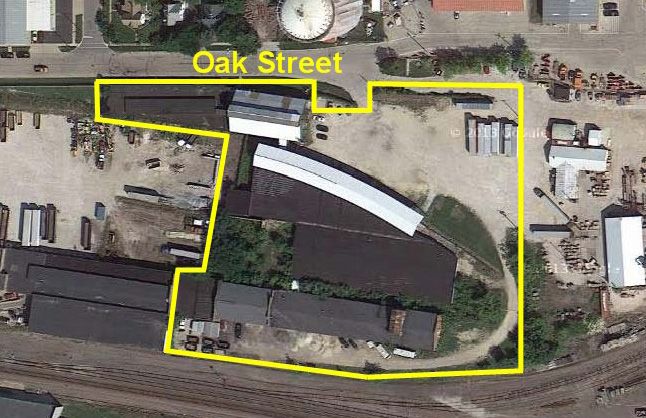
INDUSTRIAL
MARKET                                         Chicago industrial recorded a 5.28 percent vacancy rate at
SUMMARY
                                               mid-year, as the market absorbed nearly 9.7 million square
                                               feet - the highest figure in nearly five years.

                   Vacancy Rate                        Net Absorption                      New Leasing

                    5.28%                              9.7M SF                           14.2M SF
Insatiable demand spurs                                                   Amazon signed leases in both Huntley and Waukegan, adding
                                                                          another 1.1 million square feet to their already booming footprint.
supply to try to keep pace
                                                                          The headline story of the quarter though is the truly eye-popping
While the industrial Chicago real estate market had stayed
                                                                          rate of net absorption. Chicago industrial recorded nearly 9.7
resilient through a full calendar year of pandemic, it truly found
                                                                          million square feet of move-ins in the second quarter of 2021.
another gear in the second quarter of 2021. The total vacancy
rate at mid-year was 5.28 percent. This rate decreased 48 basis
points quarter-over-quarter from the 5.76 percent recorded in
the first quarter of 2021, despite the completion of over 6.5
million square feet of new product. Furthermore, the vacancy rate
decreased 87 basis points year-over-year compared to the 6.15
percent rate recorded at mid-year 2020.

None of the 21 submarkets across the Chicago metro area
recorded a double-digit vacancy rate at mid-year. The Southwest
Cook submarket was the tightest with respect to vacancy - 2.97
percent. Additionally, 12 of the 21 submarkets recorded sub-5.0
percent vacancy rates on the quarter.

Impressively, the overall vacancy rate decreased despite 11                                                     Vacancy Rate (%)   Net Absorption (SF)

developments delivering the previously referenced 6.5 million             Market Summary
square feet of new product to the market over a 90-day period.
                                                                                               2Q 2021          SF
Led by CenterPoint Properties' two +1.0 million-square-foot
developments, the I-80/Joliet Corridor saw three projects deliver                             Market Size       1,232,614,769
on the quarter totaling over 3.0 million square feet. All three                             Total Vacancy       65,106,529 5.28%
buildings were already leased upon their respective completions,
                                                                                           Direct Vacancy       61,999,436 5.03%
regardless of being a build-to-suit or speculative development.
                                                                                       Sublease Vacancy         3,107,093 0.25%
Leasing activity remained strong in the second quarter, as nearly
14.2 million square feet of deals were recorded. This represented                         Available Space       93,251,312 7.57%
a 13.5 percent increased year-over-year compared to the nearly                       QTR Net Absorption         9,684,197
12.5 million square feet of new leasing that was recorded in the                     YTD Net Absorption         12,203,901
second quarter of 2020. There were five deals inked between
                                                                                      Under Construction        27,290,299
500,000 square feet and 1.0 million square feet on the quarter,
highlighted by Lion Electric signing for over 906,000 square feet                        QTR New Supply         6,512,533
at Clarius Park Joliet, which delivers later in the year. Additionally,              New leasing activity       14,154,941

                                                                                          Q2 2021 INDUSTRIAL MARKET REPORT
Key Industial Takeaways
                           Chicago industrial recorded nearly 9.7 million square feet of net absorption in the second quarter of
                           2021. This was the strongest single-quarter net absorption figure since the third quarter of 2016.

                           There are currently 68 developments underway throughout the Chicago industrial market, accounting
                           for nearly 27.3 million square feet. There are 11 submarkets that have at least 1.1 million square feet
                           underway, led by the nearly 5.5 million square feet of development in the I-80/Joliet Corridor.

                           The total vacancy rate at mid-year was 5.28 percent. This rate decreased 87 basis points year-over-
                           year compared to the 6.15 percent recorded at mid-year 2020.

                                                                                 Net Absorption by Submarket

This was the strongest single-quarter net absorption figure since                                                        9 . 6 8 M SF
the 12.3 million square feet of move-ins recorded in the third                                                    Q2 2021 Net Absorption
quarter of 2016. The I-80/Joliet Corridor and O'Hare submarkets
led the way in the second quarter, as each submarket recorded
over 1.5 million square feet of move-ins. The I-88 Corridor
submarket also posted a strong net absorption figure, tallying
947,696 square feet of move-ins. Conversely, the submarket
laggards on the quarter - Lake County and West Cook - each
                                                                                                                                                   Net Absorption (SF)
saw roughly 145,000 square feet return to the market to start the
year. Despite these relatively minor declins in net absorption, both
submarkets maintained a vacancy rate of less than 5.67 percent,                  New Supply & Net Absorption
a remarkable demonstration of the asset type's run of success.

The Chicagoland industrial development pipeline is marching
lockstep with the rest of the market fundamentals to try to meet
the insatiable demand. There are currently 68 developments
underway throughout the market, accounting for nearly 27.3
million square feet. There are 11 submarkets that have at least 1.1
million square feet of development underway, led by the nearly
5.5 million square feet of development in the I-80/Joliet Corridor.
CenterPoint Properties' two latest speculative facilities under
construction at CenterPoint Intermodal Center in Joliet account
                                                                                                                                   New Supply          Net Absorption
for over 2.0 million square feet of said space.

Significant Transactions

        Lease                      Lease                       Lease                  Sale                    Sale                               Sale
     3835 Youngs Rd          501 Internationale Pkwy         900 Knell Rd          3000 W 51st St      2200 Channahon Rd                   400 N Wolf Rd
         Joliet                      Minooka                 Montgomery               Chicago                Joliet                          Northlake
    I-80/Joliet Corridor      I-80/Joliet Corridor           I-88 Corridor         Chicago South       I-80 Joliet Corridor                     West Cook
          Tenant                    Tenant                      Tenant                 Buyer                    Buyer                          Buyer
      Lion Electric Co.    Kenco Logistic Services, Inc.   DSV Air & Sea, Inc.        Amazon        Industrial Realty Group, LLC     Apollo Global Management
                                                                                                                                                                     5
OUTH COOK SE WISCONSIN DEKALB
Construction Deliveries
There was more than 6.5 million square feet of deliveries across the Chicago metropolitan
area during the second quarter of 2021. Build-to-suit projects comprised 62.2 percent of
DEKALB CENTRAL DUPAGE
deliveries on the quarter while the remaining 37.8 percent were speculative developments.
CONSTRUCTION Build-to-suit deliveries included a 1.6 million-square-foot Harbor Freight facility in Joliet,
ACTIVITY Illinois and a 1.1 million-square-foot Amazon facility in University Park, Illinois. Additionally,
SOUTH COOK sixteen new projects broke ground during the second quarter adding nearly 5.5 million
SE WISCONSIN
WISCONSIN DEKALB CENTRAL DUPAGE
square feet to the development pipeline.
CHICAGO SOUTH SOUTH COOK
SE WISCONSIN DEKALB
43
LAK E
G E NE VA Southeast K E NOSHA
Wisconsin
BEL OIT
PLE ASANT PR AI R I E
I-55 I-57 LAKE COUNTY
Wisconsin
Illinois Wisconsin
Illinois
Z I ON
90
39 FOX LAK E
I-57 LAKE COUNTY NORTH COOK
McHenry CHICAGO SOUTH WAUK E G AN
M CHE NRY
County 94
SOUTH ROCKFORD Rockford SOUTH COOK
CHICAGO SOUTH
Lake SE WISCONSIN
SOUTH COOK
Area County
LI B E RTYV I LLE
FOX VALLEY BELVI DE RE
I-55 I-57
SOUTH
SOUTH COOK SE
SE WISCONSIN D
I-57 COOK LAKE COUNTY
CRYSTAL LAK E WISCONSIN
V E R NON HI LLS
LAK E FOR E ST NORTH COOK D
C H E R RY
VA LLE Y
LAK E Z UR I CH
CHICAGO90
SOUTH SOUTH COOK
HI G HLAND PAR K
B UFFALO
I-90/NORTHWEST FOX VALLEY G R OV E
I-55
I-55 I-57 LAKE COUNTY
PALATI NE
DEKALB HAMPSHI RE
94
I-90
E AST
Northwest
North
DUNDE E AR LI NG TON
294
Northwest 90 Cook HE I G HTS
M ORTON
G R OV E
39 Cook
E VAN S T O N
RRIDOR CENTRAL DUPAGE FOX VALLEY I-90/NORTHWEST NORTH COOK
WEST COOK E LG I N O’HARENORTHWEST COOK NORTHWEST INDIANA
SCHAUM B UR G DE S PLAI NE S
NI LE S SK OK I E
STR E AM WOOD E LK G R OV E
CHICAGO SOUTH
SOUTH E LG I N V I LLAG E
290 LI NCOLNWO O D
CHICAGO SOUTH SOUTH COOK
O’Hare SE WISCONSIN
B LOOM I NG DALE WOOD DALE
DE K AL B
ORTH BUILD TO SUIT
ROCHELLE Central 90
West
FR ANK LI N PAR K
chart is so big that
itO’HARE
has its own separate NORTHWEST INDIANAFox Valley
ST CHAR LE S
DuPage NORTHWEST COOK
94
file. G E NE VA
I-90/NORTHWEST
E LM HUR ST
Cook
M E LR OSE
PAR K
FOX VALLEY
DeKalb Chicago
WE ST CHI CAG O
355 290
SPEC
County B ATAV I A
88
Southwest
CI CE R O
FOX VALLEY BUILD TO SUIT I-55 I-57
I-90/NORTHWEST NORTH AUR OR A FOX VALLEY
DOWNE R S Cook 55 Chicago I-55
88
LEGEND
I-80/JOLIET CORRIDOR
I-39 KEY WEST COOK
O’HARE SOUTH COOK
NAPE RV I LLE
G R OV E LA G R ANG E
WEST COOK
O’HARE South
FOX
FOX VALLEY
VALLEY I-55 CORRIDOR LAKE COUNTY I-55
I-55NORTHWEST INDIANA I-57
I-57
O’HARE NORTHWEST COOK
Corridor
Speculative
SUGAR GR OV E
SPEC AUR OR A
B UR R
I-88 Corridor
R I DG E B E DFOR D PAR K
I-55
Corridor
M ONTG OM E RY
B R I DG E V I E W
Build-to-Suit I-90/NORTHWEST FOX VALLEY I-55
GO SOUTH SOUTH COOK B OLI NG B R OOK SE WISCONSIN 294
SCONSIN
N KEY DEKALBDEKALB KEY CENTRALCENTRAL
DUPAGE DUPAGEWEST COOK 90
ALSI P 57
WEST COOK O’HARE NORTHWEST INDIANA
2 M SF PALOS
B LUE I SL A N D
55 South Cook
HE I G HTS
PLAI NFI E LD R OM E OV I LLE
1 M SF 355
SOUTH
NW INDIANA HOLLAND H A MMO N D
I-88 TI NLE Y PAR K
80 94
0.5 M SF DEKALB
CHICAGO SOUTH BUILD TO SUIT
M OK E NA
J OLI ET
BUILD TO SUIT
SHOR E WOOD
80 C H I C A GO
H EI GH T S
I-90/NORTHWEST
39 FOX VALLEY I-55
BUILDI-80/Joliet
BUILD TO SUIT SPEC SPEC
PAR K FOR ES T M
TO SUIT
SOUTHEAST WISCONSIN
Corridor North
India
M I NOOK A
Indiana
O
O SUIT
Illinois
SUIT I-88
SPEC KEY
SPEC
M ONE E
I-57/Will KEY
Corridor
E LWOOD
80 BUILD TO SUIT 57
OT TAWA
CHICAGO SOUTH
LA SA LLE KEY WEST COOK O’HARE
KEY KEY WEST COOK
Q 2 2 0 2 1 I N D U S T R I A L M A RI-88
KET REPORT
KEY WEST SPEC
KEY I-88 WEST COOK
COOK O’HARE
O’HARE NO
N
Construction Deliveries                                                                    Construction Type
                                                                                                                       48% Speculative

             15.52 MILLION SF
                                                                                                                       27.3M
                                                                                                                       SF Total Under
                                                                                                                        Construction

                                                                               Total Deliveries SF
                                                                               Under Construction SF
                                                                               10-Year Average
                                                                                                                       52% Build-to-Suit

Notable Speculative Projects Under Construction
Submarket                       Building Address                                      Size (SF)          User            Developer
Central DuPage                  845 W Lake St, Hanover Park                            216,187                           Fund Xii Hanover Park LLC
Central DuPage                  Building B, SEC Swift Rd & Lake St, Addison            189,300           Amazon          Logistics Property Company
Chicago South                   Building E, 12200 S Avenue O, Chicago                  580,587                           Northpoint Development
Chicago South                   5064 S Merrimac Ave, Chicago                           306,538
Fox Valley                      Enterprise Cir, West Chicago                           501,048
                                Sec Roosevelt & Technology Blvd,
Fox Valley                                                                             400,088                           Midwest Industrial Funds
                                West Chicago
I-55 Corridor                   Carlow XVII, 925 Dalton Ln, Bolingbrook                402,051                           Northern Builders, Inc.
                                Romeoville Gateway,
I-55 Corridor                                                                          351,870                           IDI Logistics
                                1301 N Abbot Rd, Romeoville
I-80/Joliet Corridor            Lot 20, 2250 Berens Ct, New Lenox                    1,159,200                           Northern Builders, Inc.
I-80/Joliet Corridor            4300 Brandon Rd                                      1,035,034                           CenterPoint Properties
I-80/Joliet Corridor            3301 Brandon Rd                                      1,000,000                           CenterPoint Properties
                                South Lake Industrial Center Building D, 700
Lake County                                                                            355,643                           Panattoni
                                Darling Dr, Vernon Hills
                                Bartlett Rd & Spitzer Rd (Site #1),
Northwest Cook                                                                         436,500                           Conor Commercial Real Estate
                                235-265 Spitzer Rd, Bartlett
Southeast Wisconsin             2908 128th Ave, Kenosha                                377,378                           Zilber Property Group
                                Midwest Transportation Center,
Southeast Wisconsin                                                                    280,000                           Darwin Realty
                                7517 60th St, Kenosha
West Cook                       Building 2, 2065 George St, Melrose Park               350,248                           LBA Logistics

Notable Build-to-Suit Projects Under Construction
Submarket                       Building Address                                Size (SF)              User                     Developer
DeKalb County                   Gurler Rd, DeKalb                               1,660,000              Ferrara Candy            Trammell Crow Company
                                Facebook DeKalb Data Center,
DeKalb County                                                                     907,000              Facebook
                                Gurler Rd, DeKalb
I-55 Corridor                   1040 W Renick Rd, Romeoville                    1,200,420              Wayfair
                                Building B BTS, 24231 S Exchange Blvd,
I-80/Joliet Corridor                                                            1,360,520              N/A                      Venture One Real Estate
                                Channahon
O'Hare-80/Joliet Corridor       6 King St, Elk Grove Village                      400,000              Microsoft                Brennan Investment Group

South Cook                      7001 Vollmer Rd, Matteson                       3,800,000              Amazon                   Seefried Properties, Inc.

South Cook                      6600 W 68th St, Bedford Park                      655,200              Wayfair

Southeast Wisconsin             12354 Uline Way, Kenosha                          800,000              Uline                    Uline
Southeast Wisconsin             12656 Burlington Rd, Kenosha                      800,000

                                                                                                                                                            7
Southeast Submarket Overview
Wisconsin Vacancy
Rate
Total
Inventory
(SF)
Net
Absorption
YTD Net
Absorption
Under
Construction
(SF)
New
Supply
(SF)
New
Leases
(SF)
Current Quarter Q221 3.93% 63,514,271 496,808 -318,245 3,174,778 0 83,697
Previous Quarter Q121 5.26% 63,419,641 -815,053 -815,053 1,613,354 2,461,466 876,559
Previous Year Q220 5.37% 60,791,683 1,461,715 1,548,025 3,664,048 388,294 265,951
SOUTH
MILWAUKEE
43 MUSKEGO FRANKLIN
OAK CREEK
Vacancy Rate Net Absorption
3.93% 497K SF
45
The total vacancy rate in the Southeast Wisconsin submarket 94
32
dropped 133 basis points at mid-year to measure 3.93 36
38
MT. PLEASANT
percent, down from the 5.26 percent recorded in the first RACINE
quarter of 2021. This rate is 144 basis points lower than the 31
STURTEVANT
5.37 percent recorded this time last year. UNION GROVE
BURLINGTON
The sublease vacancy rate was 0.23 percent at mid-year, 142 41
decreasing 10 basis points quarter-over-quarter from the 0.33 83
Kenosha
percent rate recorded in the first quarter of the year. Regional
Airport
KENOSHA
50
The submarket bounced back in the second quarter by
45
recording nearly 500,000 square feet of net absorption, 83
PLEASANT PRAIRIE 32
Westosha
following the -815,245 square feet recorded at the end of Airport
31
Wisconsin
the first quarter. The biggest move-in of the quarter was
Illinois
Visual Pak Company occupying over 472,000 square feet in
Kenosha. Southeast Wisconsin has tallied -318,245 square ZION
feet of cumulative net absorption through mid-year. Waukegan
Regional Airport
94
FOX LAKE
Southeast Wisconsin saw 83,697 square feet of new leasing GURNEE
WAUKEGAN
activity in the second quarter, declining 68.5 percent year- GRAYSLAKE
MCHENRY
over-year from the 265,951 square feet of new leasing activity NORTH
CHICAGO
recorded in the second quarter of 2020.
Vacancy Rate, Net Absorption New Lease Transactions
Leasing Activity Q1 Q2 Q3 Q4
Vacancy Rate (%) Net Absorption (SF)
Q2 2021 INDUSTRIAL MARKET REPORT
75,233 SF
                                                                                            NEW LE ASE
                                                                         1570 International Drive | Mount Pleasant, WI

                                                              Ryder Last Mile leased 75,233 square feet at Building 3 of Park
                                                              94 at Mount Pleasant. The Class A distribution center was a
                                                              speculative development that delivered in the fourth quarter of
                                                              2019.

Construction Activity                                         Blocks of Available Space
Darwin Realty broke ground on the Midwest
Transportation Center during the second quarter. The
speculative facility will be in Kenosha. The building plans
to deliver later this year, adding 280,000 square feet to
the submarket.

Five build-to-suit facilities remain under construction in
the submarket, totaling more than 2.5 million square feet.
Uline’s 800,000 square-foot facility in Kenosha plans to
deliver in September.

                                                              Submarket Snapshot
                                21% Speculative

                                  3.2M
                                 SF Total Under
                                  Construction

                               79% Build-to-Suit                                           Vacancy Rate (%)     Net Absorption (SF)   New Supply (SF)

                                                              Significant Transactions

                                                                       Sale                      Lease
                                                                   8801 88th Ave            1570 International Dr
                                                                   Pleasant Prairie           Mount Pleasant
                                                                    $35,000,000                  75,233 SF
Total Deliveries SF   Under Construction SF
                                                                        Buyer                      Tenant
                                                              Pritzker Realty Group, LLC     Ryder Last Mile Inc.

                                                                                                                                                   9
Lake Submarket Overview
County Vacancy
Rate
Total
Inventory
(SF)
Net
Absorption
YTD Net
Absorption
Under
Construction
(SF)
New
Supply
(SF)
New
Leases
(SF)
Current Quarter Q221 5.67% 75,418,385 -147,766 -9,475 1,261,739 0 695,380
Previous Quarter Q121 6.77% 75,401,550 138,291 138,291 911,296
Kenosha
Regional
1,610,447 754,125
Airport
Previous Year Q220 4.97% 72,562,048 166,996 229,771 2,596,704 0
KENOSHA 555,502
PLEASANT PRAIRIE
Westosha
Airport
Vacancy Rate Net Absorption Wisconsin
5.67% -148K SF 173
Illinois
173
83 ZION
After seven consecutive quarters of increasing vacancy, the Waukegan 137
Regional Airport
Lake County submarket recorded a 5.67 percent vacancy rate 45 94
FOX LAKE
at mid-year, decreasing 110 basis points from the previous
GURNEE
quarter. 41 WAUKEGAN
MCHENRY GRAYSLAKE
The submarket recorded -147,766 square feet of net 21 NORTH
CHICAGO
absorption on the quarter, bringing year-to-date net absorption 12
to -9,475 square feet.
LIBERTYVILLE
176
MUNDELEIN
New leasing activity totaled 695,380 square feet in the second 176
60
CRYSTAL LAKE LAKE FOREST
quarter, increasing 25.2 percent year-over-year from 555,502 VERNON HILLS 60
square feet of deals signed in the second quarter of 2020.
41
Year-to-date new leasing activity in the submarket is more than LAKE ZURICH 22 22
HIGHLAND PARK
1.4 million square feet. BUFFALO
GROVE
Construction activity in the Lake County submarket jumped
GLENCOE
to nearly 1.3 million square feet at mid-year, a 38.5 percent Chicago
CARPENTERSVILLE PALATINE Executive
increase from the 911,296 square feet recorded in the first Airport
quarter. The submarket currently has a more restrained EAST
DUNDEE ARLINGTON 294
development environment than mid-year 2020, as nearly 2.6 HEIGHTS MORTON
HOFFMAN90 GROVE
million square feet of development was in the construction ESTATES 94
ELGIN
pipeline one year ago. SCHAUMBURG DES PLAINES
NILES SKOKIE
290 ELK GROVE
Vacancy Rate, Net Absorption SOUTH ELGIN
BARTLETT New Lease Transactions VILLAGE Ohare
Int'l Airport
BLOOMINGDALEWOOD DALE
Leasing Activity Q1 Q2 Q3 Q4
Vacancy Rate (%) Net Absorption (SF)
Q2 2021 INDUSTRIAL MARKET REPORT69,149 SF
NEW LE ASE
325 Marriott Drive | Lincolnshire, IL
Benchmark Products leased 69,148 square feet at the
manufacturing facility in Lincolnshire. The property, owned by
Marriott International, has a 36’ clear height, six exterior docks,
and one drive in door.
Construction Activity Blocks of Available Space
Three speculative facilities broke ground during the
second quarter, totaling more than 350,000 square feet.
Two developments in Vernon Hills accounted for 74.3
percent of this new activity.
Panattoni continued work on Building D of the South Lake
Industrial Center in Vernon Hills. The 355,643-square-foot
distribution center plans to deliver in the second half of
2021.
Submarket Snapshot
100% Speculative
1.3M
SF Total Under
Construction
0% Build-to-Suit Vacancy Rate (%) Net Absorption (SF) New Supply (SF)
Significant Transactions
Sale Lease Sublease
300 Genesee St 325 Marriot Dr 900-950 Busch Pkwy
Lake Zurich Lincolnshire Buffalo Grove
$12,030,000 69,149 SF 64,685 SF
Total Deliveries SF Under Construction SF
Buyer Tenant Tenant
CubeSmart, LP Benchmark Products Malnati Organization
11I-90 Submarket Overview
FOX LAKE
Northwest Vacancy
Rate
Total
Inventory
(SF)
Net
Absorption
YTD Net
Absorption
Under
Construction
(SF)
MCHENRY
New
Supply
(SF)
New
Leases
(SF)
Current Quarter Q221 7.34% 33,651,156 483,319 686,345 162,888 45,000 947,275
Previous Quarter Q121 8.34% 33,539,078 203,026 203,026 135,000 230,829 1,085,216
CRYSTAL LAKE
Previous Year Q220 6.24% 31,929,235 -485,085 -253,774 813,283 349,080 266,959
LAK
Vacancy Rate Net Absorption
7.34% 483K SF
31
HUNTLEY 25 BAR
CARPENTERSVILLE
HAMPSHIRE 90
72 WEST EAST
The total vacancy rate in the I-90 Northwest submarket fell DUNDEE DUNDEE
100 basis points in the second quarter of 2021, moving from
47
the 8.34 percent recorded in the first quarter of 2021 to the HOFFMAN9
20
7.34 percent rate recorded at mid-year. ELGIN ESTATES
SCH
There was 483,319 square feet of net absorption during 31
the second quarter in the I-90 Northwest submarket. The SOUTH ELGIN
BARTLETT
submarket has recorded positive net absorption for three
consecutive quarters. The biggest move-ins at mid-year BLOO
include Toynk Toys occupying over 285,000 square feet in
Gilberts, and Shaw Industries occupying nearly 165,000 Dupage
Airport
square feet in Elgin. ST CHARLES
GENEVA
New leasing activity remained strong in the submarket, as WEST CHICAGO
947,275 square feet new deals signed second quarter. Deals
in Elgin spurred the quarter’s strength in leasing, as SureWerx BATAVIA
USA signed for nearly 156,000 square feet at the Fox River
Business Center and Encore Repair leased over 105,000 NORTH AURORA
square feet at Northwest Corporate Park. 88
NAPERVILL
SUGAR GROVE
AURORA
Vacancy Rate, Net Absorption New Lease Transactions
Leasing Activity Q1 Q2 Q3 Q4
Vacancy Rate (%) Net Absorption (SF)
Q2 2021 INDUSTRIAL MARKET REPORT326,272 SF NEW LE ASE
3451 Bath Rd | Elgin, IL
Discount Tires leased the single-tenant facility in Elgin during
the second quarter. The Class B distribution center delivered in
2020. It has a clear height of 36’ with 66 exterior docks.
Construction Activity Blocks of Available Space
The Lot 19 build-to-suit facility in the Prairie Lake
Business Park delivered during the second quarter.
Yulivan Holdings occupied the 45,000 square-foot facility.
Three build-to-suit facilities are scheduled to deliver in
the second half of 2021 in the I-90 Northwest submarket.
The trio will add nearly 118,000 square feet to the
submarket’s inventory.
28% Speculative Submarket Snapshot
163K
SF Total Under
Construction
72% Build-to-Suit
Vacancy Rate (%) Net Absorption (SF) New Supply (SF)
Significant Transactions
Sale Lease Lease
2500 Galvin Dr 3451 Bath Rd 305-325 Corporate Dr
Elgin Elgin Elgin
$47,630,000 326,272 SF 155,768 SF
Total Deliveries SF Under Construction SF
Buyer Tenant Tenant
High Street Logistics Discount Tire SureWerx Usa, Inc.
Properties, LLC
13Northwest Submarket Overview
Cook Vacancy
Rate
Total
Inventory
(SF)
Net
Absorption
YTD Net
Absorption
Under
Construction
(SF)
New
Supply
(SF)
New
Leases
(SF)
Current Quarter Q221 6.77% 24,435,331FOX LAKE
-6,581 -42,827 1,114,481 0 206,911
GURNEE
Previous Quarter Q121 6.59% 24,311,708 -36,246 -36,246 864,931 0 WAUKEGAN
251,651
MCHENRY GRAYSLAKE
Previous Year Q220 5.85% 23,911,861 46,034 155,290 188,433 151,000 374,616
NORTH
CHICAGO
94
LIBERTYVILLE
MUNDELEIN
Vacancy Rate Net Absorption
6.77% -6K SF
CRYSTAL LAKE LAKE FOREST
VERNON HILLS
LAKE ZURICH
The total vacancy rate in the Northwest Cook submarket was HIGHLAND PARK
BUFFALO
6.77 percent at mid-year, increasing for the sixth consecutive
GROVE
quarter. The second quarter rate is 18 basis points higher
BARRINGTON
compared to the 6.59 percent rate recorded in the first 68 53
GLENCO
quarter. 14 Chicago
PALATINE Executive
59 Airport
12
The Northwest Cook submarket recorded negative net EAST 62
DUNDEE ARLINGTON 294
absorption for the second consecutive quarter, as -6,581 HEIGHTS
HOFFMAN
90 MORTON
MT. PROSPECT GROVE
square feet of space returned to the market in the second
ELGIN 58 ESTATES 94
quarter. Year-to-date net absorption fell to -42,827 square feet SCHAUMBURG
72
DES PLAINES
NILES SK
for the submarket. 20 19
STREAMWOOD 290 ELK GROVE
SOUTH ELGIN VILLAGE Ohare
There was 206,911 square feet of new leasing activity in Int'l Airport
BARTLETT
the submarket in the second quarter. New leasing activity
BLOOMINGDALEWOOD DALE
decreased 17.8 percent quarter-over-quarter compared to the
251,651 square feet of new leasing activity recorded in the first Dupage 294
FRANKLIN PARK
Airport
quarter. ST CHARLES
ELMHURST MELROSE
355
More than 1.1 million square feet remains under construction GENEVA WEST CHICAGO
PARK
OAK PARK
in the Northwest Cook submarket. All four projects are
scheduled to deliver in the second half of 2021. BATAVIA
88 CICERO
NORTH AURORA 55
Vacancy Rate, Net Absorption New Lease
88 Transactions
DOWNERS
GROVE
LA GRANGE
NAPERVILLE C
A
BURR
AURORA RIDGE BEDFORD PA
Leasing Activity Q1 Q2 Q3 Q4
Vacancy Rate (%) Net Absorption (SF)
Q2 2021 INDUSTRIAL MARKET REPORT$4,350,000 SALE
735 Remington Road | Schaumburg
Yamazen sold their warehouse in Schaumburg to GSG
Developers for $4.35 million, or $81.63 per square foot. NAI
Hiffman represented the seller in the transaction.
Construction Activity Blocks of Available Space
A speculative facility located at 3125 N Barrington Rd
in Hoffman Estates began construction in the second
quarter. The 249,550 square-foot building plans to deliver
at the end of the year.
Three additional speculative facilities remain under
construction in the Northwest Cook submarket. The trio
will add nearly 865,000 square feet to the submarket’s
inventory by the end of the year.
Submarket Snapshot
100% Speculative
1.1M
SF Total Under
Construction
0% Build-to-Suit Vacancy Rate (%) Net Absorption (SF) New Supply (SF)
Significant Transactions
Sale Renewal Lease
735 Remington Rd 1555-1559 Basswood 2401 Hassell Rd
Schaumburg Schaumburg Hoffman Estates
$4,350,000 33,229 SF 26,006 SF
Total Deliveries SF Under Construction SF
Buyer Tenant Tenant
GSG Developers Novaspect NIDEC Motor Corporation
15North
Waukegan
Regional Airport
Submarket Overview
Cook
FOX LAKE
GURNEE
Vacancy
Total Net WAUKEGAN
YTD Net Under New New
Rate
Inventory Absorption Absorption Construction Supply Leases
GRAYSLAKE(SF) (SF) (SF) (SF)
NORTH
Current Quarter Q221 4.00% 45,936,879 9,082 269,369 0 27,000 243,327
CHICAGO
Previous Quarter Q121 4.04% 45,779,607 260,287 260,287 27,000 0 234,493
Previous Year Q220 4.36% LIBERTYVILLE
45,518,565 47,308 -69,731 170,000 0 91,156
MUNDELEIN
LAKE FOREST
VERNON HILLS
94
Vacancy Rate Net Absorption
4.00% 9K SF LAKE ZURICH
BUFFALO
HIGHLAND PARK
GROVE
Total vacancy in the North Cook submarket was relatively
unchanged in the second quarter, decreasing only fourBARRINGTON
basis WHEELING 68 GLENCOE
points quarter-over-quarter to 4.00 percent, down from the 21
Chicago
NORTHBROOK
4.04 percent rate recorded in the first quarter of 2021. The PALATINE Executive
Airport
vacancy rate has decreased 36 basis points year-over-year 43
from the 4.36 percent rate recorded at mid-year 2020. ARLINGTON 294
90 HEIGHTS MORTON
HOFFMAN
Net absorption in the second quarter totaled 9,082 square feet MT. PROSPECT GROVE EVANSTON
58
ESTATES 94
– the second consecutive quarter of positive net absorption 14
DES PLAINES
for the submarket. Cumulative net absorption standsSCHAUMBURG
41
at 290 NILES SKOKIE
PARK
269,369 square feet through the first sixSTREAMWOOD
months of 2021. ELK GROVE RIDGE LINCOLNWOOD
Notable move-ins on the quarter include: SCP Distributors
BARTLETT VILLAGE Ohare
Int'l Airport
occupying 30,900 square feet in Niles and Beshet occupying
20,060 square feet in Skokie. BLOOMINGDALEWOOD DALE
There was 243,327 square feet of new leasing activity in the
FRANKLIN PARK 90
second quarter in the North Cook submarket. New leasing
94
activity increased 3.8 percent quarter-over-quarter compared
ELMHURST MELROSE
to the 234,493 square feet of new leasing activity recorded in 355
PARK
the first quarter of 2021. WEST CHICAGO OAK PARK
290
CHICA
88 CICERO
Vacancy Rate, Net Absorption New Lease294Transactions
DOWNERS 55
88 LA GRANGE
GROVE
NAPERVILLE Chicago Midway
Airport
BURR
RIDGE
Leasing Activity Q1 Q2 Q3 Q4
Vacancy Rate (%) Net Absorption (SF)
Q2 2021 INDUSTRIAL MARKET REPORT179,201 SF SALE
3500 Oakton St | Niles, IL
ROC Inc. sold their 179,000 square-foot warehouse in Skokie
as part of a six-property portfolio to Heitman and CubeSmart for
over $14.7 million dollars, or $82.10 per square foot.
Construction Activity Blocks of Available Space
ABT Electronics delivered their 27,000 square-foot build-to-
suit recycling center facility in Glenview during the second
quarter.
Submarket Snapshot
No Construction
Currently Underway
Vacancy Rate (%) Net Absorption (SF) New Supply (SF)
Significant Transactions
Sale Lease Renewal
3500 Oakton St 6440 W Howard St 7460 N Lehigh Ave
Niles Niles Niles
$14,712,259 148,770 SF 105,000 SF
Total Deliveries SF Under Construction SF
Buyer Tenant Tenant
Heitman | CubeSmart, LP GHP Group, Inc Johnson & Quin, Inc.
17Fox Submarket Overview
Valley Vacancy
Rate
Total
Inventory
(SF)
Net
Absorption
YTD Net
Absorption
Under
Construction
(SF)
New
Supply
(SF)
New
Leases
(SF)
Current Quarter Q221 4.49% 37,587,512 119,749 638,254 1,513,267 0 594,375
Previous Quarter Q121 3.93% 37,436,289 518,505 518,505 1,392,614 0 361,507
Previous Year Q220 6.15% 36,486,218 52,993 257,041 750,780 28,500 83,445
LAKE ZURICH
BARRINGTON
90
Vacancy Rate Net Absorption HAMPSHIRE PALATINE
4.49% 120K SF EAST
DUNDEE
90
ARLINGT
HEIGHT
HOFFMAN
ESTATES
There was 119,749 square feet of net absorption in the ELGIN
SCHAUMBURG
Fox Valley in the second quarter, increasing 126.0 percent 290
STREAMWOOD ELK GR
year-over-year compared to the 52,993 square feet of net SOUTH ELGIN
BARTLETT VILLA
absorption recorded in the second quarter of 2020. Fox Valley
BLOOMINGDALEWOOD DA
has had six consecutive quarters of positive net absorption. In 31
25
addition, cumulative net absorption was 638,254 square feet 47
64
Dupage
59
Airport
ST CHARLES
at mid-year, up from the 257,041 square feet of net absorption 38
64
ELMH
355
the submarket recorded through the first six months of 2020. GENEVA
WEST CHICAGO
The total vacancy rate in the submarket was 4.49 percent BATAVIA
38
in the second quarter, increasing 56 points from the 3.93
percent recorded during the first quarter. Despite this NORTH AURORA
88 DOWNERS
GROVE
increase, the vacancy rate decreased 166 basis points year- NAPERVILLE
SUGAR GROVE
over-year from the 6.15 percent rate recorded at mid-year AURORA
2020.
MONTGOMERY
There was 594,375 square feet of new leasing activity signed BOLINGBROOK
in the Fox Valley submarket in the second quarter. Cumulative
LEMONT
new leasing activity totaled nearly 956,000 square feet
55
through the first six months of 2021. ROMEOVILLE
PLAINFIELD
355
Vacancy Rate, Net Absorption New Lease Transactions
Vacancy Rate (%) Net Absorption (SF) Leasing Activity Q1 Q2 Q3 Q4
Q2 2021 INDUSTRIAL MARKET REPORT274,400 SF
R E N E WA L
101-121 N. Raddant Road | Batavia, IL
Blue Wave Products fully-leased the Batavia Industrial Center.
The pool and home leisure manufacturing and distribution
company will occupy the Class B manufacturing facility in the
fourth quarter.
Construction Activity Blocks of Available Space
Greco Reggi Real Estate Development continued work
on two separate facilities in West Chicago in the second
quarter:
A 300,780 square-foot warehouse at 2595 Enterprise
Circle is expected to deliver in the third quarter and is
pre-leased to Cheese Merchants of America.
A 501,048-square-foot speculative distribution facility on
Enterprise Circle. The building is also slated to deliver in
the third quarter.
Submarket Snapshot
80% Speculative
1.5M
SF Total Under
Construction
Vacancy Rate (%) Net Absorption (SF) New Supply (SF)
20% Build-to-Suit
Significant Transactions
Sale Renewal Lease
1700 Western Dr 101-121 N Raddant Rd 1750 Downs Dr
West Chicago Batavia West Chicago
$5,000,000 274,400 SF 200,742 SF
Total Deliveries SF Under Construction SF
Buyer Tenant Tenant
MAPEI Corporation Blue Wave Products, Inc. FXI Holdings, Inc.
19DeKalb Submarket Overview
County Vacancy
Rate
Total
Inventory
(SF)
Net
Absorption
YTD Net
Absorption
Under
Construction
(SF)
New
Supply
(SF)
New
Leases
(SF)
Current Quarter Q221 4.65% 12,629,543 -1,370 63,230 2,567,000 0 0
CHERRY
Previous Quarter Q121 4.65% 12,628,173
VALLEY 64,600 64,600 2,567,000 0 0
Previous Year Q220 4.15% 12,860,779 27,120 -15,367 1,600,000 0 54,572
90
HAMPSHIRE
Vacancy Rate Net Absorption 39 KIRKLAND
72
GENOA
4.65% -1K SF
DeKalb County’s total vacancy rate was 4.65 percent at mid-
64
year. The vacancy rate remained unchanged from the 4.65 SYCAMORE
percent recorded in the first quarter. This rate is 50 basis
points higher than the DeKalb County submarket rate recorded
38 DEKALB
during the second quarter of 2020, at 4.15 percent. While ROCHELLE
vacancy has increased 50 basis points year-over-year from the 88
4.15 percent rate recorded at mid-year 2020, the submarket’s
vacancy rate remains tighter in comparison to the overall
Chicago industrial vacancy rate of 5.28 percent.
23
There was -1,370 square feet of net absorption in DeKalb
County in the second quarter. Despite this nominal amount of
SHABBONA 30 HINCKLEY
space returning to the submarket, cumulative net absorption SUGAR GROV
was 63,230 square feet in the first half of 2021. While modest,
this figure outpaced the -15,367 square feet of net absorption
recorded through the first six months of 2020. No new leasing
activity of consequence has occurred in the submarket
through the first half of 2021.
39 SANDWICH
Vacancy Rate, Net Absorption New Lease Transactions
Vacancy Rate (%) Net Absorption (SF) Leasing Activity Q1 Q2 Q3 Q4
Q2 2021 INDUSTRIAL MARKET REPORT64,400 SF
AVA I L A B I L I T Y
1104-1120 E Oak St | DeKalb, IL
MPE Business Forms has up to 64,400 square feet available in
their warehouse facility in DeKalb. The Class C building, which
was built in 1897, has a 18' clear height with three exterior
docks and five drive in doors.
Construction Activity Blocks of Available Space
Facebook's 12th U.S. data center is currently under
construction in DeKalb. The 907,000-square-foot build-
to-suit will be located at the ChicagoWest Business
Center.
Trammell Crow Company continued construction on the
build-to-suit development for Ferrara Candy in DeKalb.
The nearly 1.7-million-square-foot distribution facility on
Gurler Rd is slated to deliver in the second half of 2021.
0% Speculative Submarket Snapshot
2.6M
SF Total Under
Construction
100% Build-to-Suit
Vacancy Rate (%) Net Absorption (SF) New Supply (SF)
Significant Transactions
Sale Sale
421-469 N California St 711 Fairview Dr
Sycamore DeKalb
$3,500,000 $9,850,000
Total Deliveries SF Under Construction SF
Buyer Tenant
Innovative Growers Zilber Property Group
Equipment
21Central Submarket
MUNDELEIN Overview
DuPage
CRYSTAL LAKE LAKE FOREST
VERNON HILLS
Vacancy Total Net YTD Net Under New New
Rate Inventory Absorption Absorption
LAKE Construction
ZURICH Supply Leases
(SF) (SF) (SF) (SF)
HIGHLAND
BUFFALO
Current Quarter Q221 4.10% 77,036,469 461,040 827,148 1,170,047 0 751,106
GROVE
Previous Quarter Q121 4.61% 77,252,150 366,108 BARRINGTON
336,108 969,487 400,000 1,039,074
90
Previous Year Q220 4.66% 76,075,000 548,722 599,098 1,760,600 0 Chicago 138,112
HAMPSHIRE PALATINE Executive
Airport
EAST
DUNDEE ARLINGTON 294
90 HEIGHTS MORTON
HOFFMAN MT. PROSPECT GROVE
Vacancy Rate Net Absorption ESTATES
ELGIN
4.10% 461K SF STREAMWOOD
SCHAUMBURG
290
ELK GROVE
DES PLAINES
NILE
SOUTH ELGIN VILLAGE Ohare
Total vacancy in the Central DuPage submarket was 4.10 53 Int'l Airport
BARTLETT 19
percent at mid-year. The vacancy rate decreased 56 basis 20
points year-over-year from the 4.66 percent vacancy rate BLOOMINGDALE WOOD DALE
recorded at mid-year 2020.
Dupage
GLENDALE ADDISON FRANKLIN PARK
Airport
There was 461,040 square feet of net absorption in the ST CHARLES HEIGHTS
submarket in the second quarter. This figure increased CAROL ELMHURST 64
MELROSE
355
GENEVA STREAM PARK
37.2 percent quarter-over-quarter from the 336,108 square WEST CHICAGO 83 OAK
feet of net absorption tallied in the first quarter. Cumulative GLEN ELLYN LOMBARD
net absorption was 827,148 square feet at mid-year, a 38.1 BATAVIA
88 CIC
percent improvement from the 599,098 square feet the 294
submarket recorded in the first half of 2020. NORTH AURORA
88 DOWNERS
LA GRANGE
GROVE
There was 751,106 square feet of new leasing activity in NAPERVILLE
the submarket on the quarter. While this was the sixth-best BURR
SUGAR GROVE
performing submarket with respect to new leasing activity AURORA RIDGE BEDF
on the quarter, the submarket saw a 27.7 percent decrease WOODRIDGE
MONTGOMERY BRI
quarter-over-quarter from the 1,039,074 square feet of new
leasing activity recorded in the first three months of 2021.
BOLINGBROOK
There are currently eight properties under construction in the
LEMONT
Central DuPage submarket, totaling more than 1.17 million
square feet. 55
ROMEOVILLE
Vacancy Rate, Net Absorption NewPLAINFIELD
Lease Transactions
355
Leasing Activity Q1 Q2 Q3 Q4
Vacancy Rate (%) Net Absorption (SF)
Q2 2021 INDUSTRIAL MARKET REPORT360,709 SF LE ASE
1600 Central Avenue | Roselle, IL
Signode Corporation signed a new lease for 360,709 square
feet at 1600 Central Ave in Roselle. The Prologis-owned facility
has a 28’ clear height with 20 exterior docks and 20 interior
docks. Signode is slated to occupy their space in the third
quarter.
Construction Activity Blocks of Available Space
Specialty Rolled Metals continued construction on their
100,000 square-foot property in Carol Stream. The
building is scheduled to deliver in the third quarter.
Sterling Bay began construction on its speculative facility
at 545 W Lamont Rd in Elmhurst in the second quarter.
The 150,010 square-foot infill development plans to
deliver in early 2022.
91% Speculative Submarket Snapshot
1.2M
SF Total Under
Construction
9% Build-to-Suit
Vacancy Rate (%) Net Absorption (SF) New Supply (SF)
Significant Transactions
Renewal/
Sale Lease Expansion
550 Center Ave 1600 Central Ave 1575 Hunter Rd
Carol Stream Roselle Hanover Park
$21,365,000 360,709 SF 288,366 SF
Total Deliveries SF Under Construction SF
Buyer Tenant Tenant
TA Realty Signode Corporation Sid Tool Company
23O'Hare
MCHENRY GRAYSLAKE
Submarket
NORTH Overview
CHICAGO
94
Vacancy Total LIBERTYVILLE
Net YTD Net Under New New
Rate Inventory Absorption Absorption Construction Supply Leases
(SF)MUNDELEIN (SF) (SF) (SF)
CRYSTAL LAKE Current Quarter Q221 4.85% 103,652,869 1,599,254 2,750,015 586,377FOREST
LAKE 317,513 2,983,042
VERNON HILLS
Previous Quarter Q121 6.11% 103,432,741 1,150,761 1,150,761 503,890 538,371 1,647,077
Previous Year Q220 7.61% 101,723,476 -432,943 -741,432 1,160,388 292,058 603,371
LAKE ZURICH
HIGHLAND PARK
BUFFALO
GROVE
Vacancy Rate Net Absorption BARRINGTON
4.85% 1.6M SF
GLENCOE
Chicago
PALATINE Executive
Airport
Net absorption in the O’Hare submarket was nearly 1.6 million
EAST
square feet in the second quarter, increasing
DUNDEE39.0 percent ARLINGTON 294
HEIGHTS
quarter-over-quarter from the nearly 1.2 million square feet
HOFFMAN
90
MT. PROSPECT MORTON
recorded in the first quarter. The submarket has seen fourESTATES GROVE EVANS
ELGIN 94
consecutive quarters of positive net absorption. O’Hare’s
SCHAUMBURG DES PLAINES
NILES
72
cumulative net absorption totaled more than 2.75 million 290 SKOKIE
45
square feet – the third-best performing submarketSTREAMWOOD
in Chicago, ELK GROVE
only trailing the I-55 CorridorSOUTH
and theELGIN
I-80/Joliet
BARTLETT Corridor. VILLAGE Ohare LINCOLNWOO
Int'l Airport
ITASCA
The total vacancy rate in the submarket was 4.85 percent at 83
mid-year, tightening 126 basis points from the 6.11 percent BLOOMINGDALEWOOD DALE 19
rate recorded in the first quarter. In addition, vacancy in 90
BENSENVILLE 94
O’Hare dipped below the 5.28 percent vacancy Dupage
Airport
rate recorded FRANKLIN PARK
in the industrial market overall at mid-year.
ST CHARLES
ELMHURST MELROSE
355
There was over 2.9 million square feet of new leasing activity PARK
WESTacross
in O’Hare during the second quarter, the leader CHICAGO
21 OAK PARK
290
industrial submarkets. Notably, Yahee Technologies leased
306,918 square feet at 1010 Foster Ave in Bensenville,
88 CICERO
Pregis leased 260,338 square feet at 971-991 Supreme Dr in
294
Bensenville, and Alliance Ground International leased 253,000
NORTH
square feet at 1717 Busse AURORA
Rd in Elk Grove Village. 88 DOWNERS 55
LA GRANGE
GROVE
NAPERVILLE
New Lease Transactions
Chicago Midway
Vacancy Rate, Net Absorption
Airport
BURR
RIDGE BEDFORD PARK
WOODRIDGE
BRIDGEVIEW
BOLINGBROOK
Leasing Activity Q1 Q2 Q3 Q4
Vacancy Rate (%) Net Absorption (SF)
Q2 2021 INDUSTRIAL MARKET REPORT$23,500,000 SALE
1600 Sherwin Avenue | Des Plaines, IL
Panattoni Development Company sold the warehouse in Des
Plaines in May to Black Creek Group for $23.5 million. The
Class A facility delivered in 2020 and was completely vacant at
the time of sale.
Construction Activity Blocks of Available Space
Alston Construction Company delivered the 317,513
square-foot manufacturing facility in Wood Dale for Nippon
Express in the second quarter.
Brennan Investment Group continued construction on the
Microsoft Data Center in Elk Grove Village. The 400,000
square foot facility plans to deliver by year-end.
32% Speculative Submarket Snapshot
586K
SF Total Under
Construction
68% Build-to-Suit
Vacancy Rate (%) Net Absorption (SF) New Supply (SF)
Significant Transactions
Sale Renewal Lease
1600 Sherwin Ave 251 Wille Rd 1010 Foster Ave
Des Plaines Des Plaines Bensenville
$23,500,000 333,988 SF 306,918 SF
Total Deliveries SF Under Construction SF
Buyer Tenant Tenant
Black Creek Group Bombardier Transportation Yahee Technologies Corp.
Corporation
25West LIBERTYVILLE
Submarket Overview
Cook
MUNDELEIN
Vacancy Total Net LAKE FORESTUnder
YTD Net New New
VERNON HILLS
Rate Inventory Absorption Absorption Construction Supply Leases
(SF) (SF) (SF) (SF)
LAKE ZURICH
Current Quarter Q221 4.25% 61,419,527 -144,203 -519,162 1,248,377 0 296,315
HIGHLAND PARK
Previous Quarter Q121 4.15% 61,410,856 BUFFALO
-374,959 -374,959 827,301 0 401,688
GROVE
Previous Year Q220 6.27% 61,309,587 177,696 1,133,101 0 223,703 187,977
BARRINGTON
GLENCOE
Chicago
PALATINE Executive
Airport
Vacancy Rate Net Absorption ARLINGTON 294
4.25% -144K SF
90 HEIGHTS MORTON
HOFFMAN MT. PROSPECT GROVE EVANSTON
ESTATES 94
SCHAUMBURG DES PLAINES
290 NILES SKOKIE
The total vacancy rate in the West Cook submarket was 4.25
STREAMWOOD ELK GROVE
percent at mid-year. Vacancy has tightened 202 basis points VILLAGE Ohare LINCOLNWOOD
year-over-year from the 6.27 percent rate recorded at mid-year
Int'l Airport
2020. While the submarket’s fortunes have improved over the
BLOOMINGDALEWOOD DALE SCHILLER
course of the past year with respect to vacancy, an additional PARK
19
90
1.2 million square feet of speculative development in the FRANKLIN PARK
94
pipeline could push vacancy higher in the second half of the 45 43
year if delivered vacant. ELMHURST MELROSE
20
64
355
PARK
WEST CHICAGO OAK PARK
Two speculative developments broke ground in the West Cook 290
submarket in the second quarter, adding another 421,076 CHICAGO
square feet to the development pipeline. 88 CICERO
294
There was -144,203 square feet of net absorption in the DOWNERS 55
88 LA GRANGE
West Cook submarket in the second quarter, the second GROVE
NAPERVILLE Chicago Midway
consecutive quarter of negative net absorption for the Airport
BURR
submarket. Cumulative net absorption on the year was BEDFORD PARK
RIDGE
-519,162 square feet. WOODRIDGE
BRIDGEVIEW
There was 296,315 square feet of new leasing activity in the
submarket in the second quarter. This was a 57.6 percentBOLINGBROOK
improvement year-over-year from the 187,977 square feet of 57
294
ALSIP
new leasing activity recorded in the second quarter of 2020. LEMONT
94
Vacancy Rate, Net Absorption 55 New Lease Transactions BLUE ISLAND
ROMEOVILLE
PLAINFIELD
Leasing Activity Q1 Q2 Q3 Q4
Vacancy Rate (%) Net Absorption (SF)
Q2 2021 INDUSTRIAL MARKET REPORT$84,000,000 SALE
400 N. Wolf Road | Northlake, IL
CenterPoint Properties sold the food processing building in
Northlake to Apollo Global Management for $84.0 million in
June. The building was 100.0 percent leased at the time of the
sale.
Construction Activity Blocks of Available Space
Duke Realty Corporation broke ground on a 299,520
square-foot distribution facility in Bellwood during
the second quarter. The speculative development is
scheduled to deliver in 2022.
Five other speculative developments remain under
construction in the West Cook submarket. These five
buildings will add close to 950,000 square feet to the
submarket by early 2022.
100% Speculative Submarket Snapshot
1.2M
SF Total Under
Construction
0% Build-to-Suit
Vacancy Rate (%) Net Absorption (SF) New Supply (SF)
Significant Transactions
Sale Lease Lease
400 N Wolf Rd 9300 King St 2800 W Lake St
Northlake Franklin Park Melrose Park
$84,000,000 99,076 SF 77,116 SF
Total Deliveries SF Under Construction SF
Buyer Tenant Tenant
Apollo Global Management A-1 Handling LLC Envoy Logistics, Inc.
27Chicago Submarket Overview
Vacancy Total Net YTD Net Under New New
Rate Inventory Absorption Absorption Construction Supply Leases
(SF) (SF) (SF) (SF)
GLENCOE
Chicago
Current Quarter Q221
PALATINE 6.27% 177,879,142
Executive 45,978 -753,246 1,676,182 999,900 478,234
Airport
Previous Quarter Q121 6.46% 178,494,376 -799,224 -799,224 2,526,082 0 1,265,334
ARLINGTON 294
Previous Year Q220 5.02%
HEIGHTS 175,185,383 -697,301
MORTON -379,460 1,236,788 527,879 1,193,735
MT. PROSPECT GROVE EVANSTON
94
SCHAUMBURG DES PLAINES
290 NILES SKOKIE
ELK GROVE
VILLAGE
Vacancy Rate Net Absorption Ohare
Int'l Airport 41
6.27% 46K SF BLOOMINGDALEWOOD DALE CHICAGO NORTH
50
294
FRANKLIN PARK 90
The total vacancy rate in Chicago was 6.27 percent at 41
94
mid-year. Vacancy decreased 19 basis points quar ter-over- ELMHURST 64
355 MELROSE
quar ter from the 6.46 percent rate tallied in the first quar ter. PARK
OAK PARK
290
The City of Chicago recorded 45,978 square feet of
net absorption in the second quar ter. Notable move-ins 88 CICERO
include Frozen Assets Cold Storage occupying 154,715
square feet at 2635 S Western Ave and Aviation InstituteDOWNERS 55 41
LA GRANGE
GROVE
of Maintenance occupying 137,922 square feet at 3711 S Chicago Midway
Airport CHICAGO
Ashland Ave. BURR SOUTH
RIDGE BEDFORD PARK
The cumulative -753,246 square feet of net absorption BRIDGEVIEW
in the City of Chicago in the first half of 2021 was nearly
12 20
double as compared to the -379,460 square feet of space
BOLINGBROOK
that returned to the market in the first half of 2020. 57 90
LEMONT 294 ALSIP
There was 478,234 square feet of new leasing activity in PALOS 94
BLUE ISLAND
Chicago in the second quar ter. This represented a 59.9 HEIGHTS
ROMEOVILLE
percent decrease year-over-year compared to the nearly
1.2 million square feet of new leasing activity tallied in the355 Gary/C
SOUTH
second quar ter of 2020. Despite this decrease in new HAMMOND
HOLLAND
leasing activity, year-to-date new leasing activity totaled 1.7 TINLEY PARK 80
million square feet at mid-year.
80
Vacancy Rate, Net Absorption JOLIET New MOKENA
Lease Transactions
57
MATTESON CHICAGO
HEIGHTS
30
PARK FOREST
Vacancy Rate (%) Net Absorption (SF) Leasing Activity Q1 Q2 Q3 Q4
Q2 2021 INDUSTRIAL MARKET REPORT$35,000,000 SALE
3000 W. 51st Street | Chicago, IL
Ryerson sold the Central Steel & Wire Company property to
Amazon. The manufacturing facility, built in 1937, sold for $35.0
million. Central Steel will continue to occupy the property until it
is redeveloped. “Construction is anticipated to begin in 2023,”
according to an Amazon spokesperson.
Construction Activity Blocks of Available Space
Hilco Real Estate delivered the 999,900 square-foot
Target facility in the second quarter located at 3501 S
Pulaski Rd.
Four speculative buildings remained under construction in
Chicago at mid-year, totaling more than 1.4 million square
feet. All four facilities are scheduled for delivery before
the end of the year.
Submarket Snapshot
84% Speculative
1.7M
SF Total Under
Construction
16% Build-to-Suit
Vacancy Rate (%) Net Absorption (SF) New Supply (SF)
Significant Transactions
Sale Lease Lease
3000 W 51st St 4444 S Kildare Ave 4249 W Diversey Ave
Chicago Chicago Chicago
$35,000,000 62,500 SF 61,000 SF
Total Deliveries SF Under Construction SF Buyer Tenant Tenant
Amazon Kinexx Modular Construction Deal Genius, Inc.
29I-88 Submarket Overview
Corridor Vacancy
Rate
Total
Inventory
(SF)
Net
Absorption
YTD Net
Absorption
Under
Construction
(SF)
New
Supply
(SF)
New
Leases
(SF)
MUNDELEIN
CRYSTAL LAKE LAKE FOREST
VERNON HILLS
Current Quarter Q221 4.65% 70,827,433 947,696 1,544,584 340,193 0 835,089
Previous Quarter Q121 5.67% 70,878,758 596,888 596,888 87,000LAKE ZURICH 0 1,240,556
HIGHLAND
BUFFALO
GROVE
Previous Year Q220 10.12% 70,655,679 -302,296 -235,045 0 0 928,760
BARRINGTON
90 GL
Chicago
HAMPSHIRE PALATINE Executive
Airport
EAST
DUNDEE ARLINGTON 294
HOFFMAN
90 HEIGHTS MORTON
MT. PROSPECT GROVE
Vacancy Rate Net Absorption ELGIN ESTATES
SCHAUMBURG DES PLAINES
4.65% 948K SF
290 NILES
STREAMWOOD ELK GROVE
SOUTH ELGIN BARTLETT VILLAGE Ohare
Int'l Airport
BLOOMINGDALEWOOD DALE
The total vacancy rate in the I-88 Corridor was 4.65 percent Dupage 294
FRANKLIN PARK
Airport
ST CHARLES
at mid-year, tightening 547 points year-over-year from the ELMHURST MELROSE
GENEVA 355
10.12 percent rate recorded in the second quarter of 2020. WEST CHICAGO
PARK
OAK
In addition, this rate is 102 basis points tighter from the 5.67 BATAVIA
88 CICE
percent rate recorded in the first quarter. 56
56
83
NORTH AURORA DOWNERS
88 GROVE
LA GRANGE
59 NAPERVILLE
There was 947,696 square feet of net absorption in the
31
25 53
SUGAR GROVE BURR
AURORA RIDGE BEDFO
I-88 Corridor in the second quarter. Year-to-date, there 34
MONTGOMERY BRID
was 1,544,584 square feet of net absorption, a substantial 30
turnaround from the -235,045 square feet of net absorption BOLINGBROOK
29
recorded in the submarket in the first half of 2020. LEMONT
PALOS
55 HEIGHTS
ROMEOVILLE
There was 835,089 square feet of new leasing activity in PLAINFIELD
355
the I-88 Corridor in the second quarter. While this was the
TINLEY PAR
fifth-best performing submarket with respect to new leasing
80
activity on the quarter, the submarket recorded a 10.1 percent JOLIET
MOKENA
SHOREWOOD
decrease year-over-year compared to the 928,760 square
feet of new leasing activity recorded in the second quarter of
2020. MINOOKA
ELWOOD
80
Vacancy Rate, Net Absorption New Lease Transactions
Leasing Activity Q1 Q2 Q3 Q4
Vacancy Rate (%) Net Absorption (SF)
Q2 2021 INDUSTRIAL MARKET REPORT695,948 SF LE ASE
900 Knell Road | Montgomery, IL
DSV Air & Sea leased 695,948 square feet at the CenterPoint
88 Industrial Center in Montgomery. The distribution facility has
a 28’ clear height with 47 exterior docks and 32 interior docks.
Construction Activity Blocks of Available Space
Construction began on three speculative developments in
the I-88 Corridor in the second quarter. DRG and Crow
Holdings are developing two of the sites on Enterprise Rd
in Aurora. The three facilities will add a total of 340,193
square feet to the submarket’s inventory when they
respectively deliver at year-end 2021.
100% Speculative Submarket Snapshot
340K
SF Total Under
Construction
0% Build-to-Suit
Vacancy Rate (%) Net Absorption (SF) New Supply (SF)
Significant Transactions
Sale Lease Renewal
1103 Butterfield Rd 900 Knell Rd 800 Bilter Rd
Aurora Montgomery Aurora
$12,400,000 695,948 SF 592,539SF
Total Deliveries SF Under Construction SF
Buyer Tenant Tenant
Dalfen Industrial DSV Air & Sea, Inc. DSV Air & Sea, Inc.
31Southwest
LAKE ZURICH
BUFFALO
HIGHLAND PARK Submarket Overview
Cook
GROVE
BARRINGTON
Vacancy Total Net YTD Net GLENCOE
Under New New
Rate Inventory Absorption
Chicago
Absorption Construction Supply Leases
PALATINE (SF) Executive (SF) (SF) (SF)
Airport
Current Quarter Q221 2.97% 37,435,472 107,296 181,446 0 0 111,942
ARLINGTON 294
Previous Quarter Q121 2.70% 37,434,622 74,150 74,150 0 0 626,710
HEIGHTS
HOFFMAN
90
MT. PROSPECT MORTON
Previous Year Q220 3.40% 37,043,358 548,803 GROVE
661,549 0 EVANSTON
0 422,402
ESTATES 94
SCHAUMBURG DES PLAINES
290 NILES SKOKIE
STREAMWOOD ELK GROVE
VILLAGE Ohare LINCOLNWOOD
Int'l Airport
Vacancy Rate Net Absorption ITASCA
2.97% 107K SF BLOOMINGDALE WOOD DALE
90
BENSENVILLE 94
The vacancy rate in the Southwest Cook submarket was FRANKLIN PARK
2.97 percent at mid-year. Vacancy increased 27 basis points
ELMHURST MELROSE
quarter-over-quarter from the 2.70 percent rate tallied in the 355
PARK
WEST CHICAGO
first quarter. However, vacancy decreased 43 basis points OAK PARK
290
year-over-year from the 3.40 percent vacancy rate recorded CHICAG
43 50
at mid-year 2020. For the third consecutive quarter, the 88 45 BERWYN
Southwest Cook submarket has led its peer submarkets in 12
CICERO
294
171
maintaining the lowest vacancy rate across Chicagoland.
DOWNERS 55
LA
34 GRANGE
GROVE
There was 107,296 square feet of net absorption in the
NAPERVILLE MCCOOK Chicago Midway
submarket in the second quarter. Net absorption increased SUMMIT Airport
BURR
44.7 percent quarter-over-quarter compared to the 74,150 RIDGE BEDFORD PARK
square feet of net absorption recorded in the first three WOODRIDGE
JUSTICE BRIDGEVIEW
months of 2021. The submarket has recorded positive net
absorption for seven consecutive quarters.
BOLINGBROOK
There was 111,942 square feet of new leasing activity in the ALSIP
57
294
Southwest Cook submarket in the second quarter. Cumulative LEMONT
94
new leasing activity eclipsed half a million square55 feet in the BLUE ISLAND
first half of 2021. ROMEOVILLE
PLAINFIELD
355
SOUTH
Vacancy Rate, Net Absorption New Lease Transactions HOLLAND
TINLEY PARK 80
Leasing Activity Q1 Q2 Q3 Q4
Vacancy Rate (%) Net Absorption (SF)
Q2 2021 INDUSTRIAL MARKET REPORT138,994 SF
AVA I L A B I L I T Y
6800 Santa Fe Drive | Hodgkins, IL
The General Warehouse at the IAC Chicago Market Center,
located at 6800 Santa Fe Dr, currently has up to 138,994
square feet available. PGIM Real Estate purchased a 40.0
percent stake in this facility in 2020 as part of multi-state,
35-property, 5.35 million-square-foot portfolio for $16.8 million.
Construction Activity Blocks of Available Space
There were no projects under construction in the
Southwest Cook submarket in the second quarter of
2021.
Despite significant absorption over the past two years,
no developments have delivered in the Southwest Cook
submarket since 2019. This is due to limited suitable
sites available in this constrained submarket.
Submarket Snapshot
No Construction
Currently Underway
Vacancy Rate (%) Net Absorption (SF) New Supply (SF)
Significant Transactions
Sale Renewal
3401 S Cicero Ave 2600 S 25th Ave
Cicero Broadview
50,000 SF 21,600 SF
Total Deliveries SF Under Construction SF
Buyer Tenant
3401 Cicero LLC Henz Transport Group, Inc.
33You can also read