Austin-Round Rock, Texas - COMPREHENSIVE HOUSING MARKET ANALYSIS
←
→
Page content transcription
If your browser does not render page correctly, please read the page content below

The COVID-19 pandemic has resulted in unprecedented large and rapid
changes in many data series, and similarly unprecedented large policy
responses, making analysis of, and longer run predictions for, the economy
and housing markets exceptionally difficult and uncertain. HUD will continue
to monitor market conditions in the HMA and provide an updated report/
addendum in the future.

      COMPREHENSIVE HOUSING MARKET ANALYSIS
     Austin-Round Rock, Texas

      U.S. Department of Housing and Urban Development,
      Office of Policy Development and Research
      As of January 1, 2021

      Share on: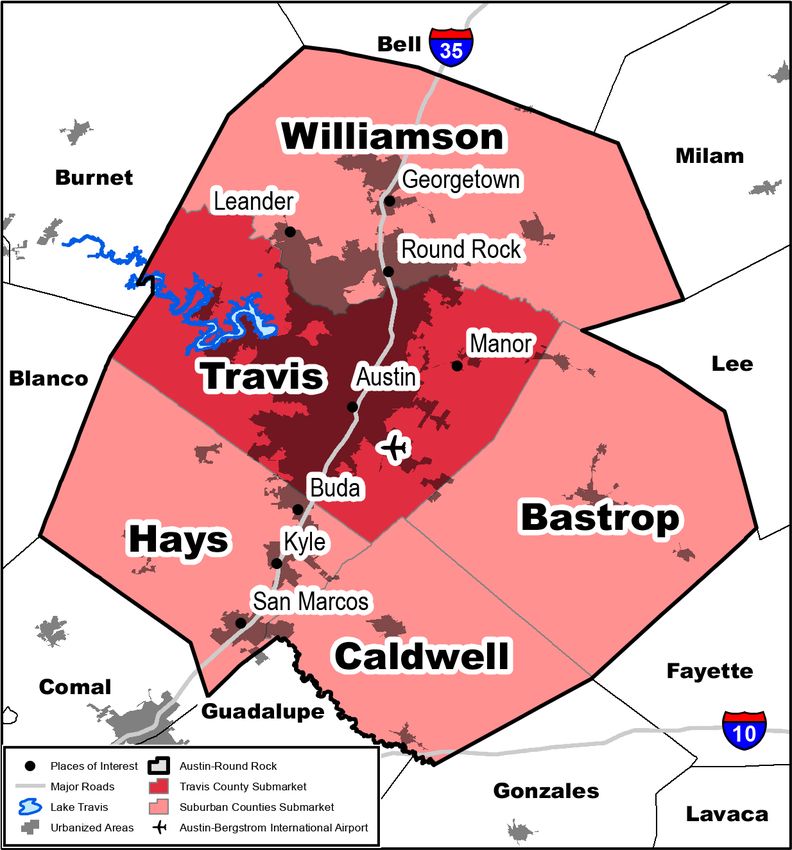
Austin-Round Rock, Texas Comprehensive Housing Market Analysis as of January 1, 2021                                                                              Executive Summary 2

Executive Summary
Housing Market Area Description
The Austin-Round Rock housing market area (hereafter, Austin
HMA) is coterminous with the Austin-Round Rock, TX Metropolitan
Statistical Area (MSA). The HMA includes five counties in central
Texas and, for the purposes of this analysis, is broken into two
submarkets: the Travis County submarket, which includes Travis
County, and the Suburban Counties submarket, which includes
Bastrop, Caldwell, Hays, and Williamson Counties. The city of
Austin, the state capital, is the southernmost state capital in the
48 contiguous states and is known as the “Live Music Capital of
the World” due to its abundance of music venues.

                                                                                           Tools and Resources

                                                                                            Find interim updates for this metropolitan area, and select geographies nationally, at PD&R’s
                                                                                            Market-at-a-Glance tool.
                                                                                            Additional data for the HMA can be found in this report’s supplemental tables.
                                                                                            For information on HUD-supported activity in this area, see the Community Assessment Reporting Tool.

                                                                                                    Comprehensive Housing Market Analysis Austin-Round Rock, Texas
                                                                                       U.S. Department of Housing and Urban Development, Office of Policy Development and Research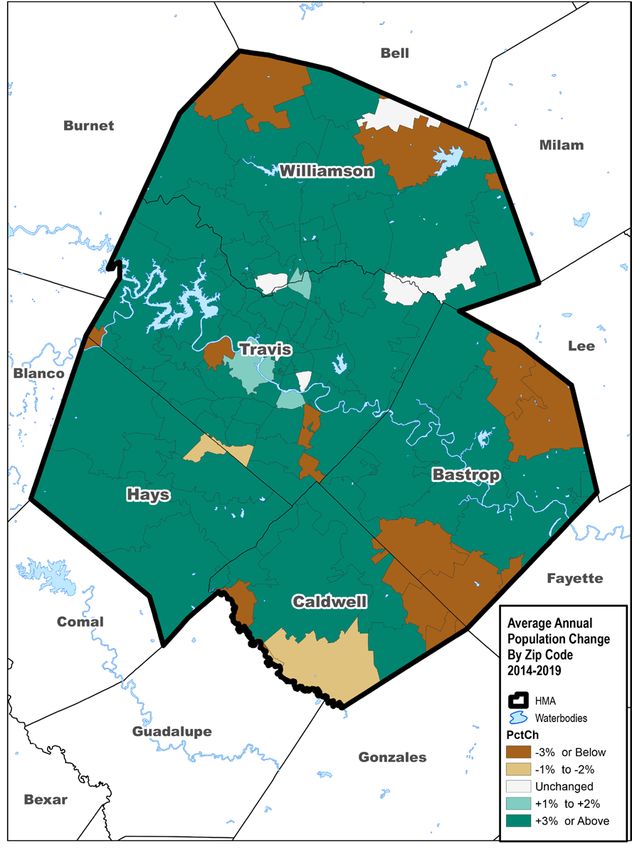
Austin-Round Rock, Texas Comprehensive Housing Market Analysis as of January 1, 2021                                                                                                 Executive Summary 3

Market Qualifiers
Economy                                                              Sales Market                                                                Rental Market
           Comparatively Strong: While nonfarm                                    Tight: Sales construction activity reached                                    Balanced: Rental permitting also reached
           payrolls declined 2.1 percent in the HMA                               an all-time peak in 2020 with 22,400                                          an all-time peak in 2020, with 21,200
           during 2020, this was significantly less                               sales units permitted, up by 3,100, or                                        rental units permitted—an increase
           than the national decline of 5.8 percent.                              16 percent, from 2019 as the market                                           of 5,200, or 33 percent, from 2019,
Also, 5 out of the 11 employment sectors in the HMA                               responded to increasing demand for                                            even as renter households shifted to
added jobs during 2020, compared with just 1 sector                               owner units.                                                                  homeownership due to low interest rates
nationally, after COVID-19 countermeasures were                                                                                                                 and increased owner production.
implemented. According to the Austin Chamber
of Commerce, 2020 was a record-setting year for                      Despite increased sales construction activity since 2018,                   The current overall rental vacancy rate is estimated
a number of new jobs announced from business                         the sales market remains tight because low interest                         at 7.3 percent, down from 8.6 percent in 2010, when
relocations and expansions.                                          rates supported increased homeownership. During                             market conditions were slightly soft. The rental market
                                                                     December 2020, there was a 0.6-month inventory                              has returned to balanced conditions from tighter
During 2020, nonfarm payrolls in the Austin HMA                      of homes on the market, down from 1.7 months in                             conditions that existed from 2014 through 2018 due to
declined by 23,000 jobs, or 2.1 percent, to more                     December 2019 (Austin Board of Realtors®). Home sales                       increased production of rental units. Simultaneously,
than 1.1 million jobs. The leisure and hospitality sector            during 2020 totaled 67,900, an increase of 6,450, or                        owner unit production increased, and interest rates
has been hardest hit, declining by 27,000 jobs, or                   more than 10 percent, from 2019 (Zonda). The average                        dropped, enabling more renter households to shift to
19.9 percent, because many live music venues have                    home sales price was $359,900, an increase of $10,500,                      homeownership. The apartment vacancy rate in the
stopped performances, and other social distancing                    or nearly 3 percent, from 1 year earlier. During the 3-year                 HMA has been increasing during the past several years
measures have impacted this sector. The Austin HMA,                  forecast period, demand is estimated for 56,700 new                         because of increased building activity. During 2020, the
known as “Silicon Hills,” with a young, well-educated                owner units. The 7,375 units currently under construction                   apartment vacancy rate increased to 8.0 percent, up
workforce, is quickly becoming a technology hub for the              will satisfy a small portion of that demand.                                from 6.4 percent a year earlier (ALN Apartment Data,
nation, with firms such as Apple Inc., Amazon.com, Inc.,                                                                                         Inc.). There are currently 31,200 rental units under
and Tesla, Inc. all announcing major expansions recently.                                                                                        construction and an additional 18,000 still in initial
During the next 3 years, nonfarm payrolls are expected                                                                                           lease up in the HMA. The absorption of apartment units
to increase by an average of 3.7 percent annually.                                                                                               has been steadily declining the past 3 years, with an
                                                                                                                                                 average of 690 units absorbed monthly in 2020, down
                                                                                                                                                 from 870 per month during 2019 and 1,150 per month
                                                                                                                                                 during 2018. During the forecast period, demand is
                                                                                                                                                 estimated for 33,250 rental units. The 31,200 units
                                                                                                                                                 currently under construction in the HMA will satisfy a
                                                                                                                                                 large portion of that demand.

                                                                                                                                 3-Year Housing Demand Forecast
TABLE OF CONTENTS                                                                                                     Sales Units                                                Rental Units
Economic Conditions 4                                                                              Austin HMA           Travis          Suburban               Austin HMA           Travis          Suburban
                                                                                                      Total             County           Counties                 Total            County            Counties
Population and Households 9                                                                                           Submarket         Submarket                                 Submarket         Submarket
                                                                     Total Demand                     56,700            27,850            28,850                  33,250            20,800            12,450
Home Sales Market 15
                                                                     Under Construction                7,375             3,600             3,775                  31,200            26,050             5,150
Rental Market 27                                                      Notes: Total demand represents estimated production necessary to achieve a balanced market at the end of the forecast period. Units under
Terminology Definitions and Notes 36                                  construction as of January 1, 2021. The forecast period is January 1, 2021, to January 1, 2024.
                                                                      Source: Estimates by the analyst

                                                                                                                      Comprehensive Housing Market Analysis Austin-Round Rock, Texas
                                                                                                        U.S. Department of Housing and Urban Development, Office of Policy Development and Research
Austin-Round Rock, Texas Comprehensive Housing Market Analysis as of January 1, 2021 Economic Conditions 4
Table 1. Major Employers in the Austin HMA
Economic Conditions Name of Employer
H-E-B Grocery Company, LP
Nonfarm Payroll Sector
Wholesale & Retail Trade
Number of Employees
18,035
Largest Sector: Professional and Business Services University of Texas at Austin Government 16,800
Dell Technologies Inc. Professional & Business Services 14,030
Excluding the job losses in the leisure and hospitality sector, nonfarm City of Austin Government 13,531
payrolls would have increased by 4,000 jobs or 0.4 percent during 2020. Federal Government Government 13,199
Ascension Seton Education & Health Services 11,227
Primary Local Economic Factors St. David’s HealthCare
Samsung Austin Semiconductor
Education & Health Services
Manufacturing
10,665
8,935
The Austin HMA has historically had a large proportion of jobs in both Walmart Inc. Wholesale & Retail Trade 7,500
government and education, but since the founding of Dell Technologies in Apple Inc. Manufacturing 7,000
1984, it has also become a center for technology and business. The HMA Note: Excludes local school districts.
Sources: Austin Chamber of Commerce; Austin Biz Journal
is the location of the Texas state capital and home to the University of
Texas (UT) and Texas State University (TXST), which are the second and fifth Figure 1. Share of Nonfarm Payroll Jobs in the Austin HMA, by Sector
largest universities in the state and are located in the cities of Austin and
San Marcos, respectively. Estimated enrollment at TXST in the fall of 2020 Mining, Logging,
& Construction 7%
was 38,700 students, with over 3,750 faculty and staff. UT at Austin had over Government 17%
50,500 students in 2020 and over 24,000 faculty and staff. Prior studies Manufacturing 6%
completed by the universities in 2014–2015 estimated an economic impact
of over $3 billion locally. The HMA is also home to an Internal Revenue
Service (IRS) processing facility. Three of the five largest employers in the Other Services 4%
Trade 15%
HMA, UT, the City of Austin, and the federal government, all with more than
13,000 employees, are in the government sector (Table 1). While historically Leisure & Total
Hospitality 10% 1,093.0
dominated by government employment, the HMA is increasingly becoming Transportation
an innovation hub for technology companies. Many headquarters or regional & Utilities 2%
offices of Fortune 500 companies are located in and around the city of Austin, Information 3%
including the nearby suburb of Round Rock, where the headquarters of Dell Education &
Technologies is located. The local economy in the HMA has benefited from Health Services 11% Financial
Activities 7%
the relocation and expansions of various corporations, combined with many
start-ups, due to the location, traditionally lower cost of living, and access Professional & Business Services 19%
to a highly educated workforce. Due to these factors, the professional and
business services sector surpassed the government sector in 2018 as the Notes: Total nonfarm payroll is in thousands. Percentages may not add to 100 percent due to rounding.
Based on 12-month averages through December 2020.
largest employment sector in the HMA (Figure 1). Source: U.S. Bureau of Labor Statistics
Comprehensive Housing Market Analysis Austin-Round Rock, Texas
U.S. Department of Housing and Urban Development, Office of Policy Development and ResearchAustin-Round Rock, Texas Comprehensive Housing Market Analysis as of January 1, 2021 Economic Conditions 5
Current Conditions— Table 2. 12-Month Average Nonfarm Payroll Jobs (1,000s) in the Austin HMA, by Sector
Nonfarm Payrolls 12 Months Ending
December 2019
12 Months Ending
December 2020 Absolute Change Percentage Change
Nonfarm payrolls in the Austin HMA totaled nearly Total Nonfarm Payroll Jobs 1,116.0 1,093.0 -23.0 -2.1
1.1 million during 2020, a decline of 23,000, or Goods-Producing Sectors 131.5 136.9 5.4 4.1
Mining, Logging, & Construction 69.0 71.8 2.8 4.1
2.1 percent, from 2019 (Table 2). With the state and
Manufacturing 62.5 65.1 2.6 4.2
local governments taking measures to combat Service-Providing Sectors 984.6 956.1 -28.5 -2.9
the spread of COVID-19 in March 2020, nonfarm Wholesale & Retail Trade 161.1 160.7 -0.4 -0.2
payrolls declined in the Austin HMA for the first Transportation & Utilities 23.6 24.8 1.2 5.1
time since the Great Recession in 2009 (Figure 2). Information 38.4 35.4 -3.0 -7.8
Financial Activities 66.2 73.7 7.5 11.3
With many bars and restaurants closed or Professional & Business Services 198.7 204.7 6.0 3.0
operating at a limited capacity, many conventions Education & Health Services 128.9 121.9 -7.0 -5.4
and other large events were canceled, limiting Leisure & Hospitality 135.6 108.6 -27.0 -19.9
travel to the HMA. The leisure and hospitality Other Services 47.5 45.6 -1.9 -4.0
Government 184.6 180.6 -4.0 -2.2
sector decreased notably as a result, and jobs
Notes: Based on 12-month averages through December 2019 and December 2020. Numbers may not add to totals due to rounding. Data are in thousands.
in the sector declined by 27,000, or 19.9 percent, Source: U.S. Bureau of Labor Statistics
from 2019 to 108,600 jobs. With the initial waves
of measures enacted to fight COVID-19, jobs in Figure 2. 12-Month Average Nonfarm Payrolls in the Austin HMA
the leisure and hospitality sector declined from
National Recession Nonfarm Payrolls
138,000 in February 2020 to 70,000 jobs in April
1,200
2020. The city of Austin hosts major festivals
Nonfarm Payrolls (in Thousands)
each year, including the South by Southwest 1,100
(SXSW) and Austin City Limits (ACL) Music Festival
1,000
events that were canceled during 2020. In 2019,
SXSW alone contributed an estimated $355.9 900
million to the economy of the HMA (Greyhill 800
Advisors study, SXSW). The education and health
services sector had the second largest loss of 700
jobs during 2020, declining by 7,000 jobs, or 600
5.4 percent, when many students went to virtual
0
4
6
9
8
5
2
3
7
1
0
9
0
6
8
2
3
4
5
7
1
-0
-0
-0
-0
-0
-0
-0
-0
-0
-0
-2
-1
-1
-1
-1
-1
-1
-1
-1
-1
-1
learning, and many elective surgeries and other
ec
ec
ec
ec
ec
ec
ec
ec
ec
ec
ec
ec
ec
ec
ec
ec
ec
ec
ec
ec
ec
D
D
D
D
D
D
D
D
D
D
D
D
D
D
D
D
D
D
D
D
D
visits to medical professionals were canceled
Note: 12-month moving average.
or delayed due to social-distancing measures. Sources: U.S. Bureau of Labor Statistics; National Bureau of Economic Research
Comprehensive Housing Market Analysis Austin-Round Rock, Texas
U.S. Department of Housing and Urban Development, Office of Policy Development and ResearchAustin-Round Rock, Texas Comprehensive Housing Market Analysis as of January 1, 2021 Economic Conditions 6
Despite overall job losses, 5 of the 11 nonfarm payroll sectors added jobs during Figure 3. Sector Growth in the Austin HMA, 2001 to Current
the past year. Job growth was led by the financial activities sector, which added
Total Nonfarm Payroll Jobs
7,500 jobs, or an increase of 11.3 percent, to 73,700 jobs. Expansions in this Goods-Producing Sectors
sector included Realtor.com and PIMCO adding 600 and 200 jobs, respectively, Mining, Logging, & Construction
during the past year. The professional and business services sector added the Manufacturing
Service-Providing Sectors
second greatest number of jobs during 2020, increasing by 6,000 jobs, or Wholesale & Retail Trade
3.0 percent. While the professional and business services sector has added Transportation & Utilities
Information
more jobs than any other sector since 2000, in percentage terms, the Financial Activities
transportation and utilities sector has been the fastest growing sector in Professional & Business Services
the HMA since 2000 (Figure 3). More recently, from 2016 to current, the Education & Health Services
Leisure & Hospitality
transportation and utilities sector has increased by an average of 1,700 jobs, Other Services
or 8.7 percent, annually, due largely to the rapid expansion and additions of Government
-30 -20 -10 0 10 20 30 40 50 60 70 80 90 100 110 120 130
Amazon.com, Inc. fulfillment centers locally, and the past year was no different. Change in Jobs (%)
During 2020, more people stayed at home, increasing their use of Amazon.
com, Inc. services; the transportation and utilities sector increased by Note: The current date is January 1, 2021.
Source: U.S. Bureau of Labor Statistics
1,200 jobs, or 5.1 percent, from a year earlier.
Figure 4. 12-Month Average Unemployment Rate
Although economic conditions weakened considerably during the past year, with in the Austin HMA and the Nation
jobs declining by 128,600 from February to April 2020, more than 94 percent of
Austin HMA Nation
the jobs lost were recovered by the end of December 2020 (on a monthly basis, 12.0
not seasonally adjusted). Excluding the leisure and hospitality sector job losses,
nonfarm payrolls increased by 21,000, or 2.1 percent. The financial activities and 10.0
the professional and business services sectors, both with a concentration of
Unemployment Rate (%)
8.0
high-paying jobs, had rapid job gains during this period, increasing 12,000 and
13,000 jobs, or 17.6 and 6.4 percent, respectively. 6.0
Trends in Unemployment 4.0
The average unemployment rate in the Austin HMA was 6.1 percent during
2020, up from a nearly two-decade low of 2.7 percent during 2019. Despite that 2.0
increase, the current unemployment rate in the HMA remained below the peak
0.0
of 7.3 percent during the 12 months ending April 2010. Following that peak, the
0
D 4
D 6
D 9
D 8
D 5
D 2
D 3
D 7
1
0
D 0
D 9
D 6
D 8
D 2
D 3
D 4
D 5
D 7
D 1
unemployment rate steadily declined for the next 9 years. Overall, the average
-0
-0
-0
-0
-0
-0
-0
-0
-0
-0
-2
-1
-1
-1
-1
-1
-1
-1
-1
-1
-1
ec
ec
ec
ec
ec
ec
ec
ec
ec
ec
ec
ec
ec
ec
ec
ec
ec
ec
ec
ec
ec
D
D
D
unemployment rate in the HMA has been lower than the national average since
Note: Based on the 12-month moving average.
2003 (Figure 4). Source: U.S. Bureau of Labor Statistics
Comprehensive Housing Market Analysis Austin-Round Rock, Texas
U.S. Department of Housing and Urban Development, Office of Policy Development and ResearchAustin-Round Rock, Texas Comprehensive Housing Market Analysis as of January 1, 2021 Economic Conditions 7
Economic Periods of Significance in the manufacturing sector accounted for 26 percent of the jobs lost during
the same period. The mining, logging, and construction sector in the HMA
2000 Through 2003 lost 6,600 jobs, or 13.8 percent, in response to a slowdown in multifamily
Following an increase in nonfarm payrolls in 2001 by 1,300 jobs, or 0.2 percent, construction due to declining economic conditions and reduced single-family
to 684,000, nonfarm payrolls declined during 2002 and 2003 by an average construction. Another 5,200 and 4,100 jobs, or a decline of 4.3 or 3.6 percent,
of 10,700 jobs, or 1.6 percent annually to 663,900 in 2003. The downturn in were in the wholesale and retail trade and the professional and business
the economy was mainly due to contractions in the manufacturing and high- services sectors, respectively.
tech industries. The national recession and the dot-com bust contributed to
job losses in the manufacturing and high-tech industries both in the HMA and
2010 Through 2011
During 2010 and 2011, nonfarm payrolls increased by an average of 18,800
nationally. During 2002 and 2003, the manufacturing sector decreased by
9,000 jobs, or 11.8 percent, annually to 62,800, accounting for 84 percent of jobs, or 2.4 percent, to 811,900 jobs in 2011. By 2011, the HMA economy had
jobs lost in the HMA. Layoffs were especially high at firms that manufactured fully recovered and surpassed 2008 payroll levels, with the professional and
components for the telecommunication industry, including Tellabs, Inc., which business services sector leading gains with an average increase of 5,500
closed a facility in the city of Round Rock in 2002, laying off all 435 employees. jobs, or 4.8 percent, during 2010 and 2011. In 2010, Facebook, Inc. announced
the opening of a new online sales and operation center in the city of Austin,
2004 Through 2008 adding 200 new jobs. In addition, eBay Inc. expanded its business operations
Nonfarm payroll growth in the HMA accelerated from 2004 through 2008, center in the city of Austin in 2011, adding 1,000 jobs to date.
increasing by an average of 25,400 jobs, or 3.6 percent, to a peak of 2012 Through 2019
791,100. Continued labor demand from high-tech employers in Austin fueled Nonfarm payrolls in the HMA expanded by an average of 3,800 jobs, or
the expansion and a relative rebound of the trade sector from the previous 4.1 percent, annually from 2012 through 2019 to more than 1.12 million jobs,
downturn. From 2004 through 2008, the professional and business services which was faster than the growth recorded during the previous decade.
sector led job growth, which increased by an average of 5,400 jobs, or During 2012 through 2019, job gains were greatest in the professional and
5.5 percent. Job gains were significant in the wholesale and retail trade business services sector, which gained an average of 9,600 jobs, or
sector, which increased by an average of 4,800 jobs, or 4.5 percent, annually. 6.3 percent, whereas the information sector had the fastest growth rate,
2009 averaging 7.8 percent, or 2,200 jobs, annually. Some of the employers that
During 2009, the number of nonfarm jobs in the HMA declined by 16,800, expanded in the HMA during this period include Apple Inc. and General Motors
or 2.1 percent, to 774,300, reflecting the effects of the Great Recession and Company. In 2012, Apple Inc. established its Americas Operations Center,
the national housing crises. By comparison, nonfarm payrolls in the nation responsible for running the business operations of the company for the entire
declined 4.3 percent. All but three sectors sustained declines in nonfarm Western Hemisphere. Additional gains resulted from the General Motors
payrolls in the Austin HMA. Job losses were greatest in the manufacturing Company purchasing a 302,604-square-foot building in 2015 to expand its
sector, which declined by 9,200 jobs, or 14.6 percent, to 53,700, accounting Information Technology Innovation Center in North Austin, which added
for 55 percent of overall job declines. Nationally, by comparison, job losses 500 jobs to the sector.
Comprehensive Housing Market Analysis Austin-Round Rock, Texas
U.S. Department of Housing and Urban Development, Office of Policy Development and ResearchAustin-Round Rock, Texas Comprehensive Housing Market Analysis as of January 1, 2021 Economic Conditions 8
Employment Forecast
During the 3-year forecast period, nonfarm payrolls in the HMA are expected expected to complete a factory in southeast Travis County, adding 5,000
to increase an average of 3.7 percent annually. Job growth is expected to workers. Also, in 2022, Oracle Corporation will be relocating its corporate
be strongest in the leisure and hospitality sector, where job recovery is headquarters from the San Francisco Bay area to a campus in the city of
anticipated with the continued easing of countermeasures implemented Austin, bringing approximately 2,000 jobs. Apple Inc. is currently constructing
during the COVID-19 pandemic. In addition, several expansions are expected a $1 billion campus in the city of Austin, which will add 5,000 employees upon
to contribute to job growth during the next 3 years. In 2022, Tesla, Inc. is its completion in 2022, with room to expand up to 15,000 in the future.
Comprehensive Housing Market Analysis Austin-Round Rock, Texas
U.S. Department of Housing and Urban Development, Office of Policy Development and ResearchAustin-Round Rock, Texas Comprehensive Housing Market Analysis as of January 1, 2021 Population and Households 9
Population and Households for 74 percent of growth. Map 3 shows estimated
population growth from 2014 through 2019 by zip
Current Population: 2.31 million code. Population growth has been widespread
Among MSAs with a population greater than 500,000 in the nation, Austin has been the fastest within the HMA, with the vast majority of zip
growing since 2010, increasing an average of 2.8 percent annually. codes having more than 3.0 percent growth.
People mainly relocate to the HMA from the
Population Trends other major Texas MSAs, with the largest number
As of January 1, 2021, the population of the HMA is estimated at approximately 2.31 million (Table 3), coming from the Houston-The Woodlands-Sugar
reflecting an average annual increase of 55,500, or 2.8 percent, annually since 2010, with net in-migration
averaging 39,500 people a year and accounting for more than 71 percent of all population growth in the Map 3. Average Annual Population
HMA. By comparison, during the period from 2000 through 2010, population growth averaged 46,650 Change by ZIP Code
people, or 3.2 percent, annually, with net in-migration of 29,500 people a year that accounted for more
than 63 percent of all population growth. As the economy expanded during the build up to the Great
Recession, the population increased by an average of 3.8 percent, or 55,950, each year from 2004
to 2008, and net in-migration averaged 38,100 people a year. In response to the weak labor market,
population growth slowed to an average of 46,800, or 2.8 percent, each year from 2008 to 2010, and
net in-migration fell to an average of 28,350 annually, or 61 percent of the growth. From 2011 to 2016, as
economic and housing market conditions improved, the population growth rate increased to an average
of 3.0 percent, or 56,300, annually; net in-migration increased more than 40 percent, averaging 39,600
people annually accounting for 70 percent of growth. Population growth from 2017 through the current
date has averaged 56,350, or 2.6 percent, annually, with net in-migration averaging 41,650, accounting
Table 3. Austin HMA Population and Household Quick Facts
2010 Current Forecast
Population Population 1,716,289 2,313,000 2,501,000
Quick Facts Average Annual Change 46,650 55,500 62,900
Percentage Change 3.2 2.8 2.6
2010 Current Forecast
Household Households 650,459 881,000 954,500
Quick Facts Average Annual Change 17,850 21,450 24,500
Percentage Change 3.3 2.9 2.7
Notes: Average annual changes and percentage changes are based on averages from 2000 to 2010, 2010 to current, and current to forecast.
The forecast period is from the current date (January 1, 2021) to January 1, 2024.
Sources: 2000 and 2010—2000 Census and 2010 Census; current and forecast—estimates by the analyst Source: 2014–2019 American Community Survey, 5-year data
Comprehensive Housing Market Analysis Austin-Round Rock, Texas
U.S. Department of Housing and Urban Development, Office of Policy Development and ResearchAustin-Round Rock, Texas Comprehensive Housing Market Analysis as of January 1, 2021 Population and Households 10
Land, TX MSA (Table 4). Large universities in the Table 4. Metro-to-Metro Migration Flows in the Austin HMA: 2014–2018
Austin HMA contribute to the net in-migration Into the HMA
from these parts of Texas. Houston-The Woodlands-Sugar Land, TX Metro Area 13,931
Dallas-Fort Worth-Arlington, TX Metro Area 11,902
Demographic Trends San Antonio-New Braunfels, TX Metro Area 10,161
Austin has become a destination for young New York-Newark-Jersey City, NY-NJ-PA Metro Area 3,870
professionals because of many cultural amenities Los Angeles-Long Beach-Anaheim, CA Metro Area 3,378
and job opportunities. The median age in the Austin Out of the HMA
HMA is 35.2 years of age, well below the national Houston-The Woodlands-Sugar Land, TX Metro Area 9,483
average of 38.5 years of age (Table 5). In addition, Dallas-Fort Worth-Arlington, TX Metro Area 9,227
33.2 percent of the population in the Austin HMA San Antonio-New Braunfels, TX Metro Area 8,427
is between 25 to 44 years of age, compared with Killeen-Temple, TX Metro Area 4,300
26.6 percent nationally (Figure 5). Approximately
College Station-Bryan, TX Metro Area 2,474
46.2 percent of all people in the Austin HMA are
Sources: U.S. Census Metro-to-Metro Migration Flows; 2014–2018 American Community Survey, 5-year data
age 25 or older and hold a bachelor’s degree or
higher, compared with nearly 30.8 percent for Table 5. Selected Population and Household Demographics in the Austin HMA and the Nation
Texas and 33.1 percent nationally (2019 American
Community Survey [ACS] 1-year data). This higher- Austin HMA Nation
than-average skilled labor force, in turn, attracts Population Age 18 and Under 22.7% 22.2%
many employers. The educational level of residents Population Age 65 and Over 11.2% 16.5%
of the HMA has risen sharply over the last decade. Median Age 35.2 38.5
In 2010, approximately 39.7 percent of residents
Bachelor's Degree Holders Over Age 25 29.6% 20.3%
age 25 or older had a bachelor’s degree or higher.
In addition to those already possessing college Graduate or Professional Degree Holders Over Age 25 16.6% 12.8%
degrees, the HMA has a significant presence of Households With At Least One Child Under Age 18 in Poverty 12.8% 16.8%
students. During 2019, nearly 5 percent of the HMA No Healthcare Coverage 13.6% 9.2%
population was enrolled in a university.
Hispanic 32.6% 18.3%
Travis County Submarket Non-Hispanic 67.4% 81.7%
As of January 1, 2021, Travis County, the fifth Median Household Income $80,954 $65,712
largest county in Texas and the largest county Households With One or More Children Under Age 18 31.9% 29.9%
in the HMA, had an estimated population of Source: 2019 American Community Survey
Comprehensive Housing Market Analysis Austin-Round Rock, Texas
U.S. Department of Housing and Urban Development, Office of Policy Development and ResearchAustin-Round Rock, Texas Comprehensive Housing Market Analysis as of January 1, 2021 Population and Households 11
1.31 million people, accounting for nearly 57 percent Figure 5. Population by Age Range in the Austin HMA
of the entire HMA population (Figure 6). From 2010 2010 2019
to current, population growth averaged 26,500 35%
people, or 2.3 percent, annually, which accounted
30%
for nearly 48 percent of the population growth in
the HMA. By comparison, from 2000 through 2010, 25%
population growth in the Travis County submarket
20%
averaged 21,200 people, or 2.3 percent, per year,
slightly more than 45 percent of all population 15%
growth. From 2000 through 2010, in-migration
10%
to the Travis County submarket averaged 10,050
people per year, but since 2010, in-migration has 5%
surged and averaged 16,300 people per year. 0%
Under 18 Years 18 to 24 Years 25 to 44 Years 45 to 64 Years 65 Years and Over
Suburban Counties Submarket
During the past two decades, the fastest Source: U.S. Census Bureau
population growth in the HMA has been in the
Figure 6. Current Population in the Austin HMA, by Submarket
Suburban Counties submarket. The population
is estimated at 1 million as of January 1, 2021,
with an average annual increase of 29,000, or
3.5 percent, since 2010. Net in-migration has
averaged 23,250 people a year in the submarket
since 2010 and has accounted for 80 percent
of total population growth. By comparison, Suburban
population growth averaged 25,450 people, or Counties Travis County
Submarket Submarket
4.7 percent, annually from 2000 to 2010; during 57%
43%
this time, net in-migration averaged 19,450
people a year and accounted for 76 percent of
total population growth. Relatively affordable
housing compared with nearby Travis County has
supported high levels of net in-migration to the
submarket. Population growth was particularly
rapid during the lead up to the Great Recession,
Source: Estimates by the analyst
Comprehensive Housing Market Analysis Austin-Round Rock, Texas
U.S. Department of Housing and Urban Development, Office of Policy Development and ResearchAustin-Round Rock, Texas Comprehensive Housing Market Analysis as of January 1, 2021 Population and Households 12
averaging 31,400, or 5.2 percent, annually from of 21,450, or 2.9 percent, from 650,500 households in 2010. By comparison, household growth in the
2006 to 2008, when net in-migration increased HMA averaged 3.3 percent annually from 2000 to 2010. The homeownership rate in the HMA has been
to 24,700, or nearly 79 percent of growth due to steadily increasing since 2000 and is currently 59.5 percent (Figure 7). While the homeownership rate
strong job gains during the period. By comparison, is increasing, the homeownership rate for the age cohort 25 to 34 years has been declining and is well
from 2000 to 2005, population growth averaged below the national homeownership rate for this age cohort (Table 6). Conversely, the homeownership rate
23,350 annually, or 4.8 percent, when net for the age cohort 35 to 44 years is above the national average. There are currently an estimated 520,400
in-migration averaged 17,850, or 76 percent of households in the Travis County submarket, representing an average annual increase of 2.4 percent since
growth. From 2008 to 2012, growth slowed further,
averaging 21,150 annually, or 3.1 percent. Net in- Figure 7. Households by Tenure and Homeownership Rate in the Austin HMA
migration accounted for 70 percent of the growth,
Owner Renter Homeownership Rate (%)
averaging 14,900 annually. In-migration increased
900,000 59.8
to 25,650 from 2013 to 2016, as population 59.5
growth averaged 31,600, or 4.0 percent, when the 800,000 59.5
Homeownership Rate (%)
submarket recovered jobs rapidly after the height 700,000 59.3
of the recession. The most recent population 600,000 59.0
Households
growth from 2017 to current has slowed slightly, to 500,000 58.8
58.5
an average of 3.6 percent, or 33,100, annually, with 400,000 58.5
in-migration averaging 27,450, or nearly 83 percent 58.2
300,000 58.3
of all population growth. Both Hays and Williamson
200,000 58.0
Counties ranked among the top ten fastest growing
counties in the nation from 2010 through 2019, 100,000 57.8
ranking second and ninth, respectively (U.S. 0 57.5
2000 2010 Current
Census Bureau). The most populous county in the
submarket in 2019 was Williamson County, with Note: The current date is January 1, 2021.
Sources: 2000 and 2010—2000 Census and 2010 Census; current—estimates by the analyst
590,600 residents, accounting for 62 percent of
the population of the Suburban Counties submarket
(2019 ACS 1-year data). Table 6. Homeownership Rates by Age of Householder in the Austin HMA and the Nation
Austin HMA Nation
Household Trends 2000 2010 2019 2000 2010 2019
Household growth has generally mirrored Householder Age 25 to 34 Years 39.6 36.3 28.2 45.6 42.0 38.5
population growth in the Austin HMA since 2000. Householder Age 35 to 44 Years 66.1 62.5 64.1 66.2 62.3 58.3
The number of households in the HMA is currently Total Households 51.4 57.4 57.6 66.2 65.1 64.1
estimated at 881,000, an average annual increase Source: 2000 and 2010 Decennial Census, 2019 American Community Survey, 1-year estimates
Comprehensive Housing Market Analysis Austin-Round Rock, Texas
U.S. Department of Housing and Urban Development, Office of Policy Development and ResearchAustin-Round Rock, Texas Comprehensive Housing Market Analysis as of January 1, 2021 Population and Households 13
Figure 8. Share of Forecast Population Growth by Submarket in the Austin HMA
2010. Since 2010, renter households increased
by an average of 4,525, or 2.1 percent, annually,
accounting for nearly 42 percent of all new
household formations. The number of households
in the Suburban Counties submarket is currently
estimated at 360,600, representing an average
Suburban
annual increase of 10,650 or 3.6 percent, since Counties Travis County
2010, compared with an increase of 9,500, or Submarket Submarket
54% 46%
5.0 percent, annually from 2000 through 2010.
Forecast
During the next 3 years, population growth in
the HMA is expected to average 62,900, or
2.6 percent, annually. Population growth is
expected to increase during each of the next
Source: Estimates by the analyst
3 years, with net in-migration accelerating as
economic conditions in the HMA improve. The Figure 9. Components of Population Change in the Austin HMA, 2000 Through the Forecast
fastest population growth is expected in the
Net Natural Change Net Migration Population Growth
Suburban Counties submarket, followed by
70,000
the Travis County submarket, with respective
60,000
rates averaging 3.3 and 2.1 percent a year.
Population Change
Figure 8 shows the share of population growth 50,000
by submarket. Household growth in the HMA 40,000
is expected to average 2.7 percent annually, 30,000
with rates of 3.4 and 2.2 percent a year in the
20,000
Suburban Counties and Travis County submarkets,
respectively. Figure 9 shows the components of 10,000
population change in the Austin HMA from 2000 0
through the forecast.
05 5
06 6
09 9
04 4
07 7
01 1
t
03 3
10 0
t
02 2
08 8
16 6
re Cu 9
15 5
17 7
14 4
11 1
13 3
12 2
8
as
- F ren
20 20 0
20 0 0
00
20 20 0
20 20 0
20 20 0
20 01
20 20 0
20 0 0
20 01
20 01
20 201
20 01
1
20 0 0
20 01
20 01
20 01
20 201
19 20
ec
-2
-2
-2
-2
-2
-2
-2
-2
-2
-2
-2
r
-
-
-
-
-
-
20 8 -
-
00
or
1
20
20
-
nt
ur
C
Notes: Net natural change and net migration totals are average annual totals over the time period. The forecast period is from the current date
(January 1, 2021) to January 1, 2024.
Sources: U.S. Census Bureau; current to forecast—estimates by the analyst.
Comprehensive Housing Market Analysis Austin-Round Rock, Texas
U.S. Department of Housing and Urban Development, Office of Policy Development and ResearchAustin-Round Rock, Texas Comprehensive Housing Market Analysis as of January 1, 2021 Housing Market Overview 14
Housing Market Overview
The Austin HMA has been one of the fastest growing MSAs in the nation for enough new renter households for the level of housing production currently
the last 10 years. As a result, home prices and rents have risen rapidly due in progress. Given the current level of rental production compared with the
to high levels of demand. With the increasing home prices, the production current level of new renter household formation, it is likely that a soft market in
of new housing began to increase. The rental market was the first to start the Austin HMA could prevail, particularly for rental units in the Travis County
having rapid price increases due to low construction activity during the Great submarket, where the bulk of the rental production is occurring.
Recession from 2008 through 2011, with an average of 4,000 units permitted
a year, causing the rental market to tighten. Rental construction activity spiked Since 2018, population growth has averaged 24,950, annually, in the Travis
during 2012, exceeding 11,350 rental units permitted, and continued from County submarket, while the number of total housing units permitted has
2012 through 2017 with an average of 11,850 units permitted, annually. This averaged 22,500 each year, which is 1.11 people per housing unit built. By
increased level of rental construction was accompanied by a small but steady comparison, from 2012 through 2017, population growth in Travis County
increase in the vacancy rate during the same period. Owner production in averaged 26,150 people per year. There was an average of 14,350 housing
the HMA was a little slower to ramp up and in 2014 surpassed 10,000 units units built per year during this time, equaling about 1.82 people per housing
permitted in a year. Production continued to increase throughout the decade, unit built. While demand for housing remains strong due to population
with owner production reaching 16,050 units permitted in 2017 and rental growth in the HMA, a large amount of previous rental production has yet to
production exceeding 15,000 for the first time in 2018. Homebuilders and be absorbed. If the production levels of the past two years were to continue,
multifamily developers continued to increase production through the end of the rental market would soften further, particularly in a low interest rate
the decade. In 2020, both the rental and owner market permitted more than environment. During the next 3 years, an additional 11,800 new households
20,000 units each. Since 2018, population growth has averaged 58,850 people are expected in Travis County annually. Even if new renter household
per year, with housing production averaging 36,800 units per year for an formation is above the historical trends and accounts for 60 percent of all new
average increase of 1.6 people for every new housing unit built. By comparison household formation, that is less than 7,100 new renter households per year or
from 2012 through 2017, housing production averaged 23,700 units, with less than 21,300 new renter households during the next 3 years—well below
population growth that averaged 56,200 people for an average increase of the 26,050 rental units currently under construction. The surplus units in the
2.4 people for every new housing unit permitted. The recent production level Travis County submarket will not provide a substitute for forecast demand in
has led to increasing vacancy rates in the rental market because there are not the suburban submarket as detailed in the sections that follow.
Comprehensive Housing Market Analysis Austin-Round Rock, Texas
U.S. Department of Housing and Urban Development, Office of Policy Development and ResearchAustin-Round Rock, Texas Comprehensive Housing Market Analysis as of January 1, 2021 Home Sales Market 15
Home Sales Market Table 7. Home Sales Quick Facts in the Austin HMA
Austin HMA Vacancy Rate
Austin HMA
0.9%
Nation
NA
Market Conditions: Tight Months of Inventory 0.6 3.5
Despite the overall economic contraction, Total Home Sales 67,900 5,696,600
strong net in-migration and low interest rates Home Sales 1-Year Change 11% 9%
supported increased home sales during 2020. Quick Facts New Price $357,200 $409,400
Current Conditions 1-Year Change
Regular Resale Price
0%
$361,700
-1%
$345,800
The home sales market in the Austin HMA is
1-Year Change 3% 10%
currently tight, with an estimated owner vacancy
Mortgage Delinquency Rate 3.3% 4.0%
rate of 0.9 percent, significantly down from the
NA = data not available.
2.3-percent rate during April 2010 (Table 7). Notes: The vacancy rate is as of the current date; home sales and prices are for the 12 months ending December 2020; and months of inventory
There was a 0.6-month supply of available homes and mortgage delinquency data are as of December 2020. The current date is January 1, 2021.
Sources: CoreLogic, Inc.; Zonda; Austin Board of Realtors; Texas Real Estate Research Center at Texas A&M University
for sale during December 2020, down from a
1.1-month supply during December 2019 (Austin Figure 10. 12-Month Sales Totals by Type in the Austin HMA
Board of Realtors). Homes were on the market
for an average of 36 days in December 2020, New Regular Resale REO
down from 51 days a year earlier. The home 80,000
sales market has been among the tightest in the 70,000
nation in 2020. It is expected to be among the
60,000
most active housing markets in 2021, according
to the Zillow Q4 (fourth quarter) 2020 home price 50,000
Sales Totals
expectations survey.
40,000
Home Sales 30,000
Despite the economic contraction, home sales
and prices increased during 2020 due to already 20,000
low levels of housing inventory combined with
10,000
very high demand from growth in population.
During 2020, 67,900 homes sold in the HMA, up 0
by 6,450 sales, or more than 11 percent from 2019
6
9
8
5
7
0
9
0
6
8
2
3
4
5
7
1
-0
-0
-0
-0
-0
-2
-1
-1
-1
-1
-1
-1
-1
-1
-1
-1
when home sales increased by 4,750, or more
ec
ec
ec
ec
ec
ec
ec
ec
ec
ec
ec
ec
ec
ec
ec
ec
D
D
D
D
D
D
D
D
D
D
D
D
D
D
D
D
than 8 percent (Zonda). Figure 10 shows home
REO = real estate owned.
sales by type in the Austin HMA. Source: Zonda, with adjustments by the analyst
Comprehensive Housing Market Analysis Austin-Round Rock, Texas
U.S. Department of Housing and Urban Development, Office of Policy Development and ResearchAustin-Round Rock, Texas Comprehensive Housing Market Analysis as of January 1, 2021 Home Sales Market 16
Figure 11. 12-Month Average Sales Price by Type of Sale in the Austin HMA
REO Sales and New Regular Resale REO
Delinquent Mortgages 400,000
During 2020, the number of REO sales averaged 350,000
Average Sales Price ($)
550, or 0.8 percent of all home sales, down 50, 300,000
or more than 8 percent, from the average during 250,000
2019. In December 2020, 3.3 percent of home
200,000
loans in the Austin HMA were seriously delinquent
(90 or more days delinquent or in foreclosure) or 150,000
had transitioned into REO status; that percentage 100,000
is up from 0.6 percent a year earlier but below 50,000
the 4.0-percent peak rate in January 2010
0
(CoreLogic, Inc.). This increase is due strictly to
6
9
8
5
7
0
9
0
6
8
2
3
4
5
7
1
home loans that are 90 or more days delinquent.
-0
-0
-0
-0
-0
-2
-1
-1
-1
-1
-1
-1
-1
-1
-1
-1
ec
ec
ec
ec
ec
ec
ec
ec
ec
ec
ec
ec
ec
ec
ec
ec
D
D
D
D
D
D
D
D
D
D
D
D
D
D
D
D
With forbearance programs in place, foreclosures
have decreased during the past year. REO = real estate owned.
Source: Zonda, with adjustments by the analyst
Home Sales Prices Figure 12. Share of Overall Sales by Price Range During the 12 Months
Ending December 2020 in the Austin HMA
During 2020, the average home sales price in
the HMA was $359,900, up 3.0 percent from Existing Sales New Sales
45
$349,400 during 2019 (Figure 11). Approximately
18 percent of all new homes sold in the HMA 40
during the most recent 12 months were priced 35
from $200,000 to $299,000 (Figure 12), and
Share of Sales (%)
30
demand for this price range remains high. 25
Sales Construction Activity 20
During 2020, approximately 22,400 sales units 15
were permitted in the Austin HMA, 16 percent 10
more than the 19,350 sales units permitted during 5
2019 (preliminary data, with estimates by the
0
analyst; Figure 13). This is the first time that the $199k and Less $200k to $299k $300k to $399k $400k to $499k $500k to $749k $750k and More
permitting of housing units for sale has exceeded
Note: New and existing sales include single-family homes, townhomes, and condominium units.
20,000 in a year. Source: Zonda
Comprehensive Housing Market Analysis Austin-Round Rock, Texas
U.S. Department of Housing and Urban Development, Office of Policy Development and ResearchAustin-Round Rock, Texas Comprehensive Housing Market Analysis as of January 1, 2021 Home Sales Market 17
Figure 13. Average Annual Sales Permitting Activity in the Austin HMA
Forecast Single-Family Homes/Townhomes Condominiums
During the 3-year forecast period, demand is 25,000
expected for an estimated 56,700 new homes
in the HMA (Table 8). Demand for new homes in 20,000
the HMA is expected to increase each year of the
forecast period as economic conditions in the 15,000
HMA recover from the impact of COVID-19. The
7,375 new homes currently under construction 10,000
will meet part of the forecast demand in the HMA
5,000
during the first year.
Sales Market—
0
00
04
06
09
08
05
02
03
07
20
01
19
10
16
18
12
13
14
15
17
11
20
20
20
20
20
20
20
20
20
20
20
20
20
20
20
20
20
20
20
20
20
Travis County Submarket Notes: Includes single-family homes, townhomes, and condominiums. Data for 2020 are through December 2020.
Sources: U.S. Census Bureau, Building Permits Survey; 2000 through 2019—final data and estimates by the analyst; 2020—preliminary data and
Market Conditions: Very Tight estimates by the analyst
Table 8. Demand for New Sales Units in the Austin HMA During the Forecast Period
Total home sales in Travis County during
Sales Units
2020 totaled 34,200, an increase of 1,900
Demand 56,700 Units
sales, or nearly 6 percent, from 2019. Under Construction 7,375 Units
Note: The forecast period is from January 1, 2021, to January 1, 2024.
Current Conditions Source: Estimates by the analyst
The home sales market in the Travis County Table 9. Home Sales Quick Facts in the Travis County Submarket
submarket is currently very tight, with an Travis County Submarket Austin HMA
estimated vacancy rate of 0.9 percent, down from Vacancy Rate 0.9% 0.9%
2.5 percent in 2010 (Table 9). Declining interest Months of Inventory 0.6 0.6
rates and increased development of single- Total Home Sales 34,200 67,900
family homes in eastern Travis County—where Home Sales 1-Year Change 6% 11%
new homes are offered at lower prices—have Quick Facts New Price $375,500 $357,200
1-Year Change 3% 2%
attracted many new homebuyers in the Travis Regular Resale Price $398,100 $361,700
County submarket. According to data from the 1-Year Change 1% 3%
Austin Board of Realtors, during December Mortgage Delinquency Rate 3.2% 3.3%
2020, there was a 0.6-month supply of homes Notes: The vacancy rate is as of the current date; home sales and prices are for the 12 months ending December 2020; and months of inventory
and mortgage delinquency data are as of December 2020. The current date is January 1, 2021.
on the market, down from 1.4 months 1 year Sources: CoreLogic, Inc.; Zonda; Austin Board of Realtors; Texas Real Estate Research Center at Texas A&M University
Comprehensive Housing Market Analysis Austin-Round Rock, Texas
U.S. Department of Housing and Urban Development, Office of Policy Development and ResearchAustin-Round Rock, Texas Comprehensive Housing Market Analysis as of January 1, 2021 Home Sales Market 18
earlier. Also, during December 2020, the average Figure 14. 12-Month Sales Totals by Type in the Travis County Submarket
number of days a home was on the market was New Regular Resale REO
36 days, down by 20 days from one year earlier. 40,000
The number of active listings averaged 1,050, a 35,000
decline of 54 percent from one year earlier. The
30,000
average number of active listings (homes currently
Sales Totals
25,000
listed for sale) declined, even as the number of
new listings in December 2020 increased by 20,000
29 percent, to 1,225, due to low inventory and 15,000
how quickly homes are selling in this market. 10,000
New Home Sales 5,000
New home sales (which include single-family 0
homes, townhomes, and condominiums) have
6
9
8
5
7
0
0
6
9
8
2
3
4
5
7
1
-0
-0
-0
-0
-0
-2
-1
-1
-1
-1
-1
-1
-1
-1
-1
-1
ec
ec
ec
ec
ec
ec
ec
ec
ec
ec
ec
ec
ec
ec
ec
ec
increased recently, along with the recent rise in
D
D
D
D
D
D
D
D
D
D
D
D
D
D
D
D
the development of single-family homes. During REO = real estate owned.
Source: Zonda, with adjustments by the analyst
2020, new home sales totaled 8,350, an increase
of 190, or more than 2 percent, from 2019 (Zonda; Figure 15. Share of Overall Sales by Price Range During the 12 Months
Figure 14). New home sales are below the peak Ending December 2020 in the Travis County Submarket
level of 9,100 sales during 2006. Following that Existing Sales New Sales
peak, new home sales steadily declined during the 30
next 5 years by an average of 1,200, or 19 percent,
annually, to reach a low of 3,100 homes sold 25
annually. With the local economy rapidly improving
20
Share of Sales
and the impacts from the housing crisis lessening,
new home sales began to increase during 2012 15
and increased steadily for the next 6 years by an
average of 560, or 12 percent, annually to reach 10
6,975 new home sales in 2018. Figure 15 shows
home sales by price range. 5
Existing Home Sales 0
$199k and Less $200k to $299k $300k to $399k $400k to $499k $500k to $749k $750k and More
The regular resale of existing homes has reached
near-record levels of sales during the past 2 years. Source: Zonda
Comprehensive Housing Market Analysis Austin-Round Rock, Texas
U.S. Department of Housing and Urban Development, Office of Policy Development and ResearchAustin-Round Rock, Texas Comprehensive Housing Market Analysis as of January 1, 2021 Home Sales Market 19
During 2020, regular resales totaled 25,550, an REO sales in the current tight market have declined significantly and are at record low levels. During
increase of 1,725, or slightly more than 7 percent, 2020, REO sales totaled 275 in Travis County, down by 10 sales, or 4 percent, from a year earlier (Zonda).
from 2019 (Zonda). Similar to new home sales, Since 2015, REO sales have been well below levels from before the housing crisis. During 2007, there
regular resales also declined for the 5 years were 1,175 REO sales in Travis County before reaching a peak in 2011 with 2,200 REO sales. Since 2011,
following the peak in 2006, when sales reached REO sales have dropped significantly. During 2015, REO sales dropped below 1,000 with just 810 REO
a high of 27,000 homes sold. By 2011, regular sales, and by 2017 that number dropped below 500 with 490 REO sales. With strong demand these last
resales totaled just 13,600 homes sold, an average several years, and low inventory, most homes are sold before becoming REO properties. The price of an
decline of 2,675 homes, or 13 percent, annually REO property has also converged with the average sales price of new and existing home sales. In 2007
from 2006. With the economy improving following the average sales price of an REO property was $158,100, which was nearly 47 percent lower than the
the Great Recession, existing home sales began average sales price of $297,100 for an existing home. During 2020, the average price of an REO property
to improve by 2012, and regular resales increased was $382,600, which was less than 4 percent below the average sales price of $398,100 for an existing
by an average of 1,350, or 8 percent, annually home and $7,100 higher than the average sales price for a new home.
through 2018, reaching 23,100 homes sold.
New Home Sales Prices
REO Sales and The average sales price of a new home in the Travis County submarket was $375,500 during 2020, up
Delinquent Mortgages $11,000, or 3 percent, from 1 year earlier (Figure 16). The average sales price of a new home has increased
significantly from 2005 when the average sales price was $234,100. New home prices increased during
The impact of the foreclosure crisis was less
significant in the Travis County submarket than
for the nation. The rate of seriously delinquent Figure 16. 12-Month Average Sales Price by Type of Sale in the Travis County Submarket
mortgages (those 90 or more days delinquent New Regular Resale REO
or in foreclosure) and REO properties peaked 450,000
at 3.5 percent in January 2010, lower than the 400,000
8.6-percent peak for the nation (CoreLogic, Inc.).
Average Sales Price ($)
350,000
The rate declined rapidly in the submarket during 300,000
much of the 2010s but increased during the past 250,000
year because of the economic impact of COVID-19. 200,000
As of December 2020, the rate of seriously 150,000
delinquent mortgages and REO properties in the 100,000
submarket was 3.2 percent, up from 0.5 percent 50,000
during December 2019. This increase is due 0
strictly to home loans that are 90 or more days
6
9
8
5
7
0
9
0
6
8
2
3
4
5
7
1
-0
-0
-0
-0
-0
-2
-1
-1
-1
-1
-1
-1
-1
-1
-1
-1
delinquent. With the forbearance program in place,
ec
ec
ec
ec
ec
ec
ec
ec
ec
ec
ec
ec
ec
ec
ec
ec
D
D
D
D
D
D
D
D
D
D
D
D
D
D
D
D
foreclosures have decreased during the past year.
REO = real estate owned.
Source: Zonda, with adjustments by the analyst
Comprehensive Housing Market Analysis Austin-Round Rock, Texas
U.S. Department of Housing and Urban Development, Office of Policy Development and ResearchAustin-Round Rock, Texas Comprehensive Housing Market Analysis as of January 1, 2021 Home Sales Market 20
the next 2 years by an average of $19,450, or than the average sales price of a new home due to a higher percentage of regular resale homes in Travis
8 percent, annually, and reached $273,100 County being located on the more scenic western portion of the county and within the Austin city limits.
during 2007. From 2008 through 2009, when The higher price for regular resale homes has been a consistent pattern in the Travis County Submarket for
the housing crisis impacted the local market, the many years. During 2005, the average sales price of a regular resale home was $244,500, which was more
average sales price of a new home declined by than $10,000 higher than the average sales price of a new home in that year. During the next 5 years, the
an average of $11,100, or 4 percent, annually, to average sales price of a regular resale home increased by an average of $19,150, or 7 percent, annually, to
$250,900 by 2009. During 2010, the average $340,100 during 2010. During 2011, the average sales price of a regular resale home dropped by $32,100,
sales price of a new home began to increase or more than 9 percent, to $308,000. During 2012, the average sales price increased once again and
again, and by 2011 it was up to $277,200, an rose to $344,900 by 2014, an average increase of $12,300, or 4 percent, annually. Prices dipped again by
average increase of 5 percent annually. During approximately 1 percent in 2015 to $340,900. Prices began to rise once more in 2016, and by 2019, the
2012, the average sales price of a new home average sales price was up to $393,200, an average increase of $13,100 or 4 percent, annually.
declined slightly due to increased development
of new homes at slightly lower price points in Sales Construction Activity
eastern Travis County. During 2012, the average During 2020, sales building activity, as measured by the number of single-family homes, townhomes,
sales price of a new home was $269,200, a and condominium units (hereafter, owner units) permitted, totaled 11,100, an increase of 700, or nearly
decline of $7,925, or nearly 3 percent, from a 7 percent, from 2019 (preliminary data, with adjustments by the analyst). The 11,100 owner units permitted
year earlier. The next 2 years, 2013 and 2014, had is an all-time peak level, surpassing the 10,950 owner units permitted in 2006 before the housing crisis.
some of the largest annual increases in new home Before the previous peak level of building activity in 2006, construction of owner units increased every
prices. By 2014 the average sales price of a new year from 2001 through 2006 by an average of 500, or 6 percent, annually. During 2007, production
home was up to $330,800, an average increase began to slow, and by 2010, permitting of owner housing units totaled 3,325, an average decline of 1,900,
of $30,800, or 11 percent, annually. During 2015, or 26 percent, annually. During 2011, as the local economy began to recover and in-migration to the
there was a slight drop of 1 percent in the average county began to increase, so did the production of owner units. By 2015, there were 6,375 owner units
sales price resulting from types and locations of permitted, an average increase of 610 units, or 14 percent, annually. During 2016, owner production had
new homes sold during the year. In 2016, new the largest 1-year increase since 2004; there were 8,350 owner units permitted, an increase of 1,975, or
home prices began to steadily increase and were 31 percent from 2015. During 2016, production continued to increase, and by 2019, permitting of owner
up to $364,500 by 2019, an average increase of units totaled 10,400, an average increase of 680, or 8 percent, annually. Figure 17 shows the number of
$9,125, or 3 percent, annually. sales permits issued annually in the Travis County submarket.
Existing Prices Some recent developments include Breakwater, a single-family home development that will have 20 homes
The average sales price of a regular resale home upon completion. A total of 13 homes have already been completed, with three-to-seven-bedroom luxury
in Travis County was $398,100 during 2020, an homes with prices starting at more than $1 million. This development is to the west of the city of Austin,
increase of slightly more than 1 percent above near the Texas hill country. The Sorrento, in eastern Travis County, is a 116-home subdivision that began
the average price during 2019. The average sales construction in 2019 and is completely sold out. Home prices range from $278,000 to $335,000 for two-
price of a regular resale home is slightly higher and three-bedroom homes. Developments under construction in downtown Austin include the 33-story
Comprehensive Housing Market Analysis Austin-Round Rock, Texas
U.S. Department of Housing and Urban Development, Office of Policy Development and ResearchYou can also read