2.11.20 Broome County's 2020 Economic Outlook Guide - Greater ...
←
→
Page content transcription
If your browser does not render page correctly, please read the page content below

2.11.20

Broome County’s
2020 Economic     Brought to you by:   Title Sponsor:

Outlook Guide

Helping businesses thrive
    is important.
    At M&T Bank, we understand that small business is the
    lifeblood of any thriving community. Which is why we are
    committed to providing our support and keeping our lending
    decisions local. See what we can do for your business at
    your neighborhood branch or mtb.com today.

Equal Housing Lender. ©2018 M&T Bank. Member FDIC.
WELCOME TO THE 2020
                                          ECONOMIC OUTLOOK GUIDE
                                          FOR BROOME COUNTY
                                          Over the past few years, our              Thank you for your interest in the
                                          Economic Outlook Guide has proven         Greater Binghamton Chamber of
                                          to be useful for businesses across        Commerce and your continued
                                          various industries and of all sizes.      commitment to building our
                                          We know that not every business           economy. Please take a moment
                                          has the luxury of a team of market        to let us know how we are doing
                                          researchers. So, let this Economic        and how we can assist your
                                          Outlook Guide be your resource for        business needs - email sduncan@
                                          up to date information.                   greaterbinghamtonchamber.com.

                                          Our Broome County Economic                I would like to congratulate
                                          Outlook Guide has been a valuable         Telehealth 365, Ansco Camera
                                          tool for our members over the past        Factory, 50 Front Luxury
                                          few years and we are excited to           Apartments and Jordan Patch
                                          publish it again in 2020. This guide      for being our Building BC award
                                          can be used by local businesses to        winners this year. Thank you for your
                                          provide additional information for        investment in our community!
                                          market research. Businesses having
                                          additional insight as to where the        I would like to give a very special
                                          economy is headed, will help improve      thank you to all our sponsors who
                                          their ability to make better decisions.   make this Economic Forecast
                                                                                    & Building BC Awards possible.
                                          Evidence based decision making            These sponsors include: M&T Bank,
                                          is important whether you work in          Delta Engineers, Architects, &
                                          a nonprofit, the public sector or         Land Surveyors DPC, Andrew R.
                                          all types of businesses. Gathering        Mancini Associates Inc., Newman
                                          the information necessary to make         Development Group, Greater
                                          these educated decisions is not an        Binghamton Association of
                                          easy task and can usually take a lot      Realtors, WNBF News Radio 1290
                                          of time. This guide is designed to        (Townsquare Media Binghamton),
                                          provide your business with some           WBNG, and Idea Kraft.
                                          of the information you may need
                                          throughout the year. M&T Bank’s           Stacey Duncan,
                                          Regional Economist, Gary Keith,
                                          provides excellent insight into the
                                          year ahead.
                                                                                    President & CEO
                                          The work the Chamber does is              Greater Binghamton Chamber of
                                          diverse, but at the heart of what we      Commerce
                                          do is helping business thrive in our
                                          region. This year we are incredibly       Executive Director
                                          excited for our new partnership with      The Agency BC IDA/LDC
                                          The Agency through our Leadership
                                          Alliance. This new collaboration of
                                          economic and business development
                                          helps create a healthy economic
                                          climate in the Greater Binghamton
                                          area and is critical to our success and
Designed by Idea Kraft | idea-kraft.com   revitalization.

                                                                                                   CEO MESSAGE       1
WELCOME TO THE 2020
                      ECONOMIC OUTLOOK
                      Here in Binghamton, excitement is       our communities thrive.
                      growing and momentum is building,       That’s why we continue to support
                      as we take big steps forward to         and contribute to this guide. We
                      achieve our economic resurgence.        understand the value it provides
                      Last year, one of the biggest steps     local companies and believe it’s
                      we took was the formation of the        important for all of us to have this
                      Leadership Alliance, knocking down      information available.
                      silos and building new partnerships
                      that will forever strengthen both       As you look through the guide,
                      the Greater Binghamton Chamber          I hope you’ll read it through
                      of Commerce and The Agency.             the lens of collaboration. Use
                                                              this information to deepen
                      It opens a new chapter for our          key relationships, identify new
                      region, a chapter that will be guided   businesses to partner with on
                      by collaboration. In this era, when     projects, and gather insights
                      every region in the nation has found    from the talented people who call
                      themselves in a fierce competition      Binghamton home. By thinking this
                      for the best and brightest,             way—just like the Chamber and
                      collaboration is no longer an option.   The Agency—you will contribute
                      It is absolutely essential.             to this new chapter that’s now
                                                              underway. Working together, we
                      By focusing on collective action,       can accelerate innovation and drive
                      we can achieve economic impacts         our economic growth.
                      that foster inclusive, regional
                      growth. We’re at our best when
                      we’re working together.                 Peter Newman

                      Bringing the leadership of the
                      Chamber and The Agency together
                      serves as an example for the rest       M&T Bank,
                      of the business community. We           Regional President
                      understood the challenges ahead of
                      us. We assessed the effectiveness
                      of previous models. And we built an
                      innovative plan rooted in and driven
                      by collaboration.

                      It’s a sound approach for any
                      business that is considering a bold
                      strategy for greater success.

                      At the heart of our decision-making
                      process, there were facts and data
                      — and that’s exactly what business
                      leaders will find in this Economic
                      Outlook Guide. It’s the place to turn
                      for the information you need before
                      your next business decision.

                      At M&T Bank, we remain
                      unwavering in our commitment to
                      helping local businesses grow and

2   SPONSOR MESSAGE
BUSINESS LEADER
OUTLOOK FOR 2020
GREATER BINGHAMTON ECONOMIC
OUTLOOK SURVEY
This survey gives the community a sense of the current economic
climate in our region. As we conduct this survey each year we will be
able to chart the trends year over year and see how accurately the data
reflects on what is happening in our business marketplace.

WHO PARTICIPATED IN THE GREATER
BINGHAMTON BUSINESS LEADER SURVEY?
• 40% of respondents were Business Owners/CEOs or the main
  management decision makers
• 68% of the respondents employ 50 or less employees
• Diverse disbursement of different business classifications
• 41% said their business was located in the City of Binghamton;
  16% the Town of Vestal; and 1% use multiple locations

                                           BUSINESS LEADER OUTLOOK        3
SURVEY RESULTS

          BUSINESS ROLE                                                     BUSINESS LOCATION
                           u Business Owner/CEO - 40%                                          u City of Binghamton - 41%

                           u Business Management - 23%                                         u Town of Vestal - 16%

                           u Non-Profit - 10%                                                  u Village of Johnson City - 9%

                           u Other - 10%                                                       u Village of Endicott - 6%

                           u Business Sales/Marketing - 6%                                     u Village of Endwell - 6%

                           u Business Administration - 6%                                      u Other - 6%

                           u Government Employee - 3%                                          u Town of Conklin - 4%

                           u Elected Official - 2%                                             u Town of Dickinson - 4%

                                                                                               u Town of Binghamton - 1%

                                                                                               u Town of Colesville - 1%

                                                                                               u Town of Kirkwood - 1%

                                                                                               u Town of Windsor - 1%

                                                                                               u Multiple Locations - 1%

           BUSINESS TYPE                                                   NUMBER OF EMPLOYEES
                           u Other - 15%                                                       u 11 - 50 - 40%
                           u Manufacturing & Transportation - 11%                              u 1 - 10 - 28%
                           u Health Care & Social Assistance - 10%                             u 250+ - 14%
                           u Professional/Scientific & Technical - 9%                          u 51 - 99 - 11%
                           u Educational Services - 6%                                         u 100 - 250 - 8%
                           u Services - 6%

                           u Finance & Insurance - 6%

                           u Business Services - 6%

                           u Construction - 5%

                           u Non-Profit Services - 5%

                           u Retail/Trade - 5%

                           u Information - IT/Technology - 4%

                           u Real Estate/Rental/Leasing - 4%

                           u Accommodation & Food Service - 4%

                           u Arts, Entertainment & Recreation - 4%

                           u Utilities/Energy - 2%

    TOP 5 LOCAL BUSINESS                                                TOP 5 NATIONAL FACTORS THAT
        CHALLENGES                                                       IMPACT ECONOMIC OUTLOOK
          1. Employee health care costs                                            1. Cost of healthcare
       2. Attracting and retaining employees                                        2. Access to talent
          3. Business taxes and regulation                                    3. Federal/State wage/hour laws
           4. Lack of qualified workers                                           4. Federal legislation
          5. Regional economic climate                                                  5. Tariffs

4   BUSINESS LEADER OUTLOOK
20

                                                                     SURVEY RESULTS      10

                                                                                          0
                                                                                                         Expand            Decline       Remain Unchanged

              2020 ECONOMY PREDICTION                                                                             2019 VS 2020 OUTLOOK
                                                                                              50
50

                                                                                              40
40

                                                                                              30
30
                                                              u Expand - 48%                                                                                         u More Optimistic - 46%
                                                              u Decline - 11%                                                                                        u Less Optimistic - 22%
                                                                                              20
20
                                                              u Remain Unchanged - 41%                                                                               u Unchanged - 32%
                                                                                         60
10                                                                                            10

                                                                                         50
 0                                                                                             0
              Expand          Decline      Remain Unchanged                                             More Optimistic    Less Optimistic        Unchanged

                                                                                         40

IN
 50 2020, BUSINESS LEADERS EXPECT THE BROOME                                              IN 2020, ECONOMIC OUTLOOKS HAVE CHANGED:
                                                                                         30
COUNTY ECONOMY TO:
                                                                                          When asked, almost half (46%) of the respondents had
When
40   asked, almost half (48%) of the respondents                                         20an improved outlook from last year. 22% expected a less
expected the economy to expand. 41% expected it to                                        optimistic future, while 32% were unchanged in their
remain
 30    unchanged, while only 11% expected a decline.                                     10views from 2019.

 20
                                                                                          0
                                                                                                       Increase        Decrease       Stay The Same       Not Sure

         SALES REVENUE EXPECTATIONS                                                                        WORKFORCE EXPECTATIONS
 10
60                                                                                             50

     0
50        More Optimistic     Less Optimistic      Unchanged
                                                                                               40

40
                                                              u Increase - 58%                 30                                                             u Increase - 48%

30                                                            u Decrease - 7%                                                                                 u Decrease - 6%
                                                              u Stay the same - 26%            20                                                             u Stay the same - 42%

20                                                            u Not sure- 9%                                                                                  u Not sure- 5%

                                                                                               10
10

 0                                                                                                 0
              Increase      Decrease     Stay The Same    Not Sure                                          Increase       Decrease       Stay The Same       Not Sure

         50
IN 2020, BUSINESS LEADERS EXPECT THEIR SALES                                              IN 2020, BUSINESS LEADERS EXPECT THEIR
REVENUE TO:                                                                               WORKFORCE TO:
  40 asked, over half (58%) of respondents expected
When                                                                                      When asked, 48% of the respondents expected an increase
their sales revenue to increase. Only 7% expected a                                       in workforce. 6% expected a decrease in workforce
decrease
  30     and 26% expected them to stay the same.                                          numbers, while 42% expected it to stay the same.

         20
                                                                                                                                     BUSINESS LEADER OUTLOOK                           5
6 ECONOMIC FORECAST

2020 US & BINGHAMTON AREA ECONOMIC OUTLOOK
        GARY KEITH - VICE PRESIDENT, REGIONAL ECONOMIST, M&T BANK

                                                           ECONOMIC FORECAST   7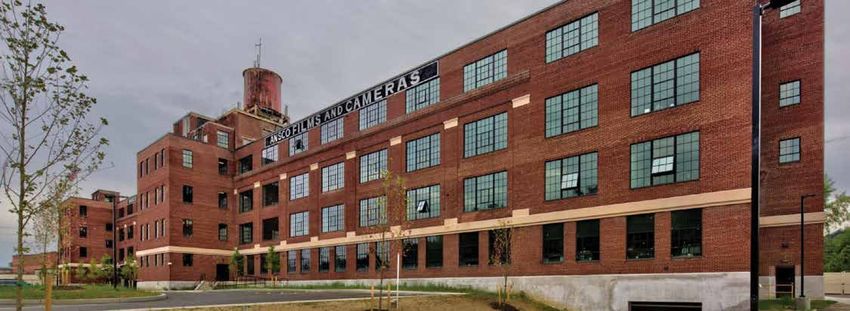
2020 US & BINGHAMTON AREA ECONOMIC OUTLOOK
                GARY KEITH - VICE PRESIDENT, REGIONAL ECONOMIST, M&T BANK

 8   ECONOMIC FORECAST
2020 US & BINGHAMTON AREA ECONOMIC OUTLOOK
GARY KEITH - VICE PRESIDENT, REGIONAL ECONOMIST, M&T BANK
ECONOMIC FORECAST 92020 US & BINGHAMTON AREA ECONOMIC OUTLOOK
GARY KEITH - VICE PRESIDENT, REGIONAL ECONOMIST, M&T BANK
10 ECONOMIC FORECASTBROOME COUNTY DEMOGRAPHICS
POPULATION HOUSING TOP EMPLOYERS
Population................................... 191,659 Housing Units.............................. 91,234 IN BROOME COUNTY
Population change since 2010...-4.5% Owner-occupied housing Binghamton University..............5,943
unit rate............................................ 65.3%
Female population......................50.8% United Health Services, Inc......... 5,428
Median value of owner-occupied
Male population........................... 49.2% Lockheed Martin...........................2,700
housing units.......................... $115,600
Persons under 5 years..................5.2% Broome County........................... 2,500
Median selected monthly owner
Persons under 18 years.............. 19.3% costs with a mortgage.............. $1,198 Lourdes Hospital............................ 2,311
Persons 65 years & over............. 19.1% Median selected monthly owner BAE Systems ................................ 1,300
Median age....................................... 40.2 costs without a mortgage.......... $515 IBM...................................................... 1,100
Veterans.......................................... 11,857 Median Gross Rent........................ $766 I3 Electronics.................................. 1,100
Number of households........... 78,594 Maines Paper & Food Service.... 1,100
Persons per household.................2.34
RACE & ETHNICITY
TOP INDUSTRIES
EMPLOYMENT
Health Care and Education
Full-time, year-round civilian Tourism & Hospitality
employed population 16 years
and over, Broome County Manufacturing – Aerospace,
Computer & Electronics
Civilian Labor Force Professional, Technical and
(Percent of population).............57.9% Business Services Growth Sectors
White...............................................86.0% Mean travel time to work...19.7 mins Renewable Energy
Black or African American.........6.2% Median household income...$50,859 Advanced Manufacturing –
Asian.................................................. 4.4% Unemployment rate......................4.3% Small Systems Integration,
Next Generation Transportation
Hispanic or Latino..........................4.3% Persons in poverty........................17.3%
Agriculture – Food Processing
Health Care
EDUCATION
91% 28%
High School graduate
or higher.........................................90.5%
Bachelor’s degree or higher... 28.3%
https://www.census.gov/quickfacts/fact/table/broomecountynewyork/PST045219
ECONOMIC FORECAST 11• Pre-Construction • De
•• Pre-Construction
General Construction • Desig
• Bu
•• General Construction
Post-Construction • Build
• Pre-Construction •• Post-Construction
Design and Build
• General Construction • Build to Suit and Lease Back
• Pre-Construction
• Post-Construction
• General Construction
• Design and Build
• Build to Suit and Lease Back
• Post-Construction
BUILDING TOMO
BUILDING
BUILDING TOMOR
TOMORROW
DING TOMORROW
12 ECONOMIC FORECASTNews Radio 1290 WNBF is a heritage
news/talk radio station located in Binghamton, NY.
We are where news breaks first!
WNBF congratulates the winners of the
2020 Building BC Awards
WWW.WNBF.COM
ECONOMIC FORECAST 13ENGINEERS, ARCHITECTS, & LAND SURVEYORS
Delta provides an integrated set of
professional design and support services
to make your next project a success.
We are your trusted partner.
The Roxbury at Stratton Falls
delta - eas.com
AN ISO 9001:2015 CERTIFIED COMPANY
14 ECONOMIC FORECASTWORKFORCE STATS
1
UNEMPLOYMENT RATES
UNEMPLOYMENT RATES
(Not Seasonally
(Not seasonally Adjusted)
adjusted)
October October Net Source: Local Area Unemployment Statistics (LAUS)
Area
2010 2019 Change
United States 9.0% 3.3% -5.7
New York State 8.2% 3.9% -4.3
Broome County 8.0% 4.3% -3.7
Source: Local Area Unemployment Statistics (LAUS)
6
NET CHANGE
NET CHANGE IN POPULATION,
IN POPULATION, BROOME
BROOME COUNTY, 2010-2019
COUNTY, 2010-2019
(By
(ByAge Group)
Age Group)
3,000
2,473 Source: Economic
2,000 1,631 1,613
Modeling Specialists
1,380
International (EMSI)
1,000
440 336
95 123
0
Note: Details may not add to totals due to rounding. Not Seasonally Adjusted. -287
-309
-473
-1,000 -633
Source: Current Employment Sta;s;cs (CES) survey -829
-2,000
-1,407 1
-2,056
-3,000 -2,652
-4,000
-5,000
Unemployment
-4,440
Rates
(not seasonally adjusted)
-4,833
-6,000
10 to 14
20 to 24
30 to 34
40 to 44
50 to 54
65 to 69
35 to 39
55 to 59
70 to 74
25 to 29
60 to 64
85 and over
80 to 84
15 to 19
75 to 79
5 to 9
45 to 49
Under 5
December December Net
Area
Source: Economic Modeling Specialists International (EMSI)
2010 2017 Change
United States 9.1% 3.9% -5.2
NUMBER OF PRIVATE SECTOR JOBS 2
New 2ND
BROOME COUNTY, QUARTER8.2%
York State 4.4%
OF EACH YEAR -3.8
NUMBER
(Not OF PRIVATE
Seasonally SECTOR
Adjusted) JOBSCounty
Broome 8.8% 5.6% -3.2
BROOME COUNTY, 2ND QUARTER OF EACH YEAR
(Not seasonally adjusted)
71.5
71.0
71
70.6
70.5
70.5 70.4
70.1
70
69.5
69 68.9
68.7 68.7
68.6
68.5 68.4
68
67.5
67
2010 Note:
2011Not Seasonally
2012 Adjusted
2013 2014 2015 2016 2017 2018 2019
Note: Details may not add to totals due to rounding. Not Seasonally Adjusted.
Source: Local Area Unemployment Sta;s;cs (LAUS)
Source: Current Employment Sta;s;cs (CES) survey
WORKFORCE STATISTICS 15WORKFORCE STATS
3
CHANGE INEMPLOYMENT
CHANGE IN EMPLOYMENT BY INDUSTRY, BROOME COUNTY, 2010-2018
BY INDUSTRY,
BROOME COUNTY, 2010-2018
Health Care and Social Assistance 1,110
Accommodation and Food Services 990
Other Services, Ex. Public Admin 520
Real Estate and Rental and Leasing 320
Management of Companies and Enterprises 290
Transportation and Warehousing 230
Mining 10
Educational Services -40
Agriculture, Forestry, Fishing and Hunting -40
Arts, Entertainment, and Recreation -120
Construction -150
Wholesale Trade -190
Professional and Technical Services -240
Information -290
Administrative and Waste Services -320
Finance and Insurance -690
Retail Trade -820
Manufacturing -2,370
Total, All Government -2,860
-3,500 -3,000 -2,500 -2,000 -1,500 -1,000 -500 0 500 1,000 4 1,500
CHANGE INEMPLOYMENT
EMPLOYMENT BY INDUSTRY, SOUTHERN TIER REGION, 2010-18
Source: Quarterly Census of Employment and Wages (QCEW)
CHANGE IN BY INDUSTRY,
SOUTHERN TIER REGION, 2010-2018
Accommodation and Food Services 2,980
Health Care and Social Assistance 1,460
Transportation and Warehousing 1,150
Management of Companies and Enterprises 660
Professional and Technical Services 630
Other Services, Ex. Public Admin 410
Agriculture, Forestry, Fishing and Hunting 350
Real Estate and Rental and Leasing 290
Arts, Entertainment, and Recreation 220
Wholesale Trade -130
Construction -170
Utilities -170
Information -200
Mining -240
Educational Services -440
Administrative and Waste Services -600
Finance and Insurance -1,020
Retail Trade -1,540
Manufacturing -2,490
Total, All Government -5,960
-7,000 -6,000 -5,000 -4,000 -3,000 -2,000 -1,000 0 1,000 2,000 3,000 4,000
5
AVERAGE INDUSTRY WAGES,
Source: Quarterly Census of Employment and Wages (QCEW)
AVERAGE INDUSTRY WAGES, BROOME BROOME COUNTY 2018
COUNTY, 2018
Management of Companies and Enterprises $70,736
Finance and Insurance $67,641
Manufacturing $65,673
Construction $59,118
Professional and Technical Services $55,095
Wholesale Trade $53,207
Total, All Government $51,478
Health Care and Social Assistance $50,279
Mining $45,245
Total, All Industries $44,834
Information $41,907
Transportation and Warehousing $39,515
Real Estate and Rental and Leasing $37,792
Administrative and Waste Services $34,423
Agriculture, Forestry, Fishing and Hunting $30,881
Retail Trade $27,095
Other Services, Ex. Public Admin $23,646
Educational Services $22,121 Source: Quarterly Census
Accommodation and Food Services $18,450
Arts, Entertainment, and Recreation $16,411 of Employment and Wages
$0 $10,000 $20,000 $30,000 $40,000 $50,000 $60,000 $70,000 $80,000
(QCEW)
Source: Quarterly Census of Employment and Wages (QCEW)
16 WORKFORCE STATISTICSRESIDENTIAL REAL ESTATE
HOUSING AFFORDABILITY INDEX
This index measures housing DECEMBER YEAR TO DATE
affordability for the region.
274 270
For example, an index of 120 252
249 241 239
means the median household
income is 120% of
what is necessary to qualify
for the median-priced home
under prevailing interest -2.1% -8.0% -1.2% +5.1% -10.7 -0.8%
rates. A higher number means
2017 2018 2019 2017 2018 2019
greater affordability.
AVERAGE SALES PRICE
DECEMBER YEAR TO DATE
Average sales price for all $133,758
closed sales, not accounting $129,558
$122,058 $122,386 $129,050
for seller concessions, in a $120,678
given month.
+0.5% +7.4% -5.8% +1.0% +5.4% +3.6%
2017 2018 2019 2017 2018 2019
CLOSED SALES
DECEMBER YEAR TO DATE
A count of the actual sales 191 2,133 2,130
179 178 2,067
that closed in a given month.
-5.3% -0.6% +7.3% +4.6% +3.2% -0.1%
2017 2018 2019 2017 2018 2019
Current as of January 10, 2020. All data from the
Greater Binghamton Multiple Listing Service. Provided
by the New York State Association of REALTORS®.
Report © 2020 ShowingTime.
RESIDENTIAL REAL ESTATE 17TOYS FOR
CHOW
TOTS
SOUTHERN
BINGHAMTON
TIER
ZOO AT
HOMELESS
ROSS PARK
COALITION
SUPPORTING OUR COMMUNITY
IN SO MANY WAYS!
2000+ homes SOLD to valued members of our community
each year!
HOMELESS
THE VETERANS
HOUSING & A ROOM
HUMANE CLEAR TO HEAL
SOCIETY PATH FOR
VETERANS
THE GREATER BINGHAMTON ASSOCIATION OF REALTORS®, INC.
19 Jennison Avenue, Johnson City, NY 13790 (607) 729-6285
18 COMMERCIAL REAL ESTATECOMMERCIAL REAL ESTATE 19
PROJECTS IN THE WORKS

                                                         CANOPY GROWTH
                                                         This project will establish a large agri-pharma
                                                         industrial facility to process, manufacture, package and
                                                         distribute federally legal hemp derived CBD products.
                                                         The facility will receive bulk hemp from local farm
                                                         producers and manufacture hemp-derived products
                                                         in a clean, industrial, licensed, food or pharmaceutical
                                                         grade environment. Modeled on Canopy Growth’s
                                                         headquarters and Canadian central processing the
                                                         upgrading and pharma manufacturing facility in
                                                         Smiths Falls, Ontario is the single largest legal
                   LOFTS@JC
                                                         cannabis and hemp derived product manufacturing
                   The LOFTS@JC project consists of
                                                         facility in the world. The Binghamton facility will see
                   the demolition of the abandoned
                                                         the Southern Tier become a leader in the growing,
                   Dollar Store, located at 128 Grand
                                                         harvesting and manufacturing in the federally legal
                   Ave, Johnson City. The site will be
                                                         CBD derived product space. The project will employ
                   replaced with a modern apartment
                                                         75 people within 3 years with the potential to employ
                   complex. Development will consist
                                                         400 people total.
                   of a three-floor (and basement
space for recreational activities) with 24 residential
units comprised of a mix of twelve 3-bedroom,
six 2- bedroom and six 1-bedroom units. The total
square footage is approximately 31,500 and the
building will be built with metal and wood assembly,
modern doors, windows and other finishes. The
exterior colors will be consistent with the essence
of the revitalized schemes in this part of Johnson
City. The location is in close proximity to UHS
Hospital, one of the area’s largest employers, and
the Binghamton University School of Pharmacy and
the School of Nursing and Health Sciences. The new
Health Sciences Campus will bring in approximately
1,100 undergraduates and graduate students, and its
employees, creating a demand for more housing.

This project will continue to help with the
revitalization of the Village of Johnson City and will
service this growth, by providing necessary housing
for the expected influx of young professionals,
hospital staff, research staff, and undergraduate and
graduate students.

20    COMMERCIAL REAL ESTATE
2020 INNOVATIVE AWARD
THIS AWARD
RECOGNIZES A PROJECT,
PRODUCT, OR SERVICE THAT
“THINKS OUTSIDE THE BOX”
AND CONTINUES TO STRETCH
THE BOUNDARIES AND HAS
PROVEN TO BE A LEADER
IN INNOVATION.
TELEHEALTH365
Telehealth365 is a leader in healthcare, providing saved patients both the time and money that would be
under-serviced communities with low cost access to required for them to travel to Dermatologists in person
medical professionals. By utilizing video and audio and the extensive waiting period before their visit. This
platforms in accordance with HIPPA policy, this business service allowed one patient to start skin cancer treatment
reaches those in communities who would not otherwise immediately, rather than waiting ten months until she was
be able to receive medical advice and care. able to visit her regular Dermatologist. The program has
also increased the revenue of healthcare facilities, such
Telehealth 365 uses advanced medical technology to as Bassett Healthcare Network Hospital, by referring
enhance patient interaction. For example, they have patients for procedures such as blood tests and biopsies.
developed a stethoscope that effectively complies with
the audio/video platforms which allows a cardiologist to Under the leadership of Bipan Sharma, VP of Technology
hear the patient’s heartbeat in real time! This strategy can Collaboration, Telehealth365 is flourishing within the
provide patients with advice and evaluations similar to local community. They currently serve the Federally
those that they would receive in person. Qualified Health Centers (FQHC) communities covered by
Medicare and Medicaid by providing an immediate access
Telehealth365’s mission is to improve the quality of life in to healthcare.
rural, under-served communities. One of Telehealth365’s
new initiatives is Tele-Dermatology program in Telehealth 365 is a local success story in the
Cooperstown, NY in which patients are able to receive Incubator with hopes of growing and expanding here in
immediate access to medical professionals. This has Broome County.
BUILDING BC AWARD WINNERS 212020 RESTORATIVE AWARD
THIS AWARD RECOGNIZES
A PROJECT THAT BRINGS
NEW LIFE INTO AN AGING
HISTORICAL BUILDING.
ANSCO CAMERA
FACTORY
When Paulus
Development acquired
the former General Cigar
Company – Ansco Camera
Factory Building in
June 2018, it was an aging, underutilized, and neglected
building with a storied past. It was a building in need of
new life. Many people may have viewed such a property
with contempt, but the folks at Paulus Development saw While this project is not only telling of the building’s
it as a great opportunity. Paulus Development invests in tremendous story, it also fulfilled an essential desire of
underutilized urban properties and works to revitalize the community. What once was an eyesore for the
them into an effective catalyst for change. First Ward neighborhood, now serves as an example of
how public-private partnerships can create an intangible
In July 2019, Paulus Development completed its $25 sense of pride for the community. This sense of pride
million historic rehabilitation of the former Ansco will encourage others to continue to invest in the First
Camera Factory in Binghamton. Located just outside Ward neighborhood, the City of Binghamton, and
of Downtown Binghamton in the city’s First Ward Broome County.
neighborhood, it is now home to 100 market-rate lofts
of various sizes and 35,000 square feet of commercial
space for local businesses. All 100 market-rate lofts
were leased and over 97% of the commercial space was
leased. Utilizing the history of the Binghamton building,
which had served as the manufacturing facility for two
of the most notable industries in Binghamton history--
cigar manufacturing and camera manufacturing—Paulus
Development seized this as an opportunity to quench the
need for high-quality, affordable, market-rate apartments
and commercial space for local businesses.
22 BUILDING BC AWARD WINNERS2020 TRANSFORMATIVE AWARD
50 FRONT LUXURY
APARTMENTS
The 50 Front Street
project was a major
investment into Binghamton. This 30-million-dollar
project has the potential to spur economic development
in the area and help to produce a great place to live, work
and play within Binghamton.
50 Front Street was a blighted site that needed
new direction and life. From the vision of Newman
Development Group this concept was turned into a
reality and will have a long and lasting impact on the
quality of life for the residents of Binghamton’s Westside.
Newman Development is a real estate development
company that has been headquartered in Vestal for
over 30 years. It specializes in all aspects of real estate
development, redevelopment, acquisition, commercial,
retail, student housing, multi-family, and mixed-use
housing. Seeing the need within the community, and
the opportunity to create a community transforming
building, Newman Development Group revolutionized
50 Front Street into a cutting edge, urban property
featuring many upscale amenities, such as security, Wi-Fi,
a Clubroom, fitness center, and underground parking.
This location is one of the first new “ground up”
apartment buildings built in Broome County within the
past 30 years. Benefiting both residents and commercial
tenants, 50 Front Street has created new jobs and has
provided commercial space for businesses to locate. The
THIS AWARD initiative has also brought housing to the City in close
RECOGNIZES A PROJECT proximity of Downtown with a beautiful view of the river.
THAT IMPACTS THE ENTIRE
COMMUNITY AND FOSTERS This transformation is expected to trigger additional
GROWTH OF THOSE AROUND IT revitalization in the area, not limited to more market-rate
OR A PRODUCT/SERVICE THAT housing, offices, commercial restaurants and positive
HAS INFLUENCED impacts on existing businesses.
YOUR INDUSTRY IN A
CUTTING-EDGE WAY.
BUILDING BC AWARD WINNERS 232020 INDIVIDUAL AWARD
JORDAN PATCH
Animal Adventure
Park is an interactive,
educational animal park,
designed to promote
up close and hands-on
animal encounters to
develop an appreciation
for animals. It aims to
achieve education and
conservation through
understanding and
appreciation.
Under the leadership and vision of Jordan Patch, Animal THIS AWARD
Adventure attracts guests from around the world, RECOGNIZES
traveling to Harpursville, NY from as far as the United AN INDIVIDUAL WHOSE
Kingdom, Australia and Japan on an annual basis. More INVESTMENT POSITIVELY
than 150,000 guests attend the park each season to IMPACTS THE QUALITY
see the animal collection that now boasts close to 100 OF LIFE AND JOB
species, many threatened or endangered. One of the GROWTH TO ENSURE
Park’s most notable media presences is its world-famous THE SUCCESS OF THE
Giraffe Cam. Adventure Park REGION’S COMMUNITIES
has been an active AND ECONOMY.
The Park provides educational school field trips, hosting member in supporting
165 groups in 2019. Additionally, the Park promotes not only its own mission,
a “Zoo to You” program, which delivers animals and but those of local non-profits
educational messages to classrooms, day cares, senior as well.
centers, corporate functions, charity events, festivals,
fairs, scout events, and many others. The Park employs close to 50 seasonal
team members from May through
Supporters of Animal Adventure also contribute significant December, but also maintains a team of 10
funds to the Park’s annual appeals to help non-profits in full time Animal Care Team professionals that have
our community. Contributions allowed the Park to gift over either been sourced locally or have relocated to Broome
$42,500 to HCA (Helping Celebrate Abilities) in 2019. County specifically to work at the park. Zoologists have
come from many locations, including Alaska, Virginia,
Animal Adventure Park has been impactful on local Massachusetts, and New Jersey.
non-profit organizations, donating to countless benefits,
charity events, and initiatives. Some of the Park’s notable Animal Adventure Park, also endorses the idea
partnerships are with HCA, First Ward Charities, PARP/ of “keeping it local.” Every item consumed by the
literary programs in local schools, LUMA, and Windsor Park--such as construction materials, construction and
Central School District’s Scholastic Challenge. Providing engineering labor, insurances, animal and human food
donations, sponsorships, and merchandise, Animal and drink, clothing and other logoed merchandise--is
sourced locally.
24 BUILDING BC AWARD WINNERSWe are a branding and digital design agency BRAND IDE NTITY WE B DE SIGN AND DEVELOPMENT PRINT DE SIGN DIGITAL MARKETING VIDE O PROD UCTION Meet the team and see our work at: idea-kraft.com
You can also read