Public-Private Partnerships in California - How Governments Can Innovate, Attract Investment, and Improve Infrastructure Performance - Bay Area ...
←
→
Page content transcription
If your browser does not render page correctly, please read the page content below
August 2018

Public-Private
Partnerships in California
How Governments Can Innovate,
Attract Investment, and Improve
Infrastructure Performance

Acknowledgments
This report was developed and written by Will Hewes, Director   Dale Bonner, Executive Chairman – Plenary Concessions
at Table Rock Infrastructure Partners, and Sean Randolph,       Mike Marasco, CEO – Plenary Concessions
Senior Director at the Bay Area Council Economic Institute.
The Bay Area Council Economic Institute would like to thank     William Gorham, Senior Associate – Plenary Group
many people for providing input and reviewing this report.      Stuart Marks, Group Co-Head, Origination (West) – Plenary
                                                                   Group
Samara Barend, Senior Vice President, North America
  Strategic Development Director for Public-Private             Sia Kusha, Group Head, Project Development and Partnering–
  Partnerships – AECOM Capital                                     Plenary Group
Ignacio Barandiaran, Principal – Arup                           Stan Williams, Vice-President, Project Development –
                                                                   Poseidon Water
Orion Fulton, Associate Principal – Arup
                                                                Victoria Stackwick, Principal Legislative Analyst – San Diego
Michael Gomez, Director, Public Finance – Barclays                 Association of Governments
Chris Roberts, Director – Barclays Investment Bank              Carey Batha, Senior Environmental Scientist – San Francisco
Rachel Factor, Senior Planner – BART                              Bay Conservation and Development Commission

Zach Knight, Co-Founder and Managing Partner –                  Larry Goldzband, Executive Director – San Francisco Bay
  Blue Forest Conservation                                         Conservation and Development Commission

Nick Wobbrock, Co-Founder and Partner –                         Tilly Chang, Executive Director – San Francisco County
   Blue Forest Conservation                                         Transportation Authority

Nizar Melehani, Program Manager (retired) – California          Jim Bourgart, Transportation and Infrastructure Policy –
   Department of Transportation                                    San Mateo County

Fred Silva, Senior Fiscal Policy Advisor – California Forward   Bob Marks, Transportation and Infrastructure Policy –
                                                                  San Mateo County
Andrew Fahlund, Senior Program Officer – California
  Water Foundation                                              Keith Lew, Deputy Director – Sonoma County General
                                                                  Services Department
Mark Taylor, Chief of Staff, Office of Mayor Robert Garcia –
  City of Long Beach                                            Suzanne Smith, Executive Director – Sonoma County
                                                                  Transportation Authority
Ian Parker, Managing Director, Public Sector and
   Infrastructure Banking – Goldman Sachs                       Daryl Halls, Executive Director – Solano Transportation
                                                                  Authority
Mark Pisano, Senior Advisor and Board President –
  Infrastructure Funding Alliance                               Michael Bennon, Managing Director – Stanford Global
                                                                  Projects Center
Dan Feitelberg, Principal – KPMG
                                                                Peter Luchetti, Managing Partner – Table Rock
Joshua Schank, Chief Innovation Officer – LA Metro Office of      Infrastructure Partners
   Extraordinary Innovation
                                                                Mark Zabaneh, Executive Director – Transbay
Yousef Salama, Innovation Manager for Public-Private              Joint Powers Authority
  Partnerships – LA Metro Office of Extraordinary Innovation
                                                                Richard Cummings, Director, Strategic Planning and
Jonathan Dingle, Investment Director – Meridiam                    Communications – University of California, Merced
John Dionisio, Business Development Director, North America     Ed Klotzbier, Associate Chancellor – University of California,
  – Meridiam                                                      Merced
Dan Carol, Senior Advisor on Infrastructure and Energy –        Wes Sullens, Director of Codes Technical Development –
  Office of California Governor Edmund G. Brown                   U.S. Green Building Council
Colin Kelly, Healthy Watersheds California Manager –            Jeremy Sigmon, Director, Technical Policy – U.S. Green
  Pacific Forest Trust                                             Building Council
Laurie Wayburn, Co-founder, Co-CEO, and President –             Shelley Doran, Senior Vice President – Webcor Builders
  Pacific Forest Trust
                                                                Scott Boardman, Executive Director – West Coast
Michael Houle, Senior Advisor – Partnerships BC                   Infrastructure Exchange
John Heisse, Partner – Pillsbury Winthrop Shaw Pittman LLP      Carsten Voecker, Principal, Director–North America –
Robert James, Partner – Pillsbury Winthrop Shaw Pittman LLP       Woods Bagot
Contents
Executive Summary....................................................1              Napa Civic Center................................................ 26
                                                                                    Los Angeles Convention Center.......................... 27
Introduction................................................................3
                                                                                    Los Angeles Civic Center..................................... 27
   Infrastructure Investment Status................................. 3
                                                                                    Sonoma County Government Center.................. 27
   The Role of Public-Private Partnerships...................... 7
                                                                                    San Vicente Pumped Storage Project.................. 28
   California P3 Background........................................... 8
                                                                                    Santa Clara Valley Water District.......................... 28
   Global P3 Adoption.................................................... 9
                                                                                    Central Contra Costa County Sanitary District ..... 28
   P3 Adoption in the U.S............................................. 10
                                                                                    Santa Clara County Civic Center.......................... 29
   A New Challenge: Adaptation to Climate Change..... 12
                                                                                    LA Metro............................................................... 29

Chapter 1                                                                           Huntington Beach Desalination............................ 29

California’s P3 Experience: The Past Five Years....... 13                           San Francisco Broadband..................................... 30

       Long Beach Civic Center...................................... 13             San Diego Association of Governments:
                                                                                    Otay Mesa East Port of Entry and Downtown
       UC Merced........................................................... 14
                                                                                    Bus Stopover and Multiuse Facility...................... 30
       Rialto Water & Wastewater Partnership............... 16
                                                                                 Long-Term Opportunities......................................... 30
       Long Beach Courthouse....................................... 18
                                                                                    TJPA Transbay Program........................................ 30
       Presidio Parkway................................................... 20
                                                                                    SR-37..................................................................... 31
       Carlsbad Desalination Plant................................. 22
                                                                                    High-Speed Rail.................................................... 32
       University of California, San Francisco
                                                                                    Dumbarton Corridor Transit................................. 32
       Neurosciences Building........................................ 24
                                                                                    Second Trans-Bay Tube........................................ 33

Chapter 2                                                                           Water Reuse Projects............................................ 33
California Pipeline:                                                                California WaterFix............................................... 33
The Next Five Years and Beyond.............................25
                                                                                    Stormwater Projects............................................. 34
   Projects in Development, Planned, or
                                                                                    Sustainable Groundwater
   Under Consideration................................................ 25
                                                                                    Management Act Implementation....................... 34
       LAX Automated People Mover (APM) and
                                                                                    Watershed Protection & Restoration.................... 35
       Consolidated Rent-A-Car Center......................... 25
                                                                                    Climate Adaptation Projects................................ 36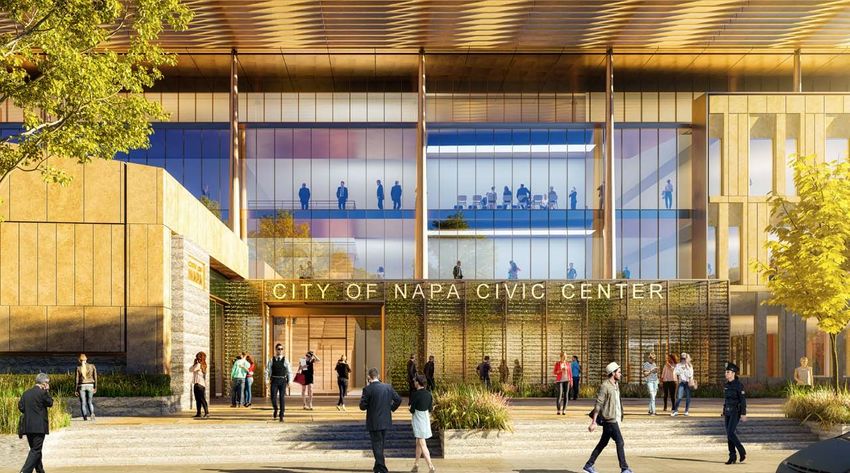
Contents , continued
Chapter 3
Building a Stronger California P3 Market................37 State-Level Authorizing Legislation...................... 42
Procurement Innovations.......................................... 37 State-Level CEQA Reform.................................... 43
P3 Offices and Programs...................................... 37 State-Level Public-Sector Resources.................... 43
Unsolicited Proposals........................................... 38 Federal-Level Tax-Exempt Financing................... 44
Progressive P3...................................................... 38 Federal-Level Flexibility and
Incentives for P3 Projects..................................... 45
Public Staffing and P3 Team Interaction.............. 39
Conclusion................................................................46
Stakeholder Engagement..................................... 40
Annotated Bibliography on
Value for Money Analysis..................................... 40
Procurement Performance.......................................47
Procurement and Contract Best Practices........... 41
Notes........................................................................49
Enhanced Infrastructure Finance Districts........... 41
Policy Reforms........................................................... 42
About the Institute Photo Acknowledgments
Since 1990, the Bay Area Council Economic Institute has The Economic Institute wishes to thank the sponsors
been the leading think tank focused on the economic and contributors who provided the P3 project
and policy issues facing the San Francisco/Silicon Valley architectural images and photos used in this report.
Bay Area, one of the most dynamic regions in the United
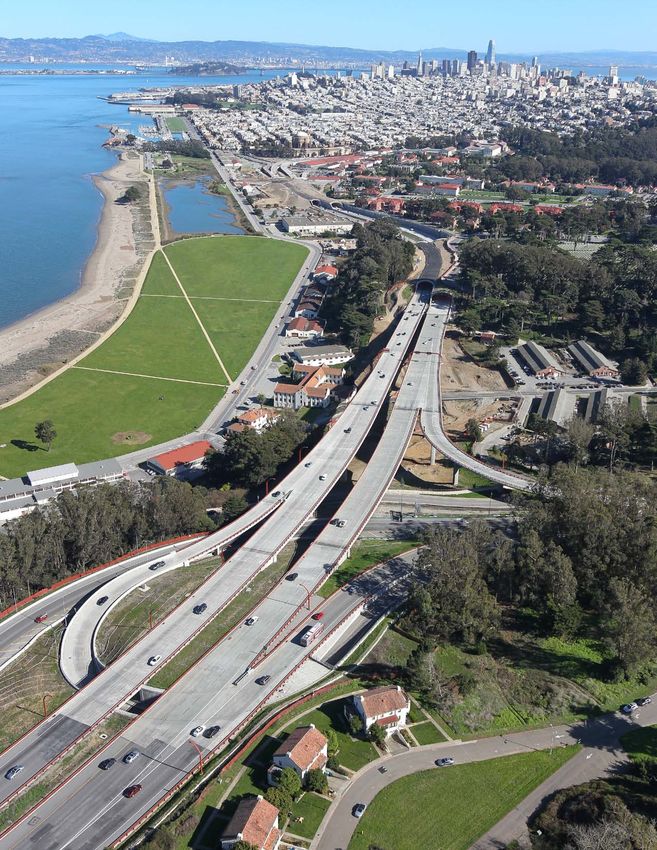
Presidio Parkway: Meridiam
States and the world’s leading center for technology and
innovation. A valued forum for stakeholder engagement Long Beach Civic Center: Plenary Group
and a respected source of information and fact-based UC Merced: UC Merced
analysis, the Institute is a trusted partner and adviser to
both business leaders and government officials. Through Rialto Water and Wastewater Partnership:
its economic and policy research and its many partnerships, Veolia North America
the Institute addresses major factors impacting the Long Beach Courthouse: Meridiam
competitiveness, economic development, and quality
of life of the region and the state, including infrastructure, Carlsbad Desalination Plant: Poseidon Water
globalization, science and technology, and health policy. LAX Automated People Mover:
It is guided by a Board of Advisors drawn from Los Angeles World Airports
influential leaders in the corporate, academic, non-profit,
and government sectors. The Institute is housed at and Napa Civic Center: Plenary Group
supported by the Bay Area Council, a public policy
organization that includes hundreds of the region’s largest
employers and is committed to keeping the Bay Area the
world’s most competitive economy and best place to live.
The Institute also supports and manages the Bay Area
Science and Innovation Consortium (BASIC), a partnership
of Northern California’s leading scientific research
laboratories and thinkers.
Public-Private
Partnerships in
California

             How Governments
             Can Innovate,
             Attract Investment,
             and Improve
             Infrastructure
             Performance
Presidio Parkway
Executive Summary
California’s vibrant economy and communities rely             Definitions of P3 vary widely, but most commonly refer
on an extensive infrastructure network of highways,           to long-term (typically 25+ years) performance-based
bridges, ports, levees, rail lines, public buildings, and     contracts with public-sector entities in which the private
energy, water, and wastewater systems. Over the past          sector takes or shares responsibility and risk for the
several decades, much of the state’s infrastructure has       design-build-finance-operate-maintain (DBFOM) elements
been inadequately maintained and is facing a backlog          of a public infrastructure project. P3s are not appropriate
of deferred maintenance, even as new needs arise.             for every project and will not by themselves solve the
Funding has not kept pace with aging infrastructure or        state’s infrastructure funding challenges, but properly-
the demands of a growing economy and population.              structured P3s have a demonstrated track record of
On the current spending trajectory, California’s              reducing the risk of cost overruns, accelerating project
infrastructure funding gap will reach $1 trillion by 2050.    delivery, and providing contractual guarantees for proper
Investment in infrastructure has one of the highest           operations and maintenance over the life of a public asset.
economic multipliers of any form of government
                                                              Public-private partnerships have played a modest but
spending, but due to California’s failure to invest in
                                                              important and growing role in infrastructure delivery in
and maintain its infrastructure at all levels, the state is
                                                              California to date. California was one of the first states
putting its future growth and prosperity at risk.
                                                              to adopt P3 legislation and has been home to some
While positive steps have been taken in recent years,         of the country’s most innovative projects. This report
business as usual is not delivering the infrastructure that   highlights seven of the most high-profile projects in
California needs to support economic and population           the state over the past five years, primarily in water and
growth in the decades ahead. In too many cases, public        social infrastructure. Public agencies in the state can look
agencies spend millions of dollars studying projects for      to these experiences and a substantial body of global
years or decades, making little progress toward actual        literature to understand both the limitations and the
delivery, even as delay sends costs through the roof.         substantial potential of P3s to deliver value to the public
When projects are built, frequent cost and schedule           through improved cost and operational performance.
overruns—typically 10–20%, but at times over 100%—            California is also developing a significant pipeline of
and subsequent failure to maintain assets over time           P3 projects in the years ahead. This report identifies
result in higher costs and a lower quality of services for    23 projects that are in active procurement or in the
the public. The need to improve on this sub-optimal           planning stages across a range of sectors, as well as
status quo will become more urgent as climate change          longer-term, large-scale projects that lend themselves to
places additional strain on existing infrastructure and       consideration as P3 procurements.
requires new investments to address rising sea levels
and shifting weather patterns.                                Despite this growing pipeline and its demonstrated
                                                              benefits, the use of P3s is much less widespread than
There is a demonstrated need to fundamentally                 it could be. The lessons from the past five years of
reform public infrastructure procurement in California        experience in California and elsewhere suggest the
and the U.S., accelerate project delivery, and drive          following best practices and innovations.
more widespread adoption of life-cycle management
                                                                P3 Offices and Programs: Rather than considering
approaches. Public agencies across the state have
                                                                just one-off projects, public agencies can develop
begun looking to public-private partnerships (P3s) as
                                                                broader P3 initiatives to build procurement expertise
a tool that achieves these goals by shifting the risk for
                                                                and consequentially larger, more impactful pipelines.
delivery and long-term management of infrastructure
assets to private partners. The role these partnerships         Progressive P3: The number of progressive P3s
can play in addressing California’s infrastructure needs is     in California is growing. In a progressive delivery
the primary focus of this report.                               procurement, the private partner is selected early in

                                                                                                                         1
Public-Private Partnerships in California

    the process, based on qualifications, and develops         procurement approach. Reforms that limit legal
    the contract and ongoing design collaboratively with       challenges and accelerate agreed categories of
    the public partner so as to maximize public input and      projects with minimal environmental impacts could
    opportunity for innovation.                                help the state reduce costs and uncertainty.

    Unsolicited Proposals: Public agencies such as LA          State-Level Public Resources: The state could
    Metro are accepting unsolicited project proposals,         provide expertise and limited financial assistance
    increasing the number and diversity of P3 projects that    to public agencies in order to build their capacity in
    are considered and incorporating technology solutions      P3 procurement. A California center of excellence
    that agencies are not well placed to consider in their     could provide standardized procurement documents,
    traditional project development processes.                 skills transfer, and vetting of third party advisors as a
                                                               way to accelerate procurement and provide public
    Public Sector Leadership: Projects benefit when            sector agencies with greater comfort in utilizing a new
    public agencies recognize the importance of having         delivery model. Limited predevelopment funding
    a political champion and dedicated staff that can          would help public agencies accelerate the earliest,
    advance P3 projects through the inevitable political,      highest-risk phases of projects. The state could
    financial, and technical challenges. This is critical to   also require that life-cycle costs and performance
    fostering the needed internal cultural changes when        in the project design, operations, and selection of
    adopting a new form of procurement. Access to              procurement approach must be considered for any
    transaction-oriented advisors with a track record of       project over a certain size that receives state funding.
    bringing P3 projects to close is also important.
                                                               Federal-Level Tax-Exempt Financing: There is a need
    Stakeholder Engagement: Early engagement of the            to level the playing field on the cost of capital for P3
    public, decision makers, and the labor community,          projects. While there are currently federal programs
    among others, is important to identifying and              that provide low-cost capital to P3 projects, they
    proactively addressing challenges that could stall a       apply only to certain types of projects or have limited
    project during the procurement or delivery phase.          capacity. Ensuring that all public infrastructure projects
                                                               have access to tax-exempt financing, regardless of
Policy changes at the state and federal levels can
                                                               how they are delivered, would provide public agencies
incentivize project delivery and life-cycle asset
                                                               with greater flexibility. Congress could do this by
management. Adopting these changes does not mean
                                                               removing the volume cap on private activity bonds
that every capital project in the state will be delivered
                                                               (PABs), eliminating the Alternative Minimum Tax
as a P3. Such changes would, however, provide public
                                                               penalty, expanding the types of projects eligible for
agencies with additional tools that may allow them to
                                                               PABs (as proposed in the Public Buildings Renewal Act
deliver major projects in a manner that is more cost-
                                                               of 2017, H.R. 960/S. 326—which would enable tax-
effective for the public.
                                                               exempt finance for public-private partnerships used
    State-Level Authorizing Legislation: Currently             to develop public buildings), and providing additional
    Caltrans and regional transportation agencies do           options for addressing existing tax-exempt debt.
    not have the authority to enter into P3 contracts for
                                                               Federal-Level Flexibility and Incentives: New
    road and highway projects. (That authority expired in
                                                               federal grant programs and incentives could
    2017.) A permanent extension of P3 authority for all
                                                               encourage state and local agencies to accelerate
    transportation projects would give California’s public
                                                               needed infrastructure projects. This could take
    agencies additional flexibility for meeting the state’s
                                                               the form of the Trump Administration’s proposed
    growing transportation needs.
                                                               Infrastructure Incentives Program, which would
    State-Level CEQA Reform: CEQA plays a vital                provide grant assistance to selected projects, or
    role in protecting California’s environment. It has        another proposal in the Administration’s infrastructure
    also become an obstacle to delivering infrastructure       plan which would streamline review for projects that
    in a timely and cost-effective manner under any            do not rely significantly on federal funding.

2
Introduction
California is home to some of the nation’s most iconic
and ambitious infrastructure, from the Golden Gate
                                                                      Infrastructure
Bridge to the State Water Project. With an extensive                  Investment Status
network of highways, bridges, ports, levees, rail lines,
public buildings, and energy, water, and wastewater                   Infrastructure at both the state and local levels—in
systems, the state needs large-scale investments in its               California and across the U.S.—is in increasingly poor
infrastructure to address deferred maintenance, serve a               condition as funding levels continue to fall short of
growing population, and adapt to a changing climate.                  needs. State and local governments own over 90%
This introduction first examines the state of California’s            of the country’s non-defense public infrastructure.1
infrastructure and funding needs in the coming decades.               The federal government plays an important role in
It then discusses the role that innovative procurement and            funding infrastructure at all levels of government, but
financing strategies such as public private-partnerships              total federal capital investment has declined sharply
(P3s) can play in addressing these needs. It also considers           in the past 50 years—from 1.4% of GDP to under
the role that P3s have played historically in California and          0.7% of GDP. Failing to fill the gap, state and local
around the world, before moving to case studies of recent             spending has also declined relative to GDP over that
projects in Chapter 1.                                                same time period.2

Figure 1
  Government investment in public infrastructure has declined over the past
  50 years.
   Government Nondefense Investment in Public Fixed Assets, 1950–2016, as a Share of GDP
  4.5%

  4.0%

  3.5%
                                                                  Total
  3.0%

  2.5%
                                                                  State and Local
  2.0%

  1.5%
                                                                  Federal
  1.0%

  0.5%

      0
       1950      1955     1960        1965   1970   1975   1980      1985    1990   1995    2000      2005     2010      2015
Source: Bureau of Economic Analysis                                                     Analysis: Bay Area Council Economic Institute

                                                                                                                                   3
Public-Private Partnerships in California

Figure 2
    Using a modest benchmark of 2.5% of GDP as an investment goal,
    California’s capital spending has fallen short since 2000.
    California State and Local Capital Spending, 2000 –2015                    2.5% GDP Conservative Benchmark Goal              Actual
    $ Billions
    $70

    $60

    $50

    $40

    $30

    $20

    $10

      0
           2000    2002     2004     2005      2006     2007     2008    2009     2010       2011    2012     2013      2014     2015
           27%     20%      10%       14%      10%       8%      5%       0%       6%        14%     16%      23%       24%      28%
                                                      Percent Shortfall of Actual Spending

Source: U.S. Census, Bureau of Economic Analysis                                               Analysis: Bay Area Council Economic Institute

The result of lower spending is a broad decline in                      lack of road upkeep.5 Nearly 1,400 bridges in the state
the condition of infrastructure across the nation. The                  are structurally deficient. California’s school facilities
American Society of Civil Engineers gives America’s                     are underfunded by $6.7 billion per year.6 The state’s
infrastructure a grade of D+.3 There is a broad-based                   parks, dams, levees, public buildings, and water
need to repair aging water and wastewater systems,                      and wastewater systems all have significant unmet
replace structurally deficient dams and bridges, rebuild                funding needs. The 2018 California Infrastructure Plan
deteriorating roads, and invest in new transit, school,                 identifies $67 billion in deferred maintenance for state
water, and energy projects. These investments are                       infrastructure alone.7
critical to future growth, as infrastructure spending
has one of the highest economic multiplier effects of                   There is no single agreed-upon target for adequate
any public investment.4 These spending trends, the                      infrastructure investment. In the U.S., public capital
deteriorating condition of the nation’s capital stock,                  investment across all levels of government has averaged
and the potential for economic growth that comes with                   3% of GDP since 1950 but has declined to 2.5% of
greater investment all suggest that a higher level of                   GDP in recent years.8 Spending levels have been
investment in infrastructure is needed now.                             higher across other developed economies, averaging
                                                                        3.7% of GDP.9 Current levels of investment will come
In California, infrastructure spending patterns and                     under further pressure from the high level of deferred
the condition of infrastructure assets mirror national                  maintenance across infrastructure assets in California
trends. Nearly 50% of the state’s public roads are in                   and the future need to adapt many of those assets
poor condition, which costs each motorist $844 on                       and develop new responses to the impacts of climate
average in annual vehicle repair costs caused by the                    change. Using even the 2.5% of GDP benchmark as a

4
Introduction
Figure 3
In the next decade, California would need to spend nearly $900 billion
or 3.05% of the state’s GDP per year in order to make up the past
10 years’ shortfall.
California Infrastructure Investment Catch-Up 2.5% GDP Target Catch-Up
$ Billions
$100
$80
$60
$40
$20
0
2018 2019 2020 2021 2022 2023 2024 2025 2026 2027
Source: U.S. Census, Bureau of Economic Analysis Analysis: Bay Area Council Economic Institute
conservative investment target, Figure 2 shows how continue to deteriorate, and new assets that could spur
California’s spending since 2000 has fallen short. The economic growth and improve the quality of life for
gap averages 15% of actual spending, with a cumulative Californians will not be built.
total of $100 billion over the past 15 years.
Looking forward, if California were to make up the past
10 years’ funding shortfall in the next decade, state
and local governments would need to spend nearly Grade given to America’s
$900 billion or 3.05% of the state’s GDP per year. The
implications are clear: as capital spending is deferred, infrastructure by the
the amount of investment needed in future years American Society of Civil
continues to grow, and that investment will consume a
larger share of the economy, placing a greater burden Engineers on the 2017
on future taxpayers and ratepayers. Infrastructure Report Card
D+
This infrastructure funding gap will become
unmanageable over the long term if not addressed
now. Assuming that the state GDP and California’s
average capital spending from the past 10 years grow
at just 2% through 2050, the cumulative shortfall in
infrastructure investment will grow to more than $1
trillion. If California continues on this trajectory, critical
infrastructure at both the state and local levels will
5Public-Private Partnerships in California
Figure 4
Assuming that California’s capital spending grows at just 2% through 2050,
the cumulative shortfall in infrastructure investment will grow to more than
$1 trillion.
California Cumulative Infrastructure Spending Projected Through 2050, $ trillions
$4.0
$3.5
$3.0
$2.5
$2.0
$1.5
$1.0
Benchmark 2.5% of California GDP
$0.5
Actual Spending to 2015 / Projected Spending to 2050 at 2% of California GDP
0
2000 2005 2010 2015 2020 2025 2030 2035 2040 2045 2050
Source: U.S. Census, Bureau of Economic Analysis Analysis: Bay Area Council Economic Institute
California has recently taken steps in the right direction, resources —as well as developing innovative strategies
most notably the passage of SB 1 in April 2017, a to accelerate infrastructure investment and promote
measure that will generate $54 billion over the next improved performance and long-term resilience —
decade for transportation projects. The revenue comes remains a priority and a critical unmet challenge.
from higher taxes on gas and diesel fuels and from a
1to 3%
new transportation improvement fee paid at vehicle
registration. The bulk of the SB 1 funding will be used
by Caltrans, counties, and cities for “Fix It First” road
maintenance and rehabilitation and for new transit
projects. Hundreds of projects are already in design
or construction, thanks to this newly available funding, is the typical average for P3
many of which could not go forward in its absence. This cost or schedule overruns,
SB 1 revenue could be particularly important if a federal
infrastructure bill with state matching fund requirements compared to
15%
passes in the next year.
While SB 1 is a significant step forward, it addresses
only a small part of California’s longer-term infrastructure
needs and, notably, was the first such increase in 24
years. More funding across a much wider range of sectors
is needed. Beyond transportation, these include water,
or more for
wastewater, dams, levees, solid waste, parks, energy, traditional procurements
airports, ports, and public buildings. Investing additional
6Introduction
The Role of for many types of cost overruns which, combined with a
higher cost of capital, results in higher costs for taxpayers
Public-Private Partnerships and ratepayers. There are undoubtedly examples where
poorly-structured contracts have resulted in negative
The shortage of funding is not the only cause of outcomes for the public. Under the oft-maligned
California’s infrastructure investment gap: there is also Chicago parking meter deal, for example, the city leased
a lack of capacity in public agencies for developing its parking meter business for 75 years in exchange for a
and managing complex procurements and effectively $1.15 billion upfront payment. Rising parking rates and
maintaining infrastructure assets over their useful the frequent “true-up” payments the city has to make
lives. Many agencies have listed priority projects in to the P3 partner in the event of street closures have
their capital budgets for years or decades with little sparked widespread public opposition. These cases
progress toward their development. Far too often, the confirm that P3 is not a panacea, that careful upfront
public sector spends considerable time and resources attention is needed to ensure that the contract protects
studying projects—frequently hiring consultants that the public, and that stakeholders are engaged early and
have little experience or incentive to move projects to understand the goals and risks of the partnership.
completion—but makes little progress toward actually
building them. When major projects are built through The term public-private partnership itself is
traditional forms of project delivery, they are rarely controversial. It is different from privatization (with which
completed on time and on budget or maintained it is sometimes confused), because long-term ownership
properly following completion.10 remains in public hands. Definitions vary widely, with
the broadest applications referring to long-term
Given California’s growing infrastructure funding gap, contracts between private and governmental entities
business as usual is not sustainable. State and local for the provision of public services. Many in the industry
governments cannot afford to spend years studying believe the term should be replaced with any number
projects, absorb major cost overruns, or allow assets of alternatives, given the widely varying understandings
to deteriorate due to inadequate maintenance. of its meaning and the negative connotations that may
Performance-based approaches such as public-private accompany it in some cases. P3 is, in many ways, a
partnerships are not the only answer to these challenges, Rorschach test with entrenched opinions of its value. In
but they can help address them, particularly for large this report, the term public-private partnership (P3) is
and more complex projects. At its best, the P3 process used because it is the most widely recognized term in
incentivizes the private sector to move projects to the industry, and we consider that nomenclature issues
completion instead of spending years and millions of matter less than the important underlying concepts.
dollars on consultant studies. It also provides contractual
certainty on budgets, schedules, and long-term asset Our definition of P3 encompasses long-term,
maintenance. In a typical contract, the private partner performance-based contracts with a private partner that
gets paid only if a project reaches financial close, is involve some combination of the design, construction,
delivered on time and on budget, and is properly financing, operations, and maintenance elements of
operated and maintained for the life of the partnership. public infrastructure delivery. This is commonly referred
A number of comparative studies across sectors to as design-build-finance-operate-maintain (DBFOM),
have found minimal cost or schedule overruns for P3 although this report also includes alternate approaches
projects—typically 1–3% cost overruns on average, such as lease/leaseback, build-own-operate-transfer,
compared to 15% or more for traditional procurements.11 and other structures. These models can be alternatively
described as “performance-based infrastructure”
Like any form of procurement, poorly-structured public- or PBI. The central theme across these approaches
private partnerships can result in undesirable outcomes is performance-based contracting that accelerates
for the public and private sectors. Critics argue that P3s delivery, provides improved value for money, allocates
frequently do not provide the transfer of risk that they risk to the party best able to manage it, and assures the
promise and that the public sector remains responsible maintenance of the asset over the life of the agreement.
7Public-Private Partnerships in California
Life-cycle management is central to the P3 model. California P3 Background
Public agencies in California and across the U.S. are
In 1989, California was one of the first states to pass
notorious for their failure to adequately maintain
P3 legislation, and two of the nation’s first P3 highway
public assets once they are built. Often this occurs as
projects were built in Southern California under that
maintenance is reduced during budget downturns.
legislation.12 Few P3s were completed immediately
P3 contracts require the private partner to operate
following those first pilot projects, but a number of high-
and maintain the assets under their management
profile projects have been completed across the state
for the life of the contract (typically 30 years) and to
in the past 5–10 years. These cover both transportation
return the asset to public control in good condition.
and social infrastructure (public facilities).
Failure to perform can result in reduced payments
or in forfeiture of the contract. While the initial The state’s enabling legislation has evolved in the past
procurement cost of P3s may sometimes be higher twenty years, and building on past legislation, several
than a traditional procurement, this commitment to parts of the California code govern P3 contracting today.13
life-cycle management ensures that the asset will be
State and Regional Transportation: In 1989,
maintained to a high standard, resulting in lower costs
California’s first P3 legislation, AB 680, authorized
to the public over the life of the project. As ratings
up to four toll road demonstration projects.
agencies increasingly consider deferred maintenance a
Two projects , SR-91 in Orange County and the
liability, accounting for long-term asset management will
South Bay Expressway in San Diego County, were
become more essential.
developed under that legislation before it expired
The compensation model is a key distinction in P3 in 2003.14 Those projects were controversial,
delivery and there are two primary options: revenue particularly the South Bay Expressway which entered
risk and availability payment. Under a revenue risk P3, bankruptcy due to contractor disputes and lower
the private partner assumes the risk that the revenue than expected toll revenues, but the public was
generated by the project will be sufficient to pay back able to acquire the toll road at a lower cost after
their costs. If revenues are higher, the project will the original investors lost their money. In 2006, AB
be more profitable, but lower revenues can reduce 1467 again authorized four P3 highway projects but
profitability or even lead to bankruptcy. California’s first included a number of restrictions, and as a result no
two P3s (discussed below) were revenue risk highway projects were developed under that legislation. In
projects under which the private partners took the 2009, Governor Schwarzenegger signed SB 4, which
risk that tolls would be sufficient to pay back the costs authorized Caltrans and regional transportation
of financing and maintaining the projects. Similarly, agencies to enter into an unlimited number of
private developers take revenue risk under some of the transportation P3s. Only one project, the Presidio
student housing partnerships discussed below. Under Parkway in San Francisco, was finalized before the
an availability payment structure, the public makes authorization expired on January 1, 2017. Since
payments to the private partner as long as the project then, P3 delivery of state highway projects has not
is delivered, operated, and maintained according to been authorized in California.
the contract, while the public remains responsible for
Local Government: The California Infrastructure
collecting sufficient revenue (from user fees or other
Finance Act (California Government Code Section
government revenues) to make those payments. If the
5956) was adopted in 1996 and provides broad
private partner fails to perform to the specifications
authorization for local government agencies to
of the contract, it may incur financial penalties or risk
enter into P3s for fee-producing infrastructure
termination of the agreement. The private partners are
facilities including water, solid waste, and energy
therefore heavily incentivized to operate and maintain
utilities, airports, harbors, transportation, and transit
public assets to a high standard.
projects. The Infrastructure Finance Act requires that
selection be based on qualifications, that the facility
be operated at a fair and reasonable price, and that
8Introduction
there be a competitive negotiation process, but Australia: Australia has been a pioneer in P3
otherwise leaves agencies with broad latitude on procurement. Annual project development varies
how to conduct the procurement. significantly from year to year, with an average of
seven projects completed annually between 2004
High-Speed Rail: The California High-Speed Rail Act and 2015, primarily in social infrastructure and
of 1996 authorizes the High-Speed Rail Authority transportation.17 Under the National PPP Policy
to enter into a wide range of P3 transactions. As and Guidelines, the Australian, state, and territory
discussed below, this authority has not been utilized governments will consider P3 for any project with
to date, but it could be as high-speed rail advances. a capital cost over A$50 million.18 P3s have been
adopted most widely in New South Wales and
Courthouses: Authority for the Judicial Branch
Victoria, where they account for about 10% of total
to enter into P3s was passed in 2007.15 The Long
government infrastructure procurement.19 One
Beach Courthouse was recently completed under
review of Australian P3 procurement found that P3
this authorization.
projects experienced 1% cost overruns on average
compared to 15% for traditional projects. P3s were
Global P3 Adoption also found to be completed 3.4% ahead of time on
average while traditional projects were completed
Public-private partnerships have been implemented 23.5% behind schedule.20
more extensively internationally than in the U.S.,
particularly in the U.K., Australia, and Canada as Canada: Since they were first introduced in the
discussed below. While the origins of the model extend early 1990s, over 200 P3s have been completed
back further, the U.K. and Australia began to use P3 in Canada. The provinces of British Columbia and
delivery methods widely in the early 1990s. Canada has Ontario have been the leaders, and nearly every
developed one of the most robust P3 markets over the province has completed at least one P3 project.
past decade. There have also been active P3 markets British Columbia established Partnerships BC in
in continental Europe and South America, and it is 2002–2003 and adopted a policy (repealed in 2017)
expected that a robust market will develop in Asia in the that any project over C$50 million supported by
coming years. provincial money was required to use P3 delivery
unless there was a compelling reason not to.
U.K: The U.K. has delivered over 700 projects Partnerships BC leads procurements on the behalf of
totaling £55 billion in capital investment through P3s, public agencies in the province and has standardized
including investments in schools, hospitals, roads, contract documentation to significantly reduce
housing, prisons, and military facilities.16 P3 makes transaction costs. There has been some movement
up a small but influential part of overall infrastructure away from P3 in recent years as the national P3
procurement, and the national government has agency, PPP Canada, was shut down to be replaced
continued to study and evolve the model. The by the Canada Infrastructure Bank, an entity with
government established guiding principles in 1992 in some similar responsibilities but a larger budget and
the Private Finance Initiative (PFI) under which most mandate. In addition, Alberta declared a moratorium
P3 projects have been delivered and, after extensive on P3s in 2015. Nonetheless, Canada remains among
review, it updated those principles in 2012 with Private the most active P3 markets globally with 276 active
Finance 2 (PF2) to improve transparency, procurement P3 projects totaling C$125 billion and an additional
efficiency, flexibility, and value for money. 78 projects in the pipeline.21
9Public-Private Partnerships in California
Figure 5
The number of U.S. P3 projects in the pipeline began a dramatic rise in 2015
and by the end of 2017 had grown to more than ten times the 2006–2014
average of 19 projects.
U.S. P3 Projects in the Pipeline Pre-launch In Progress Financial Close 2006–2014 Average
# of Projects
250
200
150
100
50
0
2006 2007 2008 2009 2010 2011 2012 2013 2014 2015 2016 2017
Notes: Project counts reflect the year-end project status. This excludes projects that were classified as cancelled, on hold, moved forward without
private financing, were a stake sale, or were refinancing. The 2006 – 2014 average line represents the average number of projects that were in pre-
launch or in progress during those years.
Source and Analysis: The Brattle Group Visualization: Bay Area Council Economic Institute
P3 Adoption in the U.S.
California’s infrastructure investment deficit mirrors a This activity extends far beyond toll roads, with
national deficit, and jurisdictions across the country which P3 is often identified. Half of P3 projects in the
are trying new methods of procurement. Starting from country are now in non-transportation sectors such
a low base, the use of public-private partnerships for as social infrastructure (civic facilities), broadband,
infrastructure is growing across the U.S., across a wide water, and power. While roads account for 45% of P3
range of sectors, with projects in more than 30 states transportation projects in the U.S., other categories
plus Puerto Rico and the District of Columbia. Over 200 now include airports, rail, light-rail, tunnels, parking
public infrastructure projects are in procurement as P3s facilities, ports, and bridges. Most of these projects
(“in progress”), or have been announced by project include operation and maintenance. And while public-
sponsors as being in development or under active private partnerships are often considered best suited
consideration for P3 development (“pre-launch”). At for larger projects, the U.S. is seeing a growing number
the end of 2017, the number of P3s on the table across of smaller-scale projects.23
the country was more than ten times the 2006–2014
average of 19 projects. The total value of projects in
progress has seen parallel growth.22
10Introduction
Figure 6
Projects in the current P3 pipeline are more diversified across infrastructure
asset sectors than in the past, and transportation P3s now extend well
beyond toll roads.
U.S. P3 Projects by Infrastructure Asset Sector 2015–2017 P3 Transportation Project Types
# of Projects
Other 120 Other
Power Parking Facilities
Drinking & Storm Water 100 6% Transit
Wastewater & Solid Waste 80 8% Ports
24% 45%
Broadband/Wireless/Data Light-Rail
11%
Social Infrastructure 60 Stations
Transportation 13% Bridges & Tunnels
40
50% Rail
83% 20 Airports
Roads
0
2006–2014 2015–2017
Note: Includes projects that are pre-launch, in progress, or have reached financial close.
Source and Analysis: The Brattle Group Visualization: Bay Area Council Economic Institute
Figure 7
Projects in the fastest growing P3 category, social infrastructure, span a
range of sectors, and the growth in the number of smaller-scale P3s—
jumping from 5 before 2015 to 19 after—is also noteworthy.
Fastest Growing U.S. P3 Sector:
2015–2017 P3 Social Infrastructure Projects by Type U.S. P3 Projects by Transaction Size
3% Project Type # of Projects Transaction Size
Prisons 100 5 in $ Millions
Housing (including Student) > 5,000
10%
27% 22 1,000–5,000
Street Lighting
10% 80 500–1,000
Campus/Education
Leisure & Convention Facilities 250–500
16
20% 100–250
30% Government Buildings 60
< 100
19
40 1
12 22
20 7
5
8 19
0 5
2006–2014 2015–2017
Note: Includes projects that are pre-launch, in progress, or have reached financial close stages; 38% of pre-launch projects, 43% of progress
projects, and 98% of financial close projects report transaction size.
Source and Analysis: The Brattle Group Visualization: Bay Area Council Economic Institute
11Public-Private Partnerships in California
Figure 8
Operation and Maintenance is included in 80% or more of current U.S. P3
projects.
2015–2017 U.S. P3 Projects by Delivery Model Classification
# of Projects
0 10 20 30 40 50 60 70
Financial Close
83%
In Progress
80%
DBFOM DBFO DBFM DBF Other
Note: 68% and 90% of transactions report delivery model classification for in progress and financial close, respectively.
Source and Analysis: The Brattle Group Visualization: Bay Area Council Economic Institute
A New Challenge: Adaptation will be resilient to the impacts of climate change.
Ratings agencies are beginning to consider the credit
to Climate Change implications of climate risk, although it still remains a
As California works to repair aging assets and build new minor factor. In the longer term, investors, engineers,
infrastructure to meet the needs of a growing population, and asset managers will need to make climate risk a
public agencies are increasingly considering how climate more significant consideration. The public sector can
change will impact their assets. Given the mismatch ensure that contracts and procurements incentivize
between capital needs and available resources, the resilience in project design and can seek to partner with
public cannot afford to make investments that climate equity investors that hold their investment for the life of
change will render obsolete. Rising sea levels, more the partnership rather than selling it to third parties.
frequent and severe droughts and floods, increasing
Pioneering efforts are underway to measure and certify
heat waves, and declining snowpack, among other
resilience to climate change impacts in real estate
challenges, will have dramatic impacts on infrastructure
and infrastructure, and such assessments may help
needs and the performance of built systems.24 Several
investors and public agencies ensure the sustainability
of the projects highlighted in this report will incorporate
of long-term investments. The U.S. Green Building
climate change impacts into their designs, such as the
Council, GRESB, and Green Business Certification
SR-37 modernization north of San Francisco Bay (see
Inc., for example, provide tools to assess resilience for
discussion in Chapter 2). There is a growing recognition
infrastructure projects25 with specialized assessment
across the board that major projects will need to include
resources for energy assets26 and open spaces.27 Green
an assessment of potential climate impacts in the future.
bond certification may provide another avenue for
The private sector will also need to account for climate monitoring and verification of a project’s environmental
risks if P3 is to deliver on the promise of producing attributes, although green bond projects are often
more effective life-cycle management of major capital focused on climate mitigation rather than adaptation.
projects. In theory, P3 partners that have at risk long- These and other tools could provide a common
term capital and contracts 30+ years long should be framework for designing and building assets that will
incentivized to design and build infrastructure that withstand climate change.
12Public-Private Partnerships in California
1
California’s P3 Experience: The Past Five Years
Over the past five years, public agencies throughout Timeline: RFQ, March 2013; RFP, February 2014;
California have completed some of the nation’s Selection, December 2014; Financial close,
most innovative P3s. These include the first social November 2016; Project completion, June 2019;
infrastructure P3 in the country, the two leading U.S. Contract end, 2059.
water P3s, and the largest social infrastructure P3. Highlights: Faced with the need to upgrade unsafe
Numerous innovations within these procurements and obsolete civic buildings, the City of Long Beach
are being replicated in other transactions around the challenged the private sector to deliver and operate
country. This chapter describes the most significant new state-of-the-art facilities at an annual cost no
California P3s in recent years and highlights their greater than what the city was paying to maintain its
outcomes and key innovations. existing buildings. The city and its partner are achieving
this goal by allowing the private sector to develop
Long Beach Civic Center a revenue-generating mixed-use development on a
portion of the city-owned land. Communities around
the state are now looking to replicate this model.
Project Background: In 2007, the City of Long Beach
discovered significant seismic deficiencies in its city
hall.28 The city hall and the neighboring library were
nearly 40 years old, expensive to maintain, and no
longer served the city’s needs. It was estimated that
addressing the seismic deficiencies alone would cost
$194 million (2013 dollars) which would still leave
the city with functionally obsolete buildings. Given
Sector: Social Infrastructure budget constraints, the city needed to limit the annual
cost it would pay for the delivery, operations, and
Deal Size: $520 million
maintenance of a new complex to the amount it was
Public Agency: City of Long Beach, CA previously paying to maintain its outdated facilities, with
Concessionaire Team: Plenary Properties Long Beach adjustments only for inflation. Not knowing whether
(t/a Plenary Edgemoor Civic Partners); Equity Investor, that was possible, Long Beach hired Arup Advisory and
Plenary; Design-Build Contractor, Clark Construction; challenged the private sector to fit the project within the
O&M Provider, Johnson Controls. city’s existing $13 million annual budget (2012 dollars).
13Public-Private Partnerships in California
Procurement and Financing: Long Beach issued an allowed the public entities to share certain facilities and
RFQ in 2013 and short-listed three respondents. The reduce costs.
city issued an RFP in 2014 and selected the Plenary-
Edgemoor Civic Partners (PECP) team the same year. The new facilities are also highly innovative. With
Following selection, PECP entered into a 16-month a 40-year project timeframe, the PECP team could
exclusive negotiation period during which PECP and balance upfront capital costs with investments in
Long Beach negotiated a comprehensive agreement designs and technologies that will minimize long-
for the $520 million civic center inclusive of a new city term operating costs. This led to incorporation of a
hall, a main library, a Port of Long Beach headquarters, wide range of sustainability measures that minimize
a renovated Lincoln Park, and a mixed-use private environmental impacts and operating costs. The project
development. The partnership consists of a 5-year will reduce greenhouse gas emissions by over 50% and
construction period followed by a 40-year operations consume only 25% of the electricity used in the existing
and maintenance phase. Construction is financed with building. All of the new public buildings will be rated
$239 million in privately placed debt; $213 million LEED Gold or better.
in construction loans; $21 million in equity provided
Results: The project is currently projected to be delivered
by Plenary; and city contributions of cash and land,
on time and on budget with an expected mid-2019
underwritten by Plenary, totaling $40 million.
opening of the new city hall, library, and Port of Long
Throughout the procurement process and following Beach headquarters. The new Lincoln Park is expected
selection, there has been an extensive public outreach to be completed by the end of 2020, with an improved
campaign to engage the community in defining the design that will increase public use and access. If the
project. This has been seen as a key step to ensure project continues to perform to plan, it can be expected
public support for a project that will define the central to revitalize downtown Long Beach, spur new economic
part of the city and be used by a wide range of growth, and replace unsafe, obsolete facilities with state-
stakeholders. The city and PECP team conducted more of-the-art buildings that meet the city’s needs without
than 100 community meetings, information sessions, increasing expenditures in the city’s existing budget.
and design charrettes throughout a highly collaborative
design process.29 UC Merced
Key Innovations: The Long Beach Civic Center is
a nationally-recognized model that numerous other
communities are now considering. The city’s challenge
to the private sector to deliver, operate, and maintain
new state-of-the-art civic buildings and revitalize its
downtown without raising taxes, increasing the impact
on the general fund, or impacting its good credit rating
was a break-through innovation. Private development
will take place on the excess public land, including
parcels that result from a more efficient design and
layout of the new civic buildings. The land value
underwritten by Plenary and the revenue generated Sector: Social Infrastructure
from the resulting mixed-use development effectively
Deal Size: $1.3 billion
subsidize the public facilities delivered under the
partnership and allow the project to fit within the city’s Public Agency: University of California, Merced
budget. In addition, the city is realizing cost savings by Concessionaire Team: Plenary Properties Merced;
consolidating off-site departments and leases and by Equity Investor, Plenary (100%); Design-Build
incorporating the Port of Long Beach’s new downtown Contractor, Webcor Builders; O&M Provider,
headquarters building into the Civic Center, which has Johnson Controls.
14California’s P3 Experience: The Past Five Years
Timeline: RFQ, September 2014; RFP, January 2016; be. It received six responses and settled on a short-list
Selection, June 2016; Financial close, August 2016; of three teams. All of the initial RFP responses were
Project completion, 2018–2020; Contract end, 2055. above the budget the university had established prior to
Highlights: The Merced 2020 Project presents commencing the procurement. After receiving the bids,
a model for stakeholder engagement. From the the campus consolidated some space elements to gain
start, a vocal public champion and a dedicated efficiencies and issued a revised RFP requesting best and
multidisciplinary staff team broke down internal final offers. Plenary Properties Merced was the only team
barriers to the project, got buy-in from other staff, to submit a bid under the proposed budget, and financial
decision makers, and the community, and proactively close was reached in August 2016 with construction
addressed obstacles. The design process has commencing shortly thereafter in September.
featured in-depth collaboration between the private
The partnership has a total capital budget of $1.3
partner and stakeholders to ensure that the project
billion and will deliver the buildings in three phases
meets their needs.
beginning in fall 2018, with substantial completion of all
Project Background: The University of California, facilities by fall 2020. The concessionaire is responsible
Merced first opened for classes in 2005 with 875 for maintenance of major building systems within the
students. Over the following 10 years, the campus facilities for 35 years following completion. The project
grew to 6,800 students and 1.2 million square feet is being financed with $600 million in external university
of facilities. With a goal of becoming financially self- funding (UC system debt), $590 million in developer
sustaining and serving a population of 10,000 students, funding, and $148 million in campus funds. This blend
university leadership recognized that it needed in of public and private capital effectively shifts the risk to
a short period of time to add a wide range of new the concessionaire while minimizing the cost of capital
facilities including academic, administrative, research, by including a substantial amount of tax-exempt debt.
recreational, and residential buildings, essentially The financing and O&M will be repaid, subject to
doubling the size of the student body and the campus. building performance, through a combination of state
The Bay Area Council Economic Institute first explored general fund allocation and campus funds.
the potential for P3 delivery of the campus needs in a
2010 white paper.30 Key Challenges: The key challenge for UC Merced was
to fit its ambitious vision for the campus within a limited
Procurement and Financing: The university began by budget. This became painfully clear when all of the bids
asking campus stakeholders what they needed. As the it received from the initial RFP exceeded the upset limit.
university defined its needs and its budget, it issued But the university had a clear vision for its needs—as
an RFQ in 2014, not knowing what the response would opposed to wants—which allowed it to redefine the
UC Merced
15You can also read