Rebuilding for a Resilient Recovery - Planning in California's Wildland Urban Interface - Next 10
←
→
Page content transcription
If your browser does not render page correctly, please read the page content below
Rebuilding for a
Resilient Recovery
Planning in California’s
Wildland Urban Interface

                           JUNE 2021
PRODUCED BY

Next 10
F. Noel Perry
Colleen Kredell
Marcia E. Perry
Stephanie Leonard

PREPARED BY

UC Berkeley Center
for Community
Innovation
Karen Chapple
Rob Olshansky
Molly Harris
Clay Kerchof         NEXT 10 is an independent nonpartisan
Jessica Finkel       organization that educates, engages and
Dori Ganetsos
                     empowers Californians to improve the
Matt Gutierrez
                     state’s future.
Hanah Goldov
Laurel Mathews       Next 10 is focused on innovation and the intersection between
Ben Ulrey            the economy, the environment, and quality of life issues for
Lauren Willey        all Californians. We provide critical data to help inform the
                     state’s efforts to grow the economy and reduce greenhouse
Sadie Wilson
                     gas emissions. Next 10 was founded in 2003 by businessman
                     and philanthropist F. Noel Perry.
DESIGN BY

José Fernandez       A PROJECT OF

ONLINE AT

www.next10.org
NEXT 10                                                                                          Acknowledgements     |   III

Acknowledgements
The report authors would like to thank the following individuals and organizations for
their time and willingness to share information that helped shape this report:

Aleksandra Djurasovic                     David Guhin                               Karin Demarest
California Department of Housing &        City of Santa Rosa                        Community Foundation Sonoma
Community Development                                                               County
                                          Edith Hannigan
Alexander Ramiller                        California Board of Forestry and          Kate Gordon
UC Berkeley (Doctoral Student)            Fire Protection                           Governor’s Office of Planning and
                                                                                    Research
Allison Brooks                            Elaine Himelfarb
Bay Area Regional Collaborative           Central Ventura County Fire Safe          Kate Scowsmith
                                          Council
Amy Bach                                                                            Camp Fire Collaborative
United Policyholders                      Elizabeth O’Donoghue                      Katie Simmons
                                          The Nature Conservancy
Andrea Howard                                                                       Town of Paradise
Placeworks                                Erik de Kok                               Kelan Stoy
                                          California Governor’s Office of Plan-
Arthur Wylene                                                                       UrbanFootprint
Rural County Representatives of           ning and Research
California                                                                          Kim DuFour
                                          Erin Riches                               North Valley Community Foundation
Belén Lopez-Grady                         California State Senate Housing
North Bay Organizing Project              Committee                                 Kristi Sweeney
                                                                                    Town of Paradise
Ben Metcalf                               Jacque Chase
Terner Center for Housing                 Chico State University                    Laura Tam
Innovation                                                                          Resources Legacy Fund
                                          Jason Hercules
Cara Lacey                                UrbanFootprint                            Laurie Johnson
The Nature Conservancy
                                          Jennielynn Holmes                         California Earthquake Authority
Carmen Tubbesing                          Catholic Charities
                                                                                    Liz Koslov
UC Berkeley
(Postdoctoral Researcher)                 Jennifer Gray Thompson                    UCLA Luskin School of Public Affairs
                                          Rebuild NorthBay Foundation
Carrie Simmons                                                                      Luke Zhang
Association of Bay Area                   Jesús Guzmán                              UC Berkeley (Undergraduate Re-
Governments (ABAG)                        Generation Housing                        searcher)

Charles Brooks                            Jim Friedman                              Mark Lorenzen
                                                                                    Venture County Fire Department
Rebuild Paradise Foundation               City of Ventura

Clare Hartman                             JoAnn Scordino                            Maziar Movassaghi
                                                                                    California Department of Housing &
City of Santa Rosa                        FEMA Region IX                            Community Development
Clay Downing                              Johnny Mojica                             Megan Kurtz
Ventura County                            Earth Economics                           California State University, Chico

Chris Copeland                            Jovanni Tricerri                          Michael Germeraad
North Valley Community Foundation         North Valley Community Foundation         Association of Bay Area Govern-
                                                                                    ments (ABAG)
Dan Breedon                               Juliette Finzi Hart
Butte County                              California Governor’s Office of Plan-     Michael Gollner
                                          ning and Research                         UC Berkeley Fire Research Lab
Dan Efseaff
Town of Paradise                          Kai Luoma                                 Michelle Whitman
                                          Ventura County Local Agency For-          Renewal Enterprise District
David Edelson                             mation Commission
The Nature Conservancy                                                              Nick Branch
                                                                                    UrbanFootprint
NEXT 10                                                                                    Acknowledgements     |   IV

Nuin-Tara Key                           Renée Schomp                          Steve Lucas
California Governor’s Office of Plan-   Napa Sonoma ADU                       Butte County Local Agency Forma-
ning and Research                                                             tion Commission
                                        Rick Pruetz
Pamela Miller                           Smart Preservation                    Susan Hartman
California Association of Local                                               Town of Paradise
Agency Formation Commissions            Ryan Silber
                                        California Strategic Growth Council   Tracy Davis
Patrick Maynard                                                               Camp Fire Collaborative
Ventura County Office of Emergency      Sarah Cardona
Services                                Greenbelt Alliance                    Tracy Rhine
                                                                              Rural County Representatives of
Peter Hansen                            Sarah Newkirk                         California
California State University, Chico      The Nature Conservancy

Rex Frazier                                                                   Van Butsic
                                        Seana O’Shaughnessy                   UC Berkeley Land Use and Conser-
Personal Insurance Federation of        Community Housing Improvement
California                                                                    vation Lab
                                        Program
Rachel Schten                                                                 Victoria LaMar-Haas
                                        Seren Taylor                          California Governor’s Office of
UC Berkeley (Undergraduate Re-          Personal Insurance Federation of
searcher)                                                                     Emergency Services
                                        California
NEXT 10                                                                      Table of Contents   |    V

Table of Contents
PART I                                             PART II

Executive Summary                              1   Full Case Studies:                                31
                                                   Santa Rosa, Paradise, and Ventura
Introduction                                   5    Santa Rosa                                       32
  Background                                   7    Paradise                                         41
                                                    Ventura                                          51
Understanding Fire Impacts Across         13
California’s Diverse Landscape: The Cases
                                                   Endnotes                                          61
of Santa Rosa, Paradise, and Ventura
  Context                                     14
  Scenario Analysis                           18
  Case Study Conclusions                      21
  California’s Fiscal Exposure to Wildfires   21

Policy Recommendations for a Resilient        24
Wildland Urban Interface

Conclusion                                    30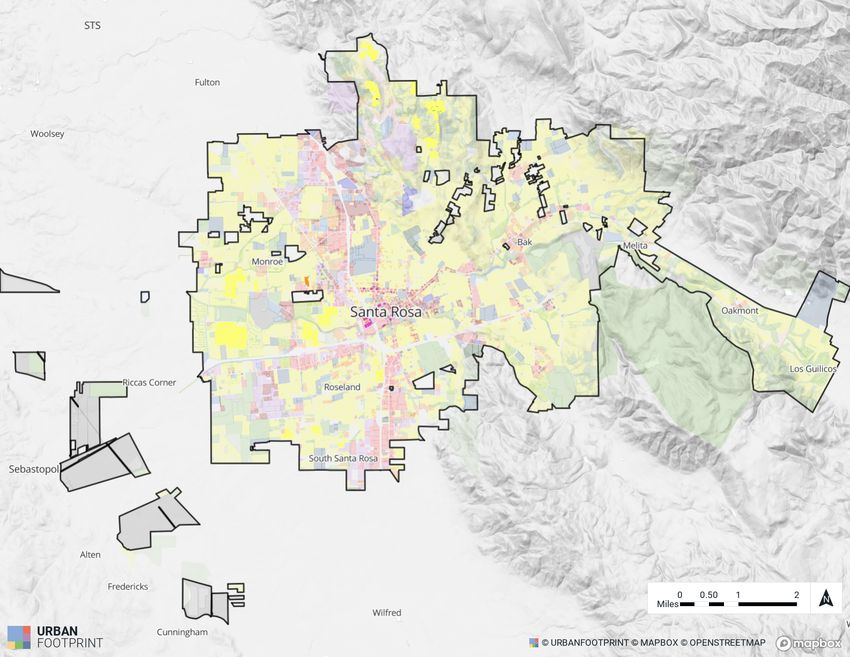
NEXT 10                                               |   1

   Executive Summary
   Climate change and sprawl in the wildland
   urban interface are driving up both the
   economic and human cost of wildfires in
   California. Successive wildfire disasters
   strengthen the case for land use conservation
   and urban infill strategies that reduce disaster
   risk, promote housing supply, and mitigate
   climate change impacts.
NEXT 10                                                                                               Executive Summary    |     2

Wildfires in California are increasing in frequency and           units (ADUs) to areas not in the WUI, and embracing
intensity. Accelerating climate change, changing land use         manufactured housing as an affordable-by-design approach.
patterns, and reduced forest management practices are             The social, economic, and environmental impacts inform
major contributing factors. In 2020, California experienced       policy recommendations.
five of the six largest wildfires in recorded history. Wildfire
proliferation threatens the lives and homes of more than          Each case study community explores three
one quarter of the state’s population; approximately 11.2         rebuilding scenarios:
million people, in 4.5 million homes, are at-risk in the            1. (Re)Building as Usual, in which existing recovery
wildland-urban interface (WUI).1,2                                     plans and historical growth trends guide anticipat-
  Rather than redirecting development away from high                   ed development patterns;
fire risk areas in the WUI, state and local policies primarily
                                                                    2. Managed Retreat & Urban Density, in which di-
emphasize retrofitting existing homes, imposing stricter
                                                                       saster survivors choose or are incentivized to move
building codes and site design standards for new homes,
                                                                       to lower risk locations, while land use planning and
and ensuring that jurisdictions have sufficient evacuation
                                                                       incentives promote infill development in existing
routes and shelter-in-place plans in case of an emergency.
                                                                       urban nodes; and
Building on prior land use research addressing infill
development, sprawl management, and land conservation,              3. Resilience Nodes, in which communities rebuild some
this report suggests that continued development in the                 housing in high-risk areas but incorporate robust
WUI will make California’s already constricted supply of               wildfire mitigation features, including development
housing more vulnerable, will undermine state efforts to               clusters surrounded by defensible space
curb carbon emissions, and will further degrade the state’s
                                                                  The analysis shows that there are more resilient paths to
wildland habitats. The growing risk of wildfires also creates
                                                                  recovery than rebuilding as usual. Communities selecting
fiscal challenges for state and local governments, given
                                                                  either Managed Retreat or Resilience Nodes will be able
the high cost of post-disaster recovery.
                                                                  to reduce fire risk for their residents, while also meeting
  To inform state policymakers, this report studies three         housing and climate goals. Managed Retreat provides
communities recently affected by fires. The research              the biggest impact in terms of safety and climate, but
combines a scenario exercise, secondary data analysis, and        presents new potential displacement risks. Resilience
interviews to understand the impacts and possible recovery        Nodes offers the most potential for economic growth,
trajectories of the Tubbs Fire (2017), Thomas Fire (2017),        with fewer negative social equity impacts, but less of
and Camp Fire (2018) on the communities of Santa Rosa,            a guarantee in terms of future fire risk. If the State of
Ventura, and Paradise, respectively. By analyzing three case      California wishes to address its dual climate and housing
study communities with different physical and socioeco-           crises, it will need to develop the right set of carrots and
nomic characteristics, the policy recommendations reconcile       sticks to persuade jurisdictions not to simply pursue the
a variety of goals, including reducing wildfire risk, increas-    greatest economic return.
ing housing supply and resilience, and mitigating climate
change, that are applicable across the state.                     Key findings from the case study analysis
  Using a scenario planning approach, this report                 include:
summarizes the impacts of different post-fire land use              • Urban growth boundaries and conservation easements
patterns on a jurisdiction’s housing supply, fire risk,               protect environmentally valuable natural and working
affordability, and climate metrics such as greenhouse gas             lands while also reducing wildfire disaster costs;
(GHG) emissions, residential energy use, and vehicle miles
                                                                    • Infill development has fewer GHG emissions, relative to
traveled (VMT). Scenarios at the city and regional level
                                                                      existing patterns of sprawl that are common throughout
explore moving homes out of the WUI, incorporating
                                                                      the WUI. In addition to higher emissions, WUI sprawl
greenbelts and wildfire buffers, increasing density in
                                                                      increases the risk of wildfires and undermines state land
existing commercial cores, adding gentle density in the
                                                                      conservation and carbon sequestration goals;
form of ‘missing middle’3 housing and accessory dwelling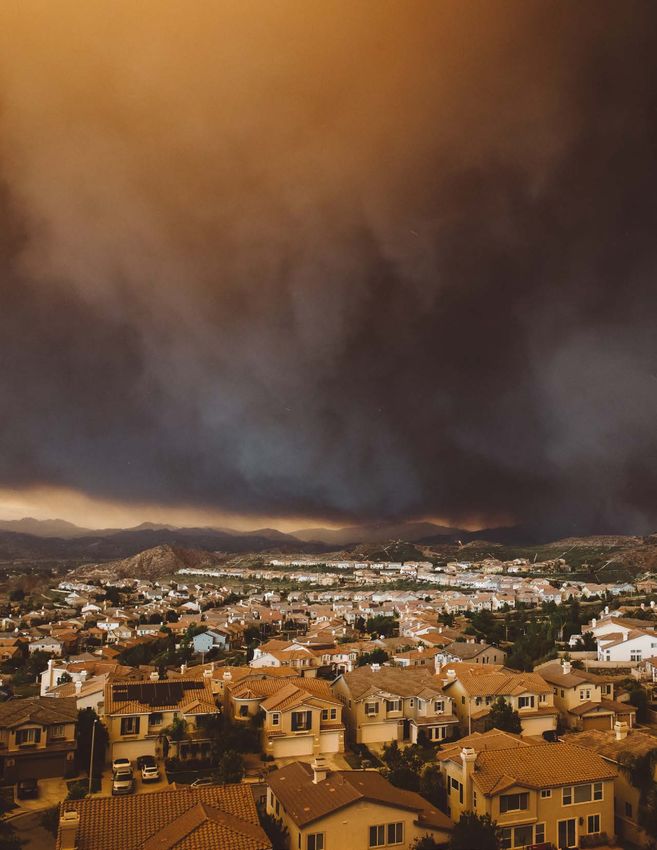
NEXT 10                                                                                                          Executive Summary     |   3

Table ES.1 Summary of Impacts by Scenario

                                    SANTA ROSA                   PARADISE (BUTTE COUNTY)                            VENTURA
                          (Re)                                   (Re)                                     (Re)
                                      Managed    Resilience                  Managed       Resilience               Managed     Resilience
 Scenario               Building-                              Building-                                Building-
                                       Retreat    Nodes                       Retreat       Nodes                    Retreat     Nodes
                        as-usual                               as-usual                                 as-usual
 Housing Impacts
 Population             179,200       167,600     173,300       236,800      236,800       237,600      108,400       97,500    122,400
 % change                              -6.5%       -3.3%                       0.0%          0.3%                     -10.1%     12.9%
 Dwelling Units
                         70,900        76,100      76,100       103,900      104,800       104,700       42,900       43,000     52,300
 (DUs)
 % MF                     18%           34%         41%          19%           20%           18%          16%            23%      32%
 % change                              7.3%         7.3%                       0.9%          0.8%                        0.2%    21.9%
 DUs in Fire Hazard
                         12,300        5,700       20,600       13,200        11,900        12,100       9,800        4,700      11,700
 Zone
 % change                              -53.7%      67.5%                      -9.8%          -8.3%                    -52.0%     19.4%
 Household Costs        $17,800       $11,300     $14,300       $26,900      $25,300       $23,800      $15,500      $13,000    $13,600
 % change                              -36.5%      -19.7%                     -5.9%         -11.5%                    -16.1%     -12.3%
 Environmental Impacts
 GHG Emissions
                        1,142,800     929,500     967,800      2,320,000    2,180,000      2,320,000    730,400      641,600    772,700
 (metric tons/year)
 % change                              -18.7%      -15.3%                     -6.0%          0.0%                     -12.2%      5.8%
 GHG Emissions
                          10.9          9.4          9.7         22.3          20.8          22.2         10.9           9.4         9.7
 (metric tons per DU)
 % change                              -13.5%      -11.0%                     -6.8%          -0.7%                    -13.5%     -11.0%
 VMT (DU/year)           23,000        14,200      18,400       33,200        31,200        33,300       11,500       9,500      10,100
 % change                              -38.3%      -20.0%                     -6.0%          0.3%                     -17.4%     -12.2%
 Change in
 Carbon Stock            -2,300        22,900      81,800       -95,400      -68,900        -79,700        0             -300     -230
 (metric tons/year)
 Economic Impacts
 One-time
                         24,500        66,700      95,900       44,600        51,000        57,300       2,100        17,200     36,600
 construction jobs
 One-time                $1.82         $4.98       $7.22         $6.61                      $8.39        $0.32        $2.72      $5.03
                                                                           $7.58 billion
 economic output         billion       billion     billion       billion                    billion      billion      billion    billion
 WUI Development                                                                                            Statewide
 Dwelling Units in High and Very High Fire Risk Areas                                                       1,456,300
 Minimum Residential Structure Replacement Cost in High and Very High Fire Risk Areas                       $610 billion
 Capacity for Additional Units in High and Very High Fire Risk Areas                                           523,000
 Annual Revenue from 0.25% Levy on Existing DUs in High and Very High Fire Risk Areas                      $1.81 billion

  • (Re)Building as Usual recovery scenarios miss an op-                    housing market, people will be displaced to more
    portunity to reduce wildfire risk, expand the supply                    distant locations; and
    of affordable housing, and reduce per household                        • Lack of integration between local and regional land
    GHG emissions;                                                          use planning, housing policy, and state wildfire man-
  • Post-disaster relocation within the region depends on                   agement undermines California’s efforts to address
    the ability of the regional housing market to absorb                    the concurrent climate and housing crises.
    disaster survivors. If the disaster is too large for the
NEXT 10                                                                                            Executive Summary     |    4

Scenario analysis findings are summarized in Table ES.1.         Key policy recommendations include:
Based on parcel-level tax assessor data compiled by
                                                                  • Identify new revenue sources and financing mecha-
Urban Footprint, as of 2020, California has 1.4 mil-
                                                                   nisms: To effectively manage California’s growing
lion homes in high or very high fire hazard severity
                                                                   wildfire risk and disaster recovery costs, policymak-
zones alone, representing a minimum of $610 billion
                                                                   ers must identify new funding streams and financing
in potential replacement costs if these homes were
                                                                   mechanisms for adaptation and resilience in the WUI.
to be impacted by wildfires. Local land use and state
                                                                   For example, by levying a 0.25 percent fee on the as-
hazard mitigation policies currently protect only a small
                                                                   sessed value of existing residential properties in high
share of these properties. In addition to existing at-risk
                                                                   and very high fire hazard severity zones, the state
homes, there are more than 555,000 underbuilt residen-
                                                                   could generate more than $1.8 billion to reinvest in
tial parcels in the WUI. If development in the WUI con-
                                                                   wildfire risk reduction planning and projects;
tinues apace, the scale of potential losses will continue
to grow rapidly.                                                  • Prevent displacement: State and local disaster hous-
                                                                   ing policies must acknowledge that wildfire disasters
  Informed by the case study analysis and statewide fiscal
                                                                   disproportionately displace and unhouse renters and
assessment, the report proposes a series of policy recom-
                                                                   low-income homeowners and therefore should proac-
mendations for implementation at the state and local
                                                                   tively plan for disparate disaster impacts and prioritize
levels. Effectively addressing the escalating risk of wildfire
                                                                   these residents in hazard mitigation and disaster
requires large-scale cooperation, coordination, and
                                                                   recovery funding;
political mobilization. Planning and policies for disaster
recovery and wildfire resilience must recognize the costs         • Incentivize lower-risk development: Limiting WUI
of WUI sprawl along with the benefits of reorienting new           sprawl while not worsening California’s housing crisis
development towards urban infill. Disaster recovery is an          requires the state to provide disincentives against
opportunity for California’s regions and communities to            risky development and incentives for infill housing af-
reduce wildfire vulnerability, support housing supply and          fordable to people of all income levels; and
resilience, and promote climate change mitigation goals.          • Improve local capacity: Institutional reinvention that
                                                                   builds capacity at regional and local levels will enable
                                                                   California and its communities to proactively and eq-
                                                                   uitably govern recovery and adaptation in the WUI.
NEXT 10                                          Introduction   |   5

   Introduction
   Wildfires are inherent to the climate of
   California, but compounding factors—
   including climate change, human
   encroachment in the wildland urban
   interface (WUI), and short-sighted forest
   management—contribute to longer and
   more intense fire seasons each year.4
   According to the California Department
   of Forestry and Fire Protection (Cal Fire),
   warmer temperatures and drier conditions
   throughout the state have increased the
   length of the fire season in the Sierra
   Nevada Mountains by 75 days, resulting
   in larger and more frequent wildfires in
   California.5 Prior to the 2020 fire season,
   15 of the 20 most destructive wildfires in
   California history occurred after 2000, and
   10 of the most destructive took place since
   2015.6 Continuing this pattern of worsening
   fire conditions, in 2020, Californians
   endured 5 of the 6 largest fires in the
   state’s history as measured by total acres
   burned.7 Furthermore, estimates show that
   California’s wildfire burn area will likely
   increase by 77 percent by the end of the
   century due to climate change.8
NEXT 10                                                                                                       Introduction     |      6

This increase in the frequency and severity of fires has          place plans.17 To be eligible for federal funds from the
serious urban planning, environmental, and economic               Hazard Mitigation Grant Program (HMGP), states must
implications for California. Under current estimates,             have approved State Hazard Mitigation Plans (SHMP),
more than one in 12 Californian homes are located                 and the local governments must have approved Local
in areas identified as having a high risk of burning in           Hazard Mitigation Plans (LHMPs).18 LHMPs vary widely in
a wildfire event.9 Notably, the State of California last          quality, and many smaller jurisdictions struggle to turn
updated its fire risk maps in 2007. Consequently, these           their LHMPs into projects or even compete for the com-
maps underrepresent the true extent of wildfire risk in           petitive HMGP funds. In 2008, California strengthened
the state.10                                                      building code standards for all new residential construc-
  Another way to assess fire risk to human-made structures        tion built in high fire risk areas, and Assembly Bill 2140
is to consider whether those properties are located in the        (2006)19 and Senate Bill 1241 (2012)20 mandates that
WUI.11 Although the literature contains many definitions of       jurisdictions address wildfire risks in their General Plans.
the WUI—thus making it difficult to map and measure—              State and local governments, however, have been slow
the California Governor’s Office of Planning and Research         to embrace some of the more politically challenging
(OPR) defines it as any developed area located adjacent           approaches to hazard mitigation and disaster resilience
to wildland areas, resulting in those human-made build-           and recovery. In 2020, the Governor of California vetoed
ings and structures having a high susceptibility to damage        SB 182, which aimed to restrict how much housing local
by wildfires. The WUI boundaries typically account for
               12                                                 jurisdictions could permit in very high fire-hazard severity
housing density, vegetation in the area, and the amount of        zones (VHFHSZs).21
buffer between housing and nearby vegetation.13 Low-den-            By deploying creative policies and financing for land
sity areas with high amounts of vegetation located close          use and rebuilding, the state and local governments can
to homes are particularly dangerous for the local residents       legislate and implement cross-sector policies that break
and structures. Human presence in wildland areas is a ma-         down siloes and achieve multiple state policy goals
jor cause of fires, accounting for approximately 85 percent       of fire safety, housing, and environment. Based on an
of all wildfires. In the event of a fire, firefighters struggle
                    14
                                                                  in-depth analysis of three communities impacted by wild-
to protect these areas, and limited road networks—often           fires—Santa Rosa in Sonoma County (Tubbs Fire, 2017),
a staple of low-density development found in the WUI—             Paradise in Butte County (Camp Fire, 2018), and the City
makes it particularly challenging for residents to evacuate.      of Ventura in Ventura County (Thomas Fire, 2017)—this
  The insurance impacts of continued development in               report recommends a mix of state, regional, and local-
high-risk areas of the WUI threaten to impose high costs          level policies and strategies for promoting and funding
on homeowners and destabilize the insurance industry.             programs that would reduce wildfire vulnerability, sup-
From 1964 to 1990, the insurance industry paid out an             port housing supply resilience, and mitigate the impacts
average of $100 million per year in fire insurance claims         of climate change. This analysis summarizes the pre-di-
in California. From 2011 to 2018, that figure increased           saster characteristics of each community, outlines wildfire
to $4 billion per year. The 2018 Camp Fire and 2017               disaster impacts, analyzes disaster recovery efforts, and
Tubbs Fire alone resulted in $9 billion and $12 billion in        explores the economic, environmental, and land use
insurance claims, respectively.   15
                                       Despite improvements       implications of various rebuilding scenarios. By studying
in fire science and wildfire risk modeling, the outdated          communities with distinct demographic, geographic,
state fire maps and regulations that limit insurance rate         and land use contexts, conclusions can be translated
increases undervalues the economic risk of development            into scalable and flexible state-level policies that support
in the WUI.    16                                                 state, regional, and local wildfire resilience.
  Rather than redirecting development away from the                 This report finds that California’s housing shortage and
WUI, state and local legislation largely focuses on retro-        urban land use regulations encourage development sprawl
fitting existing homes to be more fire resistant, impos-          into the WUI, which intensifies wildfire risk. This, in turn, ex-
ing stricter building code and site design standards for          acerbates regional housing shortages. Planning and policies
newly-constructed homes, and supporting jurisdictions             for disaster recovery and wildfire resilience must recognize
to create emergency evacuation routes and shelter-in-             the environmental, social, and fiscal costs of sprawl in the
NEXT 10 Introduction | 7
WUI and the affiliated benefits of prioritizing urban infill management efforts on 500,000 acres of forest land per
development. The analysis suggests the need for targeted year through the Shared Stewardship Agreement (2020)
land use interventions that allow for lower risk development has bolstered these efforts—a critical partnership given
patterns, greater enforcement of resilient building codes that the federal government owns 58 percent of Califor-
and structural hardening, and limitations on new develop- nia’s forestland.24 Thus far, the state has not taken bolder
ment in high wildfire risk areas. Not only would this altered steps such as curbing development in the WUI.
approach to land use planning reduce wildfire risk, it would Hazard mitigation planning: Beyond forest management
also promote insurance affordability, provide needed hous- as a strategy for reducing vulnerability in the WUI, the
ing in safer and more accessible locations, reduce carbon state enacted strict building codes for homes built after
emissions, and provide long-term fiscal benefits. 2008 within Cal Fire-defined VHFHSZs,25 which include
The State should embrace policies like transfers of using specific building materials to “harden” homes
development rights (TDR), conservation easements, and to stray embers and creating defensible space around
homeowner buyouts. Additionally, planners, policymakers, buildings.26 The responsibility falls on homeowners to
emergency managers, and insurers alike need compre- pay for these hardening efforts, placing a higher cost
hensive and standardized wildfire risk and disaster data burden on low-income families. Further mitigation plan-
to develop informed and coordinated policy solutions for ning falls onto local governments in the form of LHMPs,
these interconnected challenges. Importantly, any future Community Wildfire Protection Plans (CWPPs), and vari-
policies also must consider potential impacts on vulnerable ous elements of the general plan—and is largely driven
communities and adopt strategies to mitigate the risk of by financial incentives at the state and federal levels.
displacement or other harm. A series of state bills encourage municipalities to also
This report begins by summarizing the existing policies at incorporate wildfire mitigation and risk reduction for high-
all levels of government that address fire risk and disaster risk zones into their general plans. AB 2140 (2006) incentiv-
recovery, as well as the existing literature on these top- izes municipalities to incorporate LHMPs into the Safety
ics. After outlining the research methodology, the report Element by tying them to eligibility for state funding for
then summarizes findings from the case study analysis. post-disaster projects through the California Disaster
The conclusion of Part I presents recommendations for Assistance Act.27 AB 1241 (2012) goes a step further to
state policymakers to achieve the complementary goals of explicitly require wildfire mitigation policies and programs
reducing risk in the WUI, addressing the growing housing in the Safety Element for cities and counties within an SRA
crisis, and mitigating climate change. Part II consists of (State Responsibility Area) or VHFHSZ.28 SB 379 (2015)
the full case studies. requires local governments to assess local vulnerability
to climate change and adopt adaptation and resilience
goals, policies, and implementation measures as part of
Background
the Safety Element and/or LHMP.29 SB 1035 (2018) added
GOAL 1: a regular review and update for flood, wildfire, and climate
Reduce Vulnerability in the Wildland Urban Interface adaptation components of the Safety Element every
California’s wildfire strategy prioritizes fire suppression eight years.30 OPR’s Integrated Climate Adaptation and
and fuel management over comprehensive land use plan- Resiliency Program provides further guidance suggesting
ning to limit development in the WUI. A historical trend hazard mitigation planning and climate change adaptation.
of fire suppression has left the state’s forests “unnaturally AB 1823 (2019) requires the State Board of Forestry and
dense,” and therefore increasingly vulnerable to fire Fire Protection to develop criteria for and maintain a list of
in the face of a warmer, drier climate. More recently,
22 “Fire Risk Reduction Communities” located within the SRA
the state has taken steps to reduce hazardous fuel sur- and VHFHSZs.31 These criteria include the local mitigation
rounding communities in the WUI, largely through forest planning efforts described above as well as participation
thinning and prescribed burns. The state’s mitigation in Fire Adapted Communities and Firewise USA programs.
strategies are informed by the California Strategic Fire Finally, SB 99 (2019)32 and AB 747 (2019)33 mandate the
Plan (2018) and the California Vegetation Treatment Pro- addition of evacuation routes and their conditions in the
gram and a recent federal commitment to match fuel
23 LHMP and Safety Elements.NEXT 10 Introduction | 8
Hazard mitigation funding: Despite the cost-effectiveness Pre-disaster planning: Prior to 2000, most disaster
of hazard mitigation, the state spends several times more planning occurred following a catastrophic event, with
on wildfire suppression and disaster recovery costs per a focus on emergency response operations and facilita-
year than on hazard mitigation for wildfire risks. Each
34
tion of relief funding. The Federal Disaster Mitigation
federal dollar spent on wildfire mitigation in the WUI saves Act (2000), however, spurred pre-disaster mitigation
$3 in avoided disaster recovery costs, while each dollar planning by making Federal Emergency Management
spent on improving building safety above baseline code Agency (FEMA) funding contingent on communities hav-
requirements saves $4 in avoided recovery costs. In 35
ing a LHMP in place.41 By both requiring local mitigation
2020, California spent $3 billion on wildfire suppression, planning and also providing mitigation grants, the fed-
including $1.3 billion in supplemental emergency funds, eral government facilitates local actions that can reduce
during a fiscal cycle when the COVID-19 pandemic di- the consequences of future disasters. Communities must
minished spending on mitigation programs. 36
revise and renew their LHMPs at least every five years to
Federal funding for hazard mitigation is generally avail- remain eligible.
able after disasters, and state hazard mitigation funding Planning for recovery after a disaster poses many
is not adequate or stable. Beginning in 2011, most of challenges. In the wake of trauma, community residents
the state’s wildfire mitigation funding came from a flat have a strong desire to rebuild as they were before,
$153 per parcel State Responsibility Area Fire Prevention but this limits opportunities for reducing future risk.42
Fee (SRAFPF) on homes in high and very high-risk areas. Time compression compounds the difficulties of plan-
However, the state rescinded this fee in 2017. Beginning ning for long-term recovery in the wake of a disaster, as
in 2017, the Greenhouse Gas Reduction Fund (GGRF), local governments must move quickly and concurrently
funded through the state’s cap-and-trade auction, has through processes that would usually take years.43 There-
provided most of the state’s wildfire mitigation funds. 37
fore, pre-disaster recovery planning not only improves
In April 2021, Governor Newsom and the Legislature the speed and quality of decision making following a
agreed to a $536 million down payment on wildfire sup- disaster, leading to a faster recovery—it also better posi-
pression and mitigation measures. A full $350 million
38 tions communities to receive federal and state funding
of this deal would go towards suppression and fuels as it becomes available.44
management efforts, and only $25 million will go towards Although these regulations have prompted more local
hardening older homes that were built before the stricter governments to do pre-disaster mitigation planning, para-
WUI building code was introduced in 2008.39 This fund- doxically, most project funding, including FEMA Hazard
ing represents the largest yet state investment in wildfire Mitigation Grants, flows after a disaster due to increased
prevention and mitigation, but it is only a fraction of the attention to the issue. Despite the increase in hazard miti-
investment needed to get California’s wildfire risks under gation planning, LHMPs remain largely procedure-oriented,
control. Recent research on the cost of reducing Califor- with a focus on emergency operations and less emphasis
nia’s wildfire risk makes a conservative estimate that the on land use controls.45 Similarly, CWPPs tend to focus on
cost of reducing California’s wildfire risk would cost $3 fuel management in surrounding forest lands, rather than
billion per year for 10 years—or $30 billion over 10 years, on land use controls. Academic research and federal and
although it could cost even more. This investment would state officials generally advocate that localities incorporate
include $1 billion to harden 100,000 homes per year; $500 hazard and disaster planning throughout each element of
million to create community fuel breaks in 10 percent of the general plan—beyond simply the Safety Element—to
at-risk communities per year; $1 billion to for prescribed foster community resilience, which can reduce the damages
burns and fuels management on 1 million acres per year; and associated costs following a disaster.46
and $500 million per year to coordinate the implementa-
tion of these wildfire risk management actions.40NEXT 10 Introduction | 9
tion tactics may increase the safety of these homes
RoIe of Land Use Planning
and people. The latest community-scale risk reduction
Despite the known risk to properties located within the
measures for new development comprise four design
WUI, local governments continue to underutilize land
categories: landscape setting, separation from wildfire
use planning to reduce development in fire-prone areas.
source, density management, and infrastructure.52 These
Following a fire, many municipalities opt to “adapt in
considerations may require significant capital investment
place” instead of attempting to move people out of
and inter-governmental cooperation and governance.
high fire risk areas, pointing to the statewide hous-
For example, at the county level, Local Agency Forma-
ing shortage and lack of public support for any sort
tion Commissions could work more closely with fire
of climate migration strategy.47 Recent research noted
specialists to prevent sprawl in high-risk areas.53 Such
negative public sentiment towards regulation and land use
recommendations underscore the growing need for
planning in general as a major impediment to the use of
science-informed land use planning and urban design.
land controls in wildfire mitigation.48
There is also evidence that multi-scale community
City staff in communities affected by wildfire often dis-
partnerships can effectively reduce wildfire risk. For
agree about the efficacy of land use planning for wildfire
example, the Montecito Fire Protection District has es-
mitigation. Some communities with dispersed develop-
tablished lines of defense between Montecito residents
ment and large, single family lots believe that individual
and the Los Padres National Forest through fuel thin-
fuel management is sufficient. Planning for wildfire
ning, code enforcement, defensible space surveys, and
mitigation also presents a challenge of scale, as planning
community outreach.54 The effectiveness of this strategy
across jurisdictional boundaries requires coordination
was proven in the Thomas Fire of 2017, during which
between regional and state governance bodies. Some
minimal damage was sustained. Yet without external as-
jurisdictions are concerned that land use restrictions will
sistance, many communities would struggle to replicate
impede real estate development and place their fiscal
Montecito’s model, as they lack the resources to hire
security at risk.49
their own ‘wildland fire specialists.’55
However, local governments systematically underes-
The premise of establishing greenbelts as wildfire
timate their fiscal exposure to growing wildfire risks.
buffers has received greater consideration in recent
After disasters, municipal finances may be bolstered by
years as a means of reducing risk to homes in the WUI
insurance payouts; federal and state recovery funding;
or a VHFHSZ. Greenbelts are a nature-based solution
increased property assessments and tax revenues made
that may take the form of managed natural space or
possible by increased assessments that were kept artifi-
highly-manicured and irrigated parks, agricultural land,
cially low by Proposition 13; and by increased sales tax
or sports fields and golf courses. This strategy rests
revenue spending associated with rebuilding. Despite
on the assumption that the higher water content and
this, the overall local fiscal impact of wildfires is decid-
reduced fuel loads of these buffers would impede flame
edly and meaningfully negative. Wildfire disasters often
fronts and ember ignition.56,57 In addition to potentially
result in municipal bond rating downgrades that make
preventing structural ignition, greenbelts offer a number
local borrowing more expensive.50 Growing wildfire risks
of co-benefits, such as recreational greenspace, emer-
not only make municipal budgets more vulnerable—they
gency gathering points, staging areas for firefighters,
also make insurance more expensive, often prohibitively
and—depending on the type of greenbelt—ecosystem
so. Local governments need to consider both costs when
restoration.58
making land use decisions in high wildfire risk areas.
The state’s housing shortage places significant devel- Overcoming tensions between affordability and risk in
opment pressure on both prime agricultural land and the insurance market
high wildfire risk areas. At the current rate of growth and Government actors aren’t alone in attempting to reduce
under current growth patterns, an additional 645,000 risk and vulnerability in the WUI. Facing increasing
housing units will be developed in VHFHSZs by 2050.51 losses and stringent state regulation of rates, insurance
For communities that insist on continued development companies are dropping the highest-risk policyholders
in the WUI, community- or neighborhood-scale mitiga- from the more affordable ‘admitted market.’ ExistingNEXT 10 Introduction | 10
state policies complicate these business decisions for affirms that residents have reduced their risk. Insurance
the industry. Proposition 103, which California vot- companies often advise these organizations and accept
ers approved in 1988 to protect consumers from price their certifications in exchange for coverage.
shocks in insurance markets, requires insurers to charge In 2020, a new law and voter proposition created two
rates pre-approved by the Department of Insurance for new incentives that can support post-disaster reloca-
most policies on the admitted market.59 Regulations also tion. AB 3012 (2020) allows policyholders to use their
limit insurers to using historical damage data to deter- insurance payout to buy a different home of equal or
mine risk estimates even though updated catastrophe lesser value, without deducting the value of land at the
models can provide more realistic risk determinations new location.66 Proposition 19 (2020) allows homeown-
that reflect climate change’s impacts on the frequency ers, including wildfire victims, who relocate to transfer
and intensity of wildfires. their prior property tax base, so long as their new home
Insurers paid out approximately $26 billion to home- is of equal or lesser value.67 These together create new
owners in California following the 2017 and 2018 fire pathways for disaster survivors to move out of high-risk
seasons alone. Escalating losses, coupled with regu- areas, though they do not disincentivize rebuilding in
latory price controls, create a fiscally unsustainable high-risk areas.
business environment for insurers and drive many to
terminate policies on the admitted market.60 This results GOAL 2:
in increased enrollment in the Fair Access to Insurance Incentivize Infill Housing Supply and at All Income Levels
Requirements (FAIR) Plan, the ‘insurer of last resort,’ A single wildfire can abruptly erase years of housing
which provides barebones coverage at rates that can supply.68 Lost housing supply can cause housing market
be several times higher than the admitted market.61 In shocks, increasing home values and rents for households
response, the Department of Insurance enacted and ex- struggling to recover from disaster. Without adequate
tended a moratorium on policy termination by insurance oversight, some landlords and contractors can engage
companies, preventing policyholders in or near areas in price gouging, disproportionately harming low-in-
that experienced a wildfire in the past year from losing come and vulnerable households.69
coverage. This short-term fix has stemmed policyholder Even in the absence of wildfires, California struggles to
movement into the FAIR Plan and allowed policymakers build housing quickly enough to shelter its growing popu-
more time to develop solutions that can address interre- lation. As of 2019, 97 percent of California cities did not
lated hazard mitigation, land use, and insurance market issue enough permits to meet their residential construc-
challenges.62 An unsuccessful bill AB 2167 (2020) would tion targets.70,71 Construction costs per square foot—al-
have allowed insurers to use catastrophe modeling to ready high in California—increased by 25 percent over the
inform insurance risk and rates, essentially allowing them last decade.72 New housing developments can take years
to request greater rate increases in some of the highest to break ground because of environmental review, state
risk counties than are currently allowed on the admitted permitting requirements, local requirements like design
market.63 review, and resistance from neighbors.73 While develop-
In recent years, some insurance companies have intro- ment stagnates, housing prices skyrocket and low-income
duced limited innovations in the insurance model in an people pay the price. As of 2019, 51 percent of renters
attempt to continue providing coverage to homeown- in California paid more than 30 percent of their income in
ers in high fire risk areas. Some insurers make coverage rent, and 26 percent of renters paid more than 50 percent
conditional on homeowners in fire-prone areas imple- of their income in rent.74
menting mitigation tactics. In Boulder, Colorado for
64
Subsidized WUI housing units in California are dispropor-
example, homeowners can work with Wildfire Partners, tionately rural. Socio-economic factors like income, educa-
a county-operated organization, to create defensible tion, and immigration status, and housing factors like tenure
space around their homes to meet insurance require- and quality make the residents of the 140,000 subsidized
ments.65 Other communities participate in the Firewise units in the WUI particularly vulnerable. Residents of manu-
Communities certification program, a designation over- factured housing communities (MHCs) on aggregate have
seen by the National Fire Protection Association that incomes 50 percent lower than single family homeowners.75NEXT 10 Introduction | 11
Wildfires and displacement: When homes burn, people Wildfire recovery and infill housing: One commonly
are displaced. In the latter months of 2018, an estimated proposed solution to add housing and reduce long-term
350,000 California residents were forced to flee, over- wildfire risk is to increase density and cluster devel-
whelming shelters across the state. In addition to the initial
76
opment. Although structure-to-structure ignition in
displacement during the “sheltering” period immediately clustered neighborhoods is possible, compact develop-
after a disaster, long-term displacement can occur when ment facilitates shared defensive space and requires
survivors move away rather than rebuild. Though displace- fewer firefighting teams during emergencies.85 Because
ment impacts vary by individual experience, relocation due of this, studies show that structures are more likely
to a disaster is on average associated with more psycho- to burn in low-density areas and within the WUI.86,87,88
logical distress than returning.77 Post-disaster displacement Structural fire-hardening is especially important in dense
separates victims from core social networks that are critical communities at risk of wildfire or post-seismic conflagra-
for recovery.
78
tion to reduce home-to-home spread.89 One way to add
Disparate impacts of disasters: Although wildfires can more housing without significantly changing the urban
be traumatic for everyone affected, renters and low- form of a neighborhood completely is to build “missing
income households face increased challenges in access- middle” housing, or multi-unit buildings like duplexes
ing permanent housing afterward. A recent report on and four-plexes that are not significantly larger than a
the impacts of climate change on displacement identi- single, large house. Manufactured housing communities
fies “stark inequities in the post-fire recovery process, (MHCs) may also offer opportunities for denser housing
with renters and low-income individuals facing the typologies that are affordable to lower-income house-
biggest barriers for rebuilding and returning home.” 79 holds, but MHCs face political, regulatory, and funding
Many renters do not have renters insurance and those barriers to rebuilding post-disaster. Increasing density
who do are frequently ineligible for the natural disaster in existing suburban areas and repurposing underuti-
relocation assistance provided to insured homeowners. 80 lized retail space can potentially alleviate California’s
Insufficient recovery assistance, coupled with a severe housing shortage and direct development to lower-risk
affordable housing shortage, results in increased rates areas,90 all while fostering economic growth.
of homelessness in disaster-affected regions.81,82
GOAL 3:
Communities of color, immigrants, and non-English
Reduce Greenhouse Gas Emissions & Preserve Open Space
speakers especially face challenges in recovering from
California has led the nation in reducing GHG emissions
wildfires. Though affluent, white people are the popula-
thanks to legislation passed in the early 2000s. AB 32
tion most likely to live in fire-prone areas in the United
(2006)91 mandated that California’s GHG emissions return
States, people of color are far more likely to lack the
to 1990 levels by 2020, which was achieved four years
resources necessary to recover from a fire.83 Linguistic
ahead of schedule in 2016. It also empowered the Cali-
isolation compounds vulnerability for immigrant and un-
fornia Air Resources Board (CARB) to lead state agencies
documented populations. The challenges these groups
in cutting emissions across all sectors of the economy
encounter include—but are not limited to—working
and laid the groundwork for subsequent climate action.
outdoors in hazardous conditions without masks, a lack
Despite instituting a cap-and-trade program and a range
of multilingual emergency response information, and, for
of energy efficiency regulations, the state’s population
undocumented people, exclusion from FEMA aid. In the
and economy has grown steadily. In 2018, California’s per
absence of governmental support, non-governmental
capita tons of CO2-equivalent was 10.7, far below the na-
organizations have at times been the primary safety net
tional average of 19.9.92 While the state has seen tremen-
for these individuals. Some advocate for more inclu-
dous success in decarbonizing its energy sector, reducing
sive, culturally appropriate community engagement but
emissions from other sectors of the economy—especially
also note that inadequate healthcare, wages, working
buildings and transportation—may prove a more difficult
conditions, housing, and transportation all increase the
feat. In order to continue meeting its climate targets, and
wildfire vulnerability of disadvantaged populations. 84
thereby curbing wildfire frequency and severity, California
will need to aggressively curtail sprawling suburban devel-
opment and preserve natural and working lands (NWL).NEXT 10 Introduction | 12
Infill development and reduced GHGs: Low-density CARB data suggests that existing NWL may now emit
suburbs have considerably higher household carbon foot- more carbon than they sequester due to California’s
prints than dense urban cores, largely due to more vehicle catastrophic wildfires, which released GHG emissions
miles traveled (VMT) and higher home energy use. Infill
93
equivalent to 68 million metric tons of carbon dioxide-
development can significantly reduce these emissions equivalent gases (MMTCO2e)in 2018 alone.100,101 To put
per capita. Given that nearly 40 percent of California’s this in context, in 2016 California’s electricity generation
emissions result from transportation, creating compact emitted 76 MMTCO2e.
communities that are more walkable, bikeable, and con- Consequently, preserving NWL is an increasingly
nected to public transit could have dramatic impacts.94 significant component of California’s climate strategy.
One predictive analysis suggests that constructing nearly For instance, SB 1386 (2016) instructs state agencies to
two million infill dwelling units (DU) in California by 2030, consider the carbon sequestration implications of decisions
as opposed to single-family sprawl, could reduce annual affecting NWL, so as not to undermine the State’s GHG
GHG emissions by at least 1.79 million metric tons.95 reduction goals.102 In addition, California’s 2017 Climate
Nevertheless, simply densifying urban cores may not Change Scoping Plan proposed a target of both seques-
adequately reduce overall emissions, because neighbor- tering and averting a minimum of 15 MMTCO2e by 2030
ing suburbs with high household carbon footprints may through conserving and restoring NWL.103 This prompted
negate these benefits. 96
several state agencies to co-develop the California 2030
Preserved lands and carbon sequestration: Preserv- Natural and Working Lands Climate Change Implemen-
ing California’s carbon sinks is another crucial climate tation Plan (January 2019 Draft), which calls for a 50-75
mitigation measure. In 2014, CARB estimated that NWL percent reduction in the annual rate of land conversion by
stored 5.5 billion metric tons of carbon within their 2030.104 State funding significantly backs up these bur-
biomass and soils. Maintaining, if not expanding, their
97
geoning NWL efforts; as of 2019, $800 million of California
storage capacity would be highly consequential. Marvin Climate Investment funds were directed towards climate
et al. (2018) developed predictive scenarios to compare mitigation strategies in NWL.105 Using these resources, the
potential land management interventions in California Implementation Plan compels state agencies to improve
and found that conserving these lands would provide the conservation incentives and assist regional and local actors
greatest GHG reductions by 2100. Unfortunately, cur-
98
in their infill initiatives.106 Establishing greenbelts is a prom-
rent trends point in the opposite direction; as low-density ising resilience strategy at the local level. While the most
sprawl continues to spread throughout California, roughly direct impact of these buffers would be wildfire protection,
50,000 acres of farms and rangelands are lost annually.99 they could also increase carbon sequestration.NEXT 10 Fire Impacts | 13 Understanding Fire Impacts Across California’s Diverse Landscape: The Cases of Santa Rosa, Paradise, and Ventura California’s WUI encompasses a diversity of communities, from urban to suburban to rural, and housing types, from working- class subdivisions to luxury vacation homes. Wildfires have not just impacted communities in the very high fire hazard severity zones, but also reached into the middle of urban neighborhoods. They burn both remote affordable hamlets in the forest, and exclusive new suburban communities housing mega-commuters. In this section, scenario analysis is used to explore the climate, housing, and economic impacts of rebuilding after fire in three different types of communities. The case studies featured—the Tubbs Fire in Santa Rosa, the Camp Fire in Paradise, and the Thomas Fire in Ventura—explore alternative land use patterns that would achieve the three stated goals—reduce risk in the WUI, increase housing supply and resilience, and mitigate climate change. The findings are summarized in the following chapter, while Part II: Full Case Studies presents the case studies in greater detail.
NEXT 10                                                                                                         Fire Impacts   |   14

Table 1 Characteristics of Case Study Communities

                           %
                                                      %                       % WUI                          %
                       Non-White Median
                                                 Homeowners                   (mod.,       Fire     Fire Remaining Pace of
            Population Population Home                      Density
                                                  (2018 ACS                  high, and    History Damage in County Recovery
                       (2018 ACS Value
                                                     5 yr)                   very high)                   by 2019
                          5 yr)
 Santa                                                                                                6,692
             181,038        45%       $490,000         54%        Suburban      44%       Extensive            96%        Rapid
 Rosa                                                                                                 homes

                                                                                                      14,000
 Paradise     26,543        14%       $218,400         70%         Rural        71%       Extensive            73%        Slow
                                                                                                      homes

                                                                                           Mostly      530
 Ventura     110,234        45%       $661,000         54%        Suburban      36%                            99%       Medium
                                                                                           Recent     homes

Stakeholder interviews informed the scenario develop-                Context
ment process (for more on methodology, see Appendix                  Although recent wildfires have devastated each of the
A). The research team interviewed more than 65 diverse               three case study communities, they differ in geographic
stakeholders, including community stakeholders, local                and socio-economic context, as well as pace of recovery
and regional government officials, state government                  (Table 1). Located mostly in the WUI, Paradise, the least
officials, and experts in fire science, hazard mitigation,           affluent and most rural of the three, has struggled to re-
disaster recovery, insurance, fire response, and commu-              build, despite significant state and federal recovery fund-
nity resilience.                                                     ing. In contrast, in the affluent suburban coastal commu-
  To describe community demographics and explore house-              nity of Ventura, which has just over one-third of its land in
hold mobility post-fire, this report draws from the American         the WUI, the majority of homeowners have chosen not to
Community Survey (2014-2018 Five-Year Estimates) and                 rebuild. Santa Rosa, a slightly higher density, middle-class
Data Axle, a consumer research firm that combines real               suburban community almost half in the WUI, is rebuilding
estate records, tax assessments, voter registration, utilities,      rapidly in place with significant government assistance.
bills, and other sources to create geospatial panel datas-           The following describes the fire disaster and recovery
ets. The scenario analysis used UrbanFootprint, a scenario           process for each community in more details.
planning and analysis software, and IMPLAN, an economic
impact modelling software. Part II provides the full case
study methods and findings.
NEXT 10 FIRE IMPACTS | 15
Figure 1 Land Use, Cal Fire’s Fire Hazard Severity Zones and Tubbs and Nuns Fire Boundaries
in Santa Rosa
Bak Melita
Monroe SANTA
ROSA
SANTA ROSA
Oakmont
Los Guilicos
Roseland
South 0 .50 1 2
Miles
Santa Rosa
LAND USE LAND USE CALFIRE FHSZ
Mixed Use Office Open Space Moderate
Single Family Civic / Education Agriculture High
Multifamily Transportation / Utilities Natural Severe
Retail / Commercial Parks / Recreation Fire Footprint
City Boundary
Santa Rosa placed residents (96%) remained in Sonoma or adjacent
The largest city in California’s wine country, Santa Rosa Napa County one year later, indicating an inclination to
has experienced destructive wildfires for hundreds of stay nearby.
years due in part to the hot, dry Diablo winds in spring The City of Santa Rosa worked hard to rebuild, adopt-
and fall. Cal Fire’s Fire Hazard Severity Zones (FHSZs) ing an urgency ordinance to expedite the process and
cross into the City of Santa Rosa from the west, north waive regulations for those trying to rebuild. Officials
and east (Figure 1). The 2017 Tubbs fire killed 22 people quickly launched a permit center exclusively for fire survi-
and destroyed 2,834 homes across not just the eastern vors’ rebuilding efforts in and amended its Downtown
neighborhoods with very high fire hazard, but also low- Station Area Specific Plan in an attempt to draw devel-
risk central areas. The fire displaced both homeowners opment into downtown Santa Rosa. Despite the city’s
and renters, and movers were particularly likely to have efforts, rebuilding activity has concentrated in the WUI,
children or be short-term renters. Yet, most of the dis- rather than in infill locations.NEXT 10 FIRE IMPACTS | 16
Figure 2 Land Use, Camp Fire Footprint, and Cal Fire’s Fire Hazard Severity Zones in Butte County
and Paradise
CONCOW
PARADISE
CHICO
WILLOWS
OROVILLE
0 3 5 10
Miles
LAND USE CALFIRE FHSZ
Mixed Use Office Open Space Moderate
Single Family Civic / Education Agriculture High
Multifamily Transportation / Utilities Natural Severe
Retail / Commercial Parks / Recreation Fire Footprint
City Boundary
Paradise transmissions lines owned and operated by Pacific Gas
Located in Butte County, approximately 15 miles east and Electricity (PG&E) sparked the fire. One year after
of Chico, Paradise is a small, rural town with a large the Camp Fire, only about 73 percent of wildfire-affect-
population of retirees and commuters attracted by its ed households were still living in Butte County.
affordable housing stock, despite its repeated wild- To guide their rebuilding and recovery efforts, the
fires in recent decades (Figure 2). The 2018 Camp Fire Town of Paradise adopted the Long-Term Recovery Plan
burned more than 150,000 acres over the course of two in June 2019.112 However, very little rebuilding has yet
weeks, destroying nearly 19,000 structures and killing occurred, due to the lack of sufficient wildfire insurance
85 people.107,108 Nearly 85 percent of those who per- and delays in receiving FEMA, HUD, and PG&E fund-
ished were over the age of 60, 109
and the huge amounts ing. With major infrastructure repairs needed, as well as
of debris, tree damage, and water infrastructure dam- thousands of hazardous trees at risk of falling, Paradise
age left the town with up to $18 billion in damages. 110,111
still faces daunting obstacles to recovery.
Investigators later determined that outdated electricalYou can also read