The Future of Cooling - Opportunities for energy-efficient air conditioning - Secure - International Energy Agency
←
→
Page content transcription
If your browser does not render page correctly, please read the page content below

Secure
                                 Sustainable
                                        Together

The Future of Cooling
Opportunities for energy-
efficient air conditioning
The Future of Cooling
Opportunities for energy-
efficient air conditioning

INTERNATIONAL ENERGY AGENCY
    The International Energy Agency (IEA), an autonomous agency, was established in November 1974.
   Its primary mandate was – and is – two-fold: to promote energy security amongst its member
  countries through collective response to physical disruptions in oil supply, and provide authoritative
 research and analysis on ways to ensure reliable, affordable and clean energy for its 29 member
countries and beyond. The IEA carries out a comprehensive programme of energy co-operation among
its member countries, each of which is obliged to hold oil stocks equivalent to 90 days of its net imports.
The Agency’s aims include the following objectives:
n Secure member countries’ access to reliable and ample supplies of all forms of energy; in particular,
through maintaining effective emergency response capabilities in case of oil supply disruptions.
 n Promote sustainable energy policies that spur economic growth and environmental protection
 in a global context – particularly in terms of reducing greenhouse-gas emissions that contribute
  to climate change.
    n Improve transparency of international markets through collection and analysis of
     energy data.
        n Support global collaboration on energy technology to secure future energy supplies
         and mitigate their environmental impact, including through improved energy
            efficiency and development and deployment of low-carbon technologies.
                n Find solutions to global energy challenges through engagement and
                   dialogue with non-member countries, industry, international
                       organisations and other stakeholders.
                                                                                                 IEA member countries:
                                                                                         Australia
                                                                                  Austria
                                                                            Belgium
                                                                       Canada
                                                                   Czech Republic
                                                                Denmark
                                                             Estonia
                                                          Finland
                                                       France
                                                     Germany
                                                    Greece                                Secure
                                                  Hungary
                                                                                                  Sustainable
                                                                                                            Together
                                                Ireland
                                              Italy
                                             Japan
                                            Korea
                                            Luxembourg
                                           Netherlands
                                           New Zealand
                                           Norway
                                           Poland
                                            Portugal
                                             Slovak Republic
          © OECD/IEA, 2018                    Spain
  International Energy Agency                  Sweden
          Website: www.iea.org                   Switzerland
                                                  Turkey
                                                    United Kingdom
          Please note that this publication           United States
            is subject to specific restrictions
            that limit its use and distribution.    The European Commission
                   The terms and conditions are       also participates in
            available online at www.iea.org/t&c/         the work of the IEA.
© OECD/IEA 2018                                                                   The Future of Cooling
                                                                                 Opportunities for energy-efficient air conditioning

                   Foreword
                   The world faces a looming “cold crunch.” Using air conditioners and electric fans to stay cool
                   accounts for nearly 20% of the total electricity used in buildings around the world today. And this
                   trend is set to grow as the world’s economic and demographic growth becomes more focused in
                   hotter countries. As incomes and standards of living increase, more people will naturally want to Page | 3
                   buy and use air conditioners to keep cool. Wider access to cooling is necessary, bringing benefits
                   to human development, health, well-being and economic productivity. But it will have a
                   significant impact on countries’ overall energy demand, putting pressure on electricity grids and
                   driving up local and global emissions.
                   The International Energy Agency (IEA) is shining a spotlight on some of the blind spots of energy
                   policy – issues that get little attention but are of crucial importance. The growth in global
                   demand for space cooling is such a blind spot: it is one of the most critical yet often overlooked
                   energy issues of our time. If left unchecked, energy demand from air conditioners will more than
                   triple by 2050, equal to China’s electricity demand today. This report highlights the threats
                   associated with rising, unchecked cooling demand. It provides key insights into current and future
                   trends in cooling, and it proposes policy responses to achieve a more sustainable pathway.
                   The answer lies first and foremost in improving the efficiency of air conditioners, which can
                   quickly slow down the growth in cooling-related electricity demand. Indeed, the opportunity for
                   efficient cooling lies in the market’s current inefficiencies: there are huge disparities in the
                   efficiencies of air conditioners sold today across the globe. Policy interventions can address this
                   and will have a significant and rapid global impact.
                   Measures such as strong minimum energy performance standards are well known and well
                   proven to drive up equipment efficiencies quickly and cost-effectively. In the longer term, the
                   underlying need for cooling can also be greatly reduced by better building design and tougher
                   building codes, as well as by increased rates of energy efficiency improvements in existing
                   buildings.
                   This is particularly important today, given the slowdown we’ve seen in global energy efficiency
                   improvements. Simply put, governments need to do more on efficiency, which is one of the key
                   tools to reach long-term climate goals and also reduce energy-related air pollution. As part of the
                   modernisation of the IEA, we have greatly expanded our work on energy efficiency, helping
                   governments all over the world to understand efficiency issues and to identify and implement the
                   right policy solutions.
                   Determined policy action is critical to ensure a sustainable path to the future of cooling and allow
                   people to reap the benefits of cooling without straining energy systems or the environment. This
                   is why the IEA is choosing this moment to present this report.
                   I hope that this report will help to raise awareness globally about one of the most critical energy
                   issues of our time and that it will provide an important source of guidance for policy makers in
                   particular who are working towards a more sustainable global energy system.

                   Dr. Fatih Birol
                   Executive Director
                   International Energy Agency
© OECD/IEA, 2018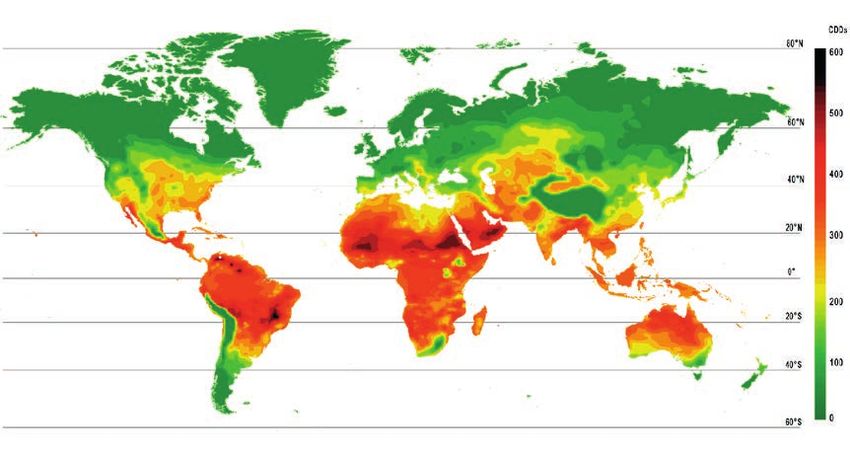
© OECD/IEA, 2018
© OECD/IEA 2018                                                                  The Future of Cooling
                                                                                Opportunities for energy-efficient air conditioning

                   Acknowledgements
                   This report was prepared by the Directorate of Sustainability, Technology and Outlooks (STO) and
                   the Directorate of Energy Markets and Security (EMS) under the direction of Brian Motherway,
                   Head of Energy Efficiency at the International Energy Agency (IEA). The report was written by
                   Brian Dean, John Dulac, Trevor Morgan (Menecon Consulting) and Uwe Remme. Thibault Page | 5
                   Abergel, Matteo Craglia, Craig Hart, Zoé Hungerford and Peerapat Vithayasrichareon also
                   contributed to the research and analysis.
                   The report benefited from valuable inputs and comments from other experts within the IEA,
                   including Simon Bennett, Stéphanie Bouckaert, Olivia Chen, Laura Cozzi, Paolo Frankl, Peter
                   Fraser, Rebecca Gaghen, Timothy Goodson, Tim Gould, Timur Guel, Enrique Gutierrez Tavarez,
                   Shan Hu, Kevin Lane, Ana Lepure, Armin Mayer, Claire Morel, Simon Mueller, Bruce Murphy,
                   Claudia Pavarini, Cedric Philibert, Roberta Quadrelli, Céline Rouquette, Keisuke Sadamori, Mel
                   Slade, Cecilia Tam, David Turk, Laszlo Varro, Talya Vatman, Brent Wanner and Matthew
                   Wittenstein. Thanks also go to Bertrand Sadin, Astrid Dumond and Therese Walsh of the IEA
                   Communication and Information Office for their help in producing the report.
                   Several experts from outside the IEA provided input, commented on the underlying analytical
                   work and reviewed the report. Their contributions were of great value. Those people include:
                   Turki Al Aqeel (King Abdullah Petroleum Studies and Research Center [KAPSARC]), Inés Aria
                   (Euroheat & Power), Monica Axell (Research Institute of Sweden [RISE] and the IEA Technology
                   Collaboration Programme [TCP] on Heat Pumping Technologies [HPT]), Marion Bakker
                   (Netherlands Enterprise Agency), Shikha Bhasin (Council on Energy, Environment and Water
                   [CEEW]), Van D. Baxter (Oak Ridge National Laboratory), Johan Berg (RISE and IEA HPT TCP),
                   Patrick Blake (United Nations [UN] Environment), Teun Bokhoven (Consolair and IEA TCP on
                   Energy Conservation through Energy Storage), Jeferson Borghetti Soares (Empresa de Pesquisa
                   Energética, Brasil [EPE]), João Castanheira (Engie Climaespaço), Vaibhav Chaturvedi (CEEW),
                   Sylvain Cote (KAPSARC), Didier Coulomb (International Institute of Refrigeration [IIR]), Odón de
                   Buen (Comisión Nacional para el Uso Eficiente de la Energía de México [CONUEE]), Antonio Di
                   Cecca (Engie), Alison Dell (Australian Department of the Environment and Energy), Santiago
                   Creuheras Díaz (Mexico Ministry of Energy), Lesley Dowling (Australian Department of the
                   Environment and Energy), Jean-Luc Dupont (IIR), Gabrielle Dreyfus (Institute for Governance &
                   Sustainable Development), Ricardo Enríquez Miranda (Centro de Investigaciones Energéticas,
                   Medioambientales y Tecnológicas and IEA TCP on Solar Heating and Cooling [SHC]), Kostadin
                   Fikiin (Technical University of Sofia, Bulgaria), Thomas Fleckl (Austrian Institute of Technology),
                   Torben Funder-Kristensen (Danfoss), Gavin David James Garper (Birmingham University Energy
                   Institute), Arunabha Ghosh (CEEW), Siyue Guo (Tsinghua University Building Energy Research
                   Center [BERC]), Caroline Haglund Stignor (RISE and IEA HPT TCP), Hermann Halozan (Wissen
                   Technik Leidenschaft Institut für Wärmetechnik, Austria), Stanford Harrison (Australian
                   Department of the Environment and Energy), Dan Hazma-Goodacre (ClimateWorks Foundation),
                   Adam Hinge (Sustainable Energy Partnerships), Roger Hitchin (Building and energy consultant and
                   IEA HPT TCP), Brian Holuj (UN Environment), Andrej Jentsch (IEA TCP on District Heating and
                   Cooling [DHC]), Yi Jiang (BERC), Sandeep Kachhawa (Alliance for an Energy Efficient Economy
                   [AEEE]), Vinod Kesavan (Marafeq Qatar), Kazuma Koyama (Daikin Industries), Satish Kumar
                   (AEEE), David Morgado (Asian Infrastructure Investment Bank), Daniel Mugnier (Tecsol and IEA
                   SHC TCP), Saki Nakagawa (Daikin Industries), Thomas Nowak (European Heat Pump Association),
                   Julia Panzer (Danfoss), Thiago Antonio Pastorelli Rodrigues (EPE), Toby Peters (Birmingham
                   University), Ming Yang Qian (BERC), Stephan Renz (Swiss Federal Office of Energy and IEA HPT
                   TCP), David Rochford (Australian Department of the Environment and Energy), Sneha Sachar
                   (AEEE), Helge Schramm (Danfoss), Rajendra Shende (Technology, Education, Research and
© OECD/IEA, 2018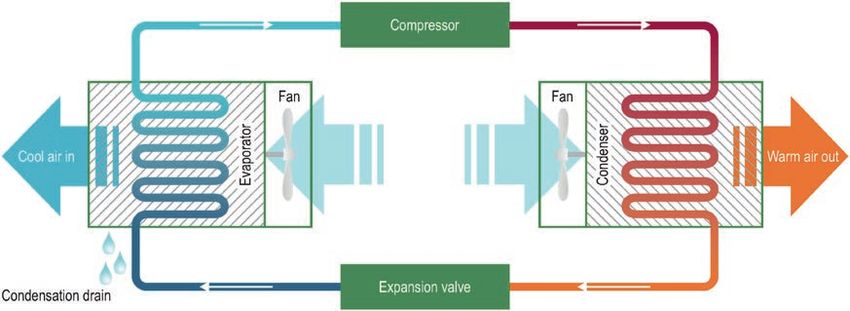
The Future of Cooling                                                                © OECD/IEA 2018
                        Opportunities for energy-efficient air conditioning

                        Rehabilitation for the Environment Policy Center), Faraz Sojdei (Iranian Ministry of Petroleum),
                        Santosh Thakur (Energy Efficiency Services Limited, India), Frank Tillenkamp (Zurich University of
                        Applied Sciences), Ingo Wagner (Euroheat & Power), Baolong Wang (BERC), Robin Wiltshire
                        (Building Research Establishment and IEA DHC TCP), and Da Yan (BERC).

             Page | 6
© OECD/IEA, 2018
© OECD/IEA 2018 The Future of Cooling
Opportunities for energy-efficient air conditioning
Table of Contents
Executive summary ............................................................................................................... 11
1.The role of cooling in the energy system............................................................................. 15
Keeping cool ............................................................................................................................ 15 Page | 7
Air-conditioning technologies .......................................................................................... 15
Household fans ................................................................................................................ 22
Dedicated dehumidification systems............................................................................... 23
Energy use for space cooling ................................................................................................... 23
Historical trends ............................................................................................................... 23
Regional trends ................................................................................................................ 24
Implications for the electricity system .................................................................................... 26
Impact on the environment..................................................................................................... 29
2. Drivers of energy use for cooling ........................................................................................ 33
Climate ..................................................................................................................................... 33
Economic growth and affordability ......................................................................................... 37
Demographic factors ............................................................................................................... 40
Population growth ........................................................................................................... 40
Urbanisation .................................................................................................................... 40
Ageing and illness ............................................................................................................ 42
Energy efficiency of cooling equipment .................................................................................. 42
Energy performance of buildings ............................................................................................ 47
Building design ................................................................................................................. 47
Building envelopes ........................................................................................................... 48
Demand-side management ..................................................................................................... 49
Impact of demand response on cooling demand ............................................................ 50
Other cooling solutions ........................................................................................................... 52
District cooling ................................................................................................................. 52
Solar cooling..................................................................................................................... 53
3. The outlook for cooling ...................................................................................................... 57
Methodology ........................................................................................................................... 57
Modelling approach ......................................................................................................... 57
The scenarios ................................................................................................................... 58
Baseline Scenario trends ......................................................................................................... 59
Ownership and energy efficiency of space-cooling equipment ...................................... 59
Energy use for space cooling ........................................................................................... 61
Implications for electricity systems ................................................................................. 63
Space cooling-related CO2 emissions............................................................................... 65
Efficient Cooling Scenario trends............................................................................................. 66
Energy savings from rapid energy efficiency gains .......................................................... 66
© OECD/IEA, 2018
Electricity system benefits ............................................................................................... 69The Future of Cooling © OECD/IEA 2018
Opportunities for energy-efficient air conditioning
Emission reductions ......................................................................................................... 72
4. Policy action to curb cooling-related energy ....................................................................... 75
The need for a holistic approach to cooling policy.................................................................. 75
Integrating cooling into policies on sustainable buildings ............................................... 75
Page | 8 Policy support for local energy communities .................................................................. 76
Policy measures focused on cooling........................................................................................ 77
Boosting the energy efficiency of cooling equipment ..................................................... 77
Improving the energy performance of buildings ............................................................. 78
Improving cooling technology through research and development ............................... 81
Measuring progress in cooling efficiency policies ........................................................... 82
Recommendations................................................................................................................... 83
List of figures
Figure 1.1 • How a standard vapour compression refrigeration cycle AC works ........................ 16
Figure 1.2 • Common types of standard ACs ............................................................................... 17
Figure 1.3 • Worldwide stock and capacity of ACs by sector ...................................................... 20
Figure 1.4 • Aggregate AC cooling output capacity and sales by country/region, 2016 ............. 20
Figure 1.5 • Sales of residential ACs by country/region, 2016 .................................................... 21
Figure 1.6 • Stock of ACs by country/region and type, end 2016 ............................................... 21
Figure 1.7 • Stock of chillers by country/region .......................................................................... 22
Figure 1.8 • World energy consumption for space cooling in buildings ...................................... 23
Figure 1.9 • Final energy use for space cooling in buildings by fuel and country/region, 2016 . 25
Figure 1.10 • Final energy consumption for space cooling by fuel and country/region ............... 25
Figure 1.11 • Share of cooling in increased electricity demand by country/region, 1990-2016... 26
Figure 1.12 • Share of cooling in peak load and total electricity demand by
country/region, 2016 ............................................................................................... 27
Figure 1.13 • Average daily electricity load profiles for winter and summer in California, 2017 . 28
Figure 1.14 • Illustrative daily profile of space cooling load and solar PV electricity generation . 29
Figure 1.15 • World CO2 emissions associated with space cooling energy use by source ............ 31
Figure 1.16 • Energy-related CO2 emissions from space cooling by source and country/region
in 2016...................................................................................................................... 31
Figure 2.1 • Per-capita income and rate of household ownership of air conditioners ............... 38
Figure 2.2 • Illustration of the heat island effect......................................................................... 41
Figure 2.3 • SEERs of available residential ACs in selected countries/regions, 2018 .................. 44
Figure 2.4 • EERs of available residential ACs in selected countries/regions, 2018 .................... 44
Figure 2.5 • Energy efficiency of available commercial ACs, 2018 .............................................. 45
Figure 2.6 • Illustrative example of demand management and the annual load duration curve 50
Figure 2.7 • Impact of demand response on the daily load curve............................................... 51
Figure 3.1 • Household ownership of cooling equipment by type in the Baseline Scenario ...... 59
Figure 3.2 • Residential AC cooling capacity in the Baseline Scenario by country/region .......... 60
Figure 3.3 • Commercial AC cooling capacity in the Baseline Scenario by country/region ........ 60
Figure 3.4 • Weighted average world SEER of ACs in the Baseline Scenario .............................. 61
Figure 3.5 • World energy use for space cooling by subsector in the Baseline Scenario ............ 61
Figure 3.6 • Energy use for space cooling by country/region in the Baseline Scenario .............. 62
Figure 3.7 • The role of drivers of energy demand for space cooling in the Baseline Scenario .. 62
© OECD/IEA, 2018© OECD/IEA 2018 The Future of Cooling
Opportunities for energy-efficient air conditioning
Figure 3.8 • Building electricity demand by end-use application in the Baseline Scenario ........ 63
Figure 3.9 • Share of space cooling in total electricity demand and in the growth in
electricity demand by country/region in the Baseline Scenario .............................. 63
Figure 3.10 • Share of space cooling in peak electricity load by country/region in the
Baseline Scenario ..................................................................................................... 64
Figure 3.11 • Power generation capacity required for cooling by country/region in the Page | 9
Baseline Scenario ..................................................................................................... 64
Figure 3.12 • Power generation capacity additions to meet the growth in space-cooling
demand in the Baseline Scenario by country/region and fuel, 2016-50 ................. 65
Figure 3.13 • Electricity demand from space cooling and resulting CO2 emissions in the
Baseline Scenario ..................................................................................................... 65
Figure 3.14 • Share of space cooling in total CO2 emissions of the energy sector by
country/region in the Baseline Scenario ................................................................. 66
Figure 3.15 • Average global SEER of ACs by scenario .................................................................. 67
Figure 3.16 • World electricity consumption for space cooling in the Baseline and Efficient
Cooling Scenarios and energy savings in 2050 by country/region .......................... 68
Figure 3.17 • Contribution to world energy savings from energy-efficient ACs and additional
potential energy demand reductions beyond the Efficient Cooling Scenario ......... 68
Figure 3.18 • Difference in power generation capacity needs for space cooling in 2050
between the Baseline and the Efficient Cooling Scenario ....................................... 69
Figure 3.19 • Annual electricity costs per capita to meet space cooling needs by scenario ......... 70
Figure 3.20 • Illustrative analysis of the potential role of storage using solar PV for district
cooling over two days in April 2050 during the peak cooling period in India.......... 71
Figure 3.21 • Contribution to the global reduction in CO2 emissions from space cooling by
country/region in the Efficient Cooling Scenario ..................................................... 72
Figure 3.22 • Reductions in air pollutant emissions linked to space cooling by
type of pollutant ...................................................................................................... 73
Figure 4.1 • EPPI and share of global energy use by end use ...................................................... 82
List of tables
Table 1.1 • Air-conditioning units and cooling capacity by country/region, 2016 ..................... 19
Table 1.2 • World final energy consumption for space cooling in buildings by
country/region ......................................................................................................... 24
Table 2.1 • Outlook for CDDs by country/region in the Baseline Scenario ................................ 37
Table 2.2 • Assumed average annual rates of growth in real GDP by country/region .............. 39
Table 2.3 • Demographic assumptions by country/region......................................................... 40
Table 3.1 • Key power system parameters for a scenario without and with thermal storage .. 71
List of boxes
Box 1.1 • Main types of ACs in use today ................................................................................ 18
Box 1.2 • Meeting electricity peak load................................................................................... 27
Box 1.3 • Air-conditioning refrigerants and climate change ................................................... 30
Box 2.1 • CDDs and the heat index .......................................................................................... 35
Box 2.2 • Measuring the energy efficiency of ACs................................................................... 43
Box 2.3 • The Edge building in Amsterdam: An example of smart space-cooling technology 47
Box 2.4 • Cool roofs ................................................................................................................. 49
Box 2.5 • Demand response, digitalization and cooling .......................................................... 51
© OECD/IEA, 2018The Future of Cooling © OECD/IEA 2018
Opportunities for energy-efficient air conditioning
Box 2.6 • District cooling in Paris, France ................................................................................ 53
Box 3.1 • Systems integration of renewables and thermal storage on peak cooling in India. 70
Box 4.1 • Policies to encourage digitalization of cooling and other building technologies .... 76
Box 4.2 • IEA Technology Collaboration Programmes with research projects on cooling ...... 81
Box 4.3 • The IEA EPPI ............................................................................................................. 82
Page | 10
List of maps
Map 2.1 • CDDs across the world, mean annual average 2007-17 .......................................... 34
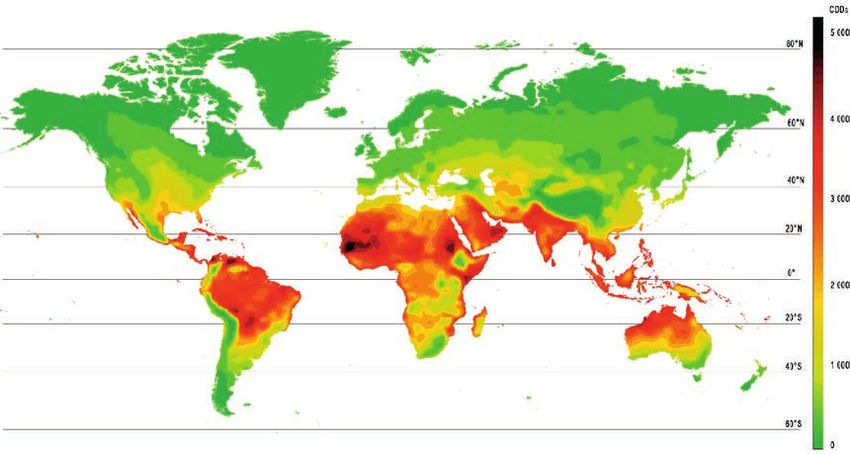
Map 2.2 • Increase in CDDs in the Baseline Scenario relative to historical CDDs, 2016-50 ..... 36
Map 2.3 • Map of MEPS and labelling for air conditioners ...................................................... 46
Map 4.1 • Map of building energy codes by country, state and province, 2017...................... 79
© OECD/IEA, 2018© OECD/IEA 2018 The Future of Cooling
Opportunities for energy-efficient air conditioning
Executive summary
The world is facing a looming “cold crunch”
The use of energy for space cooling is growing faster than for any other end use in buildings,
more than tripling between 1990 and 2016. Space cooling – typically by means of an electric- Page | 11
powered fan or air conditioning (AC) system – is contributing increasingly to global energy
demand. Global sales of ACs have been growing steadily and significantly: since 1990, annual
sales of ACs more than tripled to 135 million units. There are now about 1.6 billion in use, with
over half in just two countries – the People’s Republic of China (hereafter “China”) and the
United States. Those ACs vary enormously in energy efficiency, and keeping them running
consumes over 2 000 terawatt hours (TWh) of electricity every year, which is two and a half times
the total electricity use of Africa. Almost a fifth of all the electricity used in buildings is for
cooling.
Rising demand for space cooling is already putting enormous strain on electricity systems in
many countries, as well as driving up emissions. Increased AC loads push up not only overall
power needs, but also the need for generation and distribution capacity to meet demand at peak
times, placing further stress on the power system. In some countries, such as in the Middle East
and also parts of the United States, space cooling can represent more than 70% of peak
residential electrical demand on extremely hot days. Averaged across all countries, space cooling
accounted for around 14% of peak demand in 2016. Building, maintaining and operating
electricity capacity to meet that peak demand is very expensive because it is used only for limited
periods, and this drives up overall costs. Meanwhile, carbon dioxide (CO2) emissions from cooling
have tripled since 1990 to 1 130 million tonnes (Mt), equivalent to the total emissions of Japan.
Local air pollutants caused by cooling energy demand have similarly grown.
Growing demand for cooling is driven by economic and population growth in the hottest parts
of the world. Global growth is shifting south, to countries that experience high temperatures that
drive the demand for cooling, which is becoming affordable for more people as income levels
rise. The lion’s share of the projected growth in energy use for space cooling by 2050 comes from
the emerging economies, with just three countries – India, China and Indonesia – contributing
half of global cooling energy demand growth. And the efficiency of ACs varies widely - in all major
markets today, people are typically buying air conditioners whose average efficiencies are less
than half of what is available.
Absent firm policy interventions, cooling-related energy demand will soar
There is no doubt that global demand for space cooling and the energy needed to provide it
will continue to grow for decades to come. Access to cooling is a major social issue. Of the
2.8 billion people living in the hottest parts of the world, only 8% currently possess ACs,
compared to 90% ownership in the United States and Japan. But just how fast cooling-related
energy demand grows hinges critically on government policy action. The analysis presented in
this report shows that policies currently in place or planned would have only a very limited effect
in slowing that growth.
In our Baseline Scenario, which takes account of the likely effect of current policies and targets,
energy needs for space cooling will triple by 2050. Soaring AC ownership drives overall
electricity demand to unprecedented levels. Global energy use for space cooling in 2050 reaches
6 200 TWh, with nearly 70% of the increase coming from the residential sector, and much of it
taking place in a handful of emerging economies. The share of space cooling in total electricity
use in buildings grows to 30%. Cooling becomes the strongest driver of growth in buildings
© OECD/IEA, 2018
electricity demand, responsible for 40% of the total growth, and the second strongest driver of allThe Future of Cooling © OECD/IEA 2018
Opportunities for energy-efficient air conditioning
electricity growth, after industrial motors. In absolute terms, this means cooling growth would
require adding the equivalent of all electricity demand today in the United States and Germany.
Meeting peak electricity demand becomes a major challenge in the Baseline Scenario. The
challenge of meeting cooling demand growth in an affordable and sustainable manner is
exacerbated by its particular effect on peak demand. The share of space cooling in peak electricity
Page | 12 load is projected to rise sharply in many countries, with the biggest increases occurring in hot
countries such as India, where the share jumps from just 10% today to 45% in 2050. Of course,
increased supply of renewable power will be essential for meeting this demand, with one-third of
the cooling-related generating capacity additions in the Baseline Scenario coming from solar
power alone. But this is not sufficient, as the daily pattern of solar power supply does not always
match that of cooling demand, with high cooling demand in many countries lasting well after the
sun has gone down. As a result, electricity systems in the Baseline Scenario will have to install
and maintain large amounts of expensive peak power generation capacity.
Policies to improve the efficiency of air conditioners could quickly curb
demand
There is an opportunity to quickly influence the growth of cooling related energy demand
through policies to improve efficiency. This report presents an Efficient Cooling Scenario that
describes an energy pathway based on much stronger policy action to limit energy needs for
space cooling, and is compatible with the ambitious goals to limit climate change that were
agreed in the Paris Agreement in 2015. There are many actions that can be taken, but this report
focuses on one area where policy action can deliver substantial energy savings quickly – making
AC equipment much more efficient. Through more stringent minimum energy performance
standards (MEPS) and other measures such as labelling, the average energy efficiency of the
stock of ACs worldwide could more than double between now and 2050.
Globally, the use of energy for space cooling in the Efficient Cooling Scenario grows by less than
half as much as in the Baseline Scenario. Cooling-related energy demand climbs to 3 400 TWh in
2050 – 45% lower than the level in the Baseline Scenario. The savings are equivalent to all the
electricity consumed by the European Union in 2016. This global AC energy efficiency drive could
take effect immediately, given the relatively short lifetimes of ACs compared with buildings or
power sector infrastructure. By contrast, less stringent MEPS in the Baseline Scenario effectively
lock in inefficient products.
More efficient air conditioners would bring major benefits
The Efficient Cooling Scenario greatly reduces the need to build new generation capacity to
meet peak demand. Worldwide, the need for additional capacity up to 2050 just to meet the
demand from ACs is 1 300 gigawatts (GW) lower in the Efficient Cooling Scenario, the equivalent
of all the coal-fired power generation capacity in China and India today. In most countries and
regions, the avoided capacity needs are in the form of coal and natural gas.
Less need for capacity also translates into lower investment, fuel and operating costs.
Worldwide, the cumulative savings in the Efficient Cooling Scenario amount to USD 2.9 trillion
(United States dollar) over 2017-50 compared with the Baseline Scenario. This translates into
lower electricity costs for all. Globally, the average cost per person of supplying electricity to end
users for air conditioning is around 45% lower than in the Baseline Scenario.
© OECD/IEA, 2018© OECD/IEA 2018 The Future of Cooling
Opportunities for energy-efficient air conditioning
Measures to make ACs more energy efficient, coupled with decarbonisation of power
generation, lead to a huge reduction in cooling-related CO2 emissions. By 2050, those emissions
drop to just 150 million tonnes in the Efficient Cooling Scenario – a mere 7% of those in the
Baseline Scenario and 13% of their 2016 level. Half of the savings come directly from the
improved efficiency of ACs. Similarly, emissions of key air pollutants drop by up to 85%, with
again more than half the effect directly due to the more efficient ACs. Page | 13
Policies to improve the energy performance of buildings would bring
additional long-term energy savings
Measures to improve the energy performance of building envelopes would contribute to even
bigger energy savings in the longer term. The way buildings are designed and built, including the
choice of materials used in their construction, can have a huge impact on the need for ACs and the
subsequent energy needed to provide cooling services. Policies for more efficient ACs, combined
with policies for more efficient buildings, could actually keep energy demand for cooling flat, while
allowing strong growth in access to cooling for populations around the world. This would require
much tougher building energy codes, which need to be well-thought-out, coordinated with
renewable energy policies, and properly enforced.
A concerted policy push to rein in cooling energy demand is needed
urgently
Rigorous action by governments is needed urgently to curb the rapid growth in demand for air
conditioning and achieve the outcomes described in the Efficient Cooling Scenario. In order to
bring about a lasting reduction in the energy demand for cooling, Governments need to enable
and encourage investments and – where necessary – mandate the required improvements in
ACs, as well as buildings. Such action works: efficiency standards for ACs and building energy
codes have been in place in many countries for many years, and have delivered large, cost-
effective energy savings. Experience shows that such policies also work quickly to reduce the
higher prices of more efficient solutions, very often with no observable increase in costs to
consumers.
Priority must be given to mandatory standards and labelling for ACs. They are relatively
straightforward to introduce and enforce, and hold the potential to make the biggest and
quickest dent in rising cooling demand in the coming decades. A strong policy response can
ensure growing access to space cooling does not come at the potentially huge costs – economic,
social and environmental – described in this report. There is much experience and knowledge
governments can draw upon in this regard, and the International Energy Agency (IEA) is ready to
support global action to ensure a sustainable cooling outcome for the planet.
© OECD/IEA, 2018© OECD/IEA, 2018
© OECD/IEA 2018                                                                                        The Future of Cooling
                                                                                                     Opportunities for energy-efficient air conditioning

                   1. The role of cooling in the energy system
                   Keeping cool
                   There are several ways of keeping buildings cool. The most basic, which has existed since the Page | 15
                   dawn of mankind, is the use of shading, solar orientation and other building designs to keep the
                   interior cool. Another basic means of cooling is an electric fan. The most advanced is air
                   conditioning, which is much more effective in reducing temperatures to provide thermal
                   comfort. 1 Heating, ventilation and air conditioning (HVAC) is the generic term given to systems
                   that provide indoor thermal comfort and improved air quality.
                   Active air conditioning, as opposed to building designs that keep indoor temperatures down, is a
                   relatively recent phenomenon. Although mechanical techniques for cooling indoor air were
                   developed as early as the 19th century and the first modern electrical air-conditioning unit was
                   invented at the beginning of the 20th century, the widespread use of ACs only started to take off,
                   initially in the United States, in the 1950s with improvements in the performance of commercial
                   devices, lower prices, and growing prosperity.
                   ACs available today vary enormously in scale and cost, from small (sometimes portable) devices
                   designed to cool a single room to large-scale systems for entire buildings and district energy
                   networks for cooling groups of buildings or big commercial premises, such as office complexes,
                   shopping malls, hotels and hospitals. All those types of air conditioning (AC) systems are usually
                   powered by electricity, though large systems can also be fuelled by natural gas, excess heat and
                   direct solar energy. The vast majority of cooling takes place in buildings located in urban areas,
                   both in the advanced industrialised countries and emerging economies.

                   Air-conditioning technologies
                   ACs come in different shapes and sizes
                   The overwhelming bulk of ACs in use throughout the world are based on vapour compression
                   refrigeration cycle technology, which is also used in most refrigerators. This technology exploits a
                   basic law of physics: when a liquid converts to a gas (in a process called phase conversion), it
                   absorbs heat; and when it condenses again (to a liquid), it releases heat. ACs exploit this feature
                   of phase conversion by forcing either natural or special chemical compounds, known as
                   refrigerants, to evaporate and condense repeatedly in a closed loop of coils. The vast majority of
                   those refrigerants in use today are human-made gases, with significant global warming potential
                   (see Chapter 2).
                   Refrigerants have properties enabling them to change state at relatively low temperatures. A fan
                   moves warm interior air over the cold, low-pressure evaporator coils. The refrigerant inside the
                   coils absorbs heat as it changes from a liquid to a gaseous state, and thus cools the air. To keep
                   cooling, the AC converts the refrigerant gas back to a liquid again. To do that, a compressor puts
                   the gas under high pressure – a process that releases heat. The heat created by compressing the
                   gas is then evacuated to the outdoors with the help of a second set of coils called condenser coils,
                   and a second fan. This cools down the gas in the coils and turns it back into a liquid, and the

                   1
                     Space cooling in this report includes air conditioning, electric fans and dehumidification in the residential and commercial
                   (service) sectors. Cooling is also used in cars and trucks, as well as in industrial processes; these sectors are not included in the
                   scope of this report.
© OECD/IEA, 2018
The Future of Cooling © OECD/IEA 2018
Opportunities for energy-efficient air conditioning
process starts all over again in a constant cycle: liquid refrigerant, phase conversion to a gas and
heat absorption, compression and phase transition back to a liquid again (Figure 1.1).
Figure 1.1 • How a standard vapour compression refrigeration cycle AC works
Page | 16
Key message • ACs use a refrigerant and a vapour compression cycle to move heat from one space to
another, providing comfort and the sensation of fresh, cool air.
A less common and simpler form of air conditioning is evaporative cooling, which does not
require a compressor or condenser, but does require a climate that is hot and dry. Water is
evaporated on cooling fins and ventilated into the building by fans. Evaporating water absorbs a
significant amount of heat (known as the latent heat of vaporisation), cooling the air in the same
way that perspiration enables humans and animals to cool themselves.
Another type of AC, typically used in the commercial (i.e. non-residential) sector, is a “thermally
driven” adsorption or absorption chiller. Such chillers can be fuelled by gas or other sources of
heat, such as industrial excess heat or solar thermal energy, which replaces the electricity used by
a mechanical compressor. Absorption chillers are the most common type of thermally driven
equipment worldwide, typically using a lithium bromide and water solution as the refrigerant.
Other refrigerants exist, such as lithium chloride and water or ammonia and water, which are
often used to produce chilled water at temperatures below 0 degrees Celsius (°C).
In practice, standard ACs are available in different configurations: they can be packaged or split;
ducted or ductless; portable or stationary; small or large (Figure 1.2).
ACs can make use of a variable- or fixed-speed fan; an inverter or fixed-speed compressor motor;
variable- or fixed-flow refrigerant; and an evaporative or condensing heat transfer method
(Box 1.1). The choice of system is determined by several factors, including the ease and cost of
installation and operation, the amount of space to be cooled, the need for flexibility in adjusting
temperatures, restrictions on indoor space and aesthetic considerations. The choice of system
can have a major impact on the cost and energy efficiency of providing cooling. Refrigerant choice
can also affect efficiency.
ACs can also be used for heating purposes through reversible heat pumps, which enable the
refrigeration cycle to be reversed and provide heating instead of cooling (and vice versa). When
the heat pump is in heating mode, the evaporator coil simply switches roles and becomes the
condenser coil, producing heat, while the condenser unit becomes the evaporator, discharging
cold air to the exterior. Depending on climatic conditions, this choice of equipment can meet both
heating and cooling needs, and heat pumps are typically much more energy efficient than
standard electric resistance heaters or fossil fuel combustion boilers.
© OECD/IEA, 2018© OECD/IEA 2018 The Future of Cooling
Opportunities for energy-efficient air conditioning
Figure 1.2 • Common types of standard ACs
Page | 17
Key message • ACs come in different sizes and configurations, and choice depends on a variety of factors
© OECD/IEA, 2018
such as the space to be cooled, application type and aesthetic preferences.The Future of Cooling © OECD/IEA 2018
Opportunities for energy-efficient air conditioning
Box 1.1 • Main types of ACs in use today
Packaged ACs range from small window units that cool a single room to large rooftop units that are
capable of cooling an entire building (often as part of an overall HVAC system). All packaged ACs,
also known as unitary systems, contain both the condenser and evaporator in a single box that
moves hot air out of the building and cool air inside. The main types of packaged ACs are as follows:
Page | 18
• Window units that are small enough to fit into a standard window frame. They are sometimes
referred to as “through-the-wall” units when sold to fit through a hole in a wall.
• Packaged terminal ACs, common in hotels, are characterised by a large unit under a window
with a grilled opening passing through the wall connecting the condensing unit on the outside to
the evaporative unit on the inside.
• Packaged portable units are designed to be easily transported inside a building from room to
room, with a hose to evacuate the hot air from the unit to the exterior.
• Packaged rooftop units, also known as outdoor packaged units, are larger packaged chiller
systems that deliver cooled air into the building through ducts.
Split-system ACs range from small room units to large systems that can cool a large complex of
buildings. In all cases, the condenser is located outside the building and is separated through piping
that carries the refrigerant to the evaporator, or air handling unit, on the inside of the building.
• Ductless mini-split systems deliver cooling to a building through refrigerant that is piped from the
outdoor condensing unit to the indoor evaporator mounted on a wall or ceiling. Ductless systems
have advantages over ducted systems, including lower distribution losses, increased energy
efficiency and increased control of temperature in each room.
• Ductless multi-split systems allow multiple rooms to be cooled from a single outdoor unit, with a
separate indoor evaporator unit(s). The main advantage of this system is the reduced number of
outdoor units while retaining the flexibility for cooling individual rooms. Variable refrigerant flow
systems are a variant of multi-split systems, which have been developed to deliver variable
refrigerant quantity depending on the cooling needs of each evaporator.
• Central ducted split-systems deliver cooling through ducted air, whereby the evaporator is
placed in a single central location, providing cooling for an entire residential or commercial
building through a system of ducts. The temperature in each zone can be controlled separately.
Chillers are large ACs that produce chilled water and distribute it throughout a building or cooling
network through pipes to an indoor system that cools the air. Compression cycle chillers can be
centrifugal, reciprocating or screw driven. Absorption cycle chillers can be fuelled by electricity,
natural gas or even solar heat. There are three main types of chillers:
• Water-cooled chillers use a condenser and refrigerant to reject heat to water, which is pumped to
a cooling tower and circulated using fins to expel heat to the atmosphere (typically through
evaporation). In certain cases, cooling towers can be replaced by ground heat exchangers,
which can reduce the amount of water to be evaporated.
• Air-cooled chillers have condensers in which the refrigerant rejects heat directly to the outside air
using one or more fans to cool the heat exchange coils.
• Evaporative-cooled chillers involve the use of a water spray to reject heat use more efficiently.
Such chillers can make use of natural gas or co-generated sources of heat to drive the
refrigeration cycle. This can be particularly useful in buildings with large cooling needs or with a
concurrent need for both air conditioning and heating. They also alleviate overall electricity load.
© OECD/IEA, 2018© OECD/IEA 2018 The Future of Cooling
Opportunities for energy-efficient air conditioning
Air conditioning is booming
Sales of ACs worldwide have been growing steadily in recent years, with only a brief dip in the
aftermath of the 2008 financial crisis. Between 1990 and 2016, annual sales of ACs nearly
quadrupled to 135 million units. The bulk of the units sold are packaged and split-system ACs for
residential and smaller commercial buildings, though the typical size of commercial ACs, including
chillers, and their associated energy use are generally much larger. By the end of 2016, an Page | 19
estimated 1.6 billion ACs were in use (Table 1.1). Measured in terms of cooling output, 2 roughly
11 675 gigawatts (GW) of capacity was in use at the end of 2016, up from 4 000 GW in 1990
(Figure 1.3). Of total capacity, just over half was in the residential sector.
Table 1.1 • Air-conditioning units and cooling capacity by country/region, 2016
Installed stock Annual sales
Million units GW output capacity Million units GW output capacity
Res Com Total Res Com Total Res Com Total Res Com Total
United 241 132 374 2 295 2 430 4 726 16 8 24 314 129 443
States
European 43 53 97 192 654 847 9 3 12 34 41 75
Union
Japan 116 33 148 407 352 759 9 2 11 47 14 61
Korea 30 29 59 129 220 348 2 2 4 19 15 34
Mexico 7 9 16 40 65 105 1 1 2 5 6 10
China 432 138 569 2 092 807 2 899 41 12 53 305 81 386
India 14 13 27 77 72 149 3 2 4 14 12 25
Indonesia 7 5 12 32 27 59 1 1 2 5 4 9
Brazil 14 14 27 59 68 127 1 0.3 1 5 1.4 6
South 1 1 3 6 15 22 0.1 0.1 0.3 0.9 1.1 2.1
Africa
Middle 30 18 47 147 153 299 4 2 6 29 16 45
East
World 1 093 529 1 622 6 181 5 491 11 673 94 40 135 848 359 1 207
Notes: Res = residential; Com = commercial; the data on air-conditioning capacity and units shown in this report, unless otherwise
noted, include residential and commercial systems, including packaged and split units, chillers and other large space-cooling systems;
district cooling and solar cooling applications are not included in these estimates; “China” = the People’s Republic of China.
2
In this report, cooling output capacity refers to the thermal output of air conditioning systems.
© OECD/IEA, 2018The Future of Cooling © OECD/IEA 2018
Opportunities for energy-efficient air conditioning
Figure 1.3 • Worldwide stock and capacity of ACs by sector
GW cooling output capacity Million units
14 000 1 200
Commercial
12 000 1 000 capacity
10 000
800 Residential
Page | 20 8 000 capacity
600
6 000
400 Residential
4 000 stock
2 000 200
Commercial
0 0 stock
Key message • Sales of ACs, particularly to households, continue to grow briskly, pushing up the total
stock of units and global cooling capacity.
Unsurprisingly, there are big differences in the size of the stock and sales of ACs across countries
and regions, mainly reflecting differences in climate, population and prosperity. The United States
has the largest amount of installed AC capacity, around 50% of it in the residential sector
(Figure 1.4). In fact, 40% of all the installed cooling capacity in the world is in the United States.
But that share is declining as air conditioning takes off in other parts of the world, notably in
Asian countries. In 2016, sales of ACs in capacity terms were highest in the People’s Republic of
China (hereafter, “China”), where they totalled nearly 390 GW (53 million units). Sales continue to
grow rapidly in the other main markets – especially India, Indonesia and the Middle East. In the
United States, sales remain buoyant despite the already high level of market penetration thanks
to an upturn in construction in the hottest southern regions, growth in colder climate zones
(which can often have very hot summers) and replacements of older ACs.
Figure 1.4 • Aggregate AC cooling output capacity and sales by country/region, 2016
GW installed (left axis) GW sales (right axis)
2 500 625 750 125
2 000 500 600 100
1 500 375 450 75
1 000 250 300 50
500 125 150 25
0 0 0 0
United China European Japan Korea Middle India BrazilMexico Indonesia Rest of
States Union East world
Residential stock Commercial stock Residential sales Commercial sales
Key message • The United States has the largest installed AC cooling output capacity in the world, but
sales are now higher in China.
Specifically for residential ACs, China is currently the leading market in total unit sales
(41 million units), although cooling output capacity of new sales in the United States is slightly
higher (about 315 GW), given larger equipment sizing (e.g. for central HVAC systems). The next
largest markets for residential AC sales are Japan and the European Union (Figure 1.5). Per capita
AC sales vary enormously: they remain highest in Japan, the United States, Korea and China, but
rates are rising quickly in most other countries, especially those in Asia.
© OECD/IEA, 2018© OECD/IEA 2018 The Future of Cooling
Opportunities for energy-efficient air conditioning
Figure 1.5 • Sales of residential ACs by country/region, 2016
Million units Units per 1 000 people
42 70
36 60
30 50
24 40
Page | 21
18 30
12 20
6 10
0 0
China United Japan European Middle India Korea Indonesia Brazil Mexico Rest of
States Union East world
Residential sales Sales per 1 000 people
Key message • The market for residential ACs is dominated by China, the United States, Japan and the
European Union, but sales are rising strongly in other emerging economies, especially in Asia.
Of the 1.6 billion ACs in use throughout the world at the end of 2016, over half were in just two
countries: China, which has 570 million units, and the United States, where there are 375 million
(Figure 1.6). Other countries with more than 20 million units include Japan, with 150 million,
Korea (60 million), Brazil and India (both nearly 30 million). The remaining ACs are mostly in the
European Union, where there are nearly 100 million units, and the Middle East (around 50 million
units). Nearly 70% of all the ACs globally is in residential buildings. Household ownership of ACs
varies enormously across countries, from around 4% in India and less than 10% in Europe, to over
90% in the United States and Japan, and close to 100% in a few Middle Eastern countries. In
China, nearly 60% of households now have at least one AC (see Chapter 2).
Figure 1.6 • Stock of ACs by country/region and type, end 2016
Rest of United
Middle
world States Packaged
East
15.2% 23.0% units
2.9%
16%
Indonesia
0.7% European
Union Chillers Mini- and
Mexico 6.0% 2% multi-
1.0% ductless
Brazil Japan splits
1.7% 9.2% Central 77%
ductless
India
Korea splits
1.6%
China 3.6% 5%
35.1%
Total capacity = 11 675 GW (1.6 billion units)
Key message • Air conditioning is highly concentrated in a small number of countries, with two-thirds of
all systems in use found in just three countries – China, the United States and Japan.
The overwhelming majority of ACs in use today around the world are split systems – either
individual mini-split or multi-split ACs. Split systems have always been the preferred option in
Asia and Europe. Central ductless split systems make up about 5% of the capacity of all the ACs in
use worldwide, a share that has fallen marginally over recent years as the use of AC in smaller
housing units, such as apartments, for which split systems are more amenable, has grown. There
are also very big differences in the average efficiency of ACs across regions (see Chapter 2).
Chillers are used almost exclusively in commercial buildings, large central systems in large
© OECD/IEA, 2018
residential blocks and district cooling networks. There are an estimated 41 million chillers in useThe Future of Cooling © OECD/IEA 2018
Opportunities for energy-efficient air conditioning
around the world (Figure 1.7), of which 35 million are electric powered and water or air cooled.
Their capacity amounted to 3 350 GW, equal to 60% of total commercial air-conditioning needs.
Thermally driven chillers, typically using natural gas, account for another 470 GW of cooling
capacity, or nearly 5.5 million units. The United States remains the single largest market for
chillers, with just under half of the global stock and 42% of sales in 2016, though these shares
Page | 22 have been falling in recent years with market saturation. Demand for chillers has expanded the
most in China since 2005, which now accounts for 10% of the total stock worldwide and 20% of
the 2.4 million chillers sold across the world in 2016.
Figure 1.7 • Stock of chillers by country/region
Million units GW output capacity
42 3 500
36 3 000
30 2 500
24 2 000
18 1 500
12 1 000
6 500
0 0
United States Japan China Rest of world
Key message • The stock of chillers worldwide has been growing steadily, though less rapidly than
standard package and split ACs, with most growth in the United States and China.
Household fans
Electric fans remain a common form of cooling. An estimated 2.3 billion residential electric fans
were in use in 2016 around the world, 3 with an estimated 55% of all households globally owning
at least one fan. Today, there are twice as many fans in use as ACs in households worldwide, but
the ratio is falling quickly as AC ownership expands. Several types of fan are in use, ranging from
portable table and pedestal fans to window, box and ceiling fans. In some countries, evaporative
coolers or misting fans are also common, providing an additional feeling of comfort by converting
liquid water to vapour – a process similar to human perspiration. These fans, which work in a
similar way to ACs, reduce the temperature of the air, though their effectiveness depends on
relative humidity (i.e. the level of water vapour already in the air).
Like ACs, household fans also come in a wide variety of shapes and sizes, which – along with their
efficiency and how often they are used – affect their energy use (see below). They typically use
less than 10% of the energy consumed by a packaged or split-system AC for an equivalent space.
Household fans will continue to play an important role in meeting growing cooling demand,
especially in developing countries where fans are by and large much more affordable than a
standard AC. In many countries, especially in Africa and South Asia, household fan ownership is
expected to grow rapidly as more people gain access to electricity, providing greater comfort until
households can afford to buy an AC. Depending on climate and building design, fans could
continue to meet a significant share of residential space-cooling needs (see Chapter 4).
3
Data on the number of fans and their energy use are poor. The International Energy Agency (IEA) estimates that the energy
use of residential fans globally was barely a tenth of that of ACs (see below). For these reasons, the focus of this report is on
ACs.
© OECD/IEA, 2018You can also read