Title Single-cell profiling of Ebola virus infection in vivo reveals viral and host transcriptional dynamics
←
→
Page content transcription
If your browser does not render page correctly, please read the page content below
bioRxiv preprint doi: https://doi.org/10.1101/2020.06.12.148957. this version posted June 14, 2020. The copyright holder for this preprint
(which was not certified by peer review) is the author/funder. It is made available under a CC-BY-NC-ND 4.0 International license.
Title
Single-cell profiling of Ebola virus infection in vivo reveals viral and host transcriptional
dynamics
Author list
Dylan Kotliar1,2,3,4,16,*, Aaron E. Lin2,3,5,16,18,*, James Logue6, Travis K. Hughes3,4,7,8, Nadine M.
Khoury2,3, Siddharth S. Raju1,2,3, Marc H. Wadsworth II3,7,8, Han Chen9, Jonathan R. Kurtz6,
Bonnie Dighero-Kemp6, Zach B. Bjornson9, Nilanjan Mukherjee9, Brian A. Sellers10, Nancy
Tran3,8, Matthew R. Bauer2,3, Gordon C. Adams2,3, Ricky Adams6, John L. Rinn3,11, Marta
Melé3,12, Garry P. Nolan9,17, Kayla G. Barnes3,13,14,17, Lisa E. Hensley6,17,*, David R. McIlwain9,17,*,
Alex K. Shalek3,4,7,8,17, Pardis C. Sabeti2,3,15,17, Richard S. Bennett6,17
1
Department of Systems Biology, Harvard Medical School, Boston, MA 02115, USA. 2 FAS
Center for Systems Biology, Department of Organismic and Evolutionary Biology, Harvard
University, Cambridge, MA 02138, USA. 3 Broad Institute of MIT and Harvard, Cambridge, MA
02142, USA. 4 Harvard-MIT Division of Health Sciences and Technology, Massachusetts
Institute of Technology, Cambridge, MA 02142, USA. 5 Harvard Program in Virology, Harvard
Medical School, Boston, MA 02115, USA. 6 Integrated Research Facility, Division of Clinical
Research, National Institute of Allergy and Infectious Diseases, National Institutes of Health,
Frederick, MD 21702, USA. 7 Department of Chemistry, Institute for Medical Engineering and
Sciences (IMES), Koch Institute for Integrative Cancer Research, MIT, Cambridge, MA 02142,
USA. 8Ragon Institute of MGH, Harvard, and MIT, Cambridge, MA 02139, USA. 9 Department of
Pathology, Stanford University, Stanford, CA 94305, USA. 10 Trans-NIH Center for Human
Immunology, Autoimmunity, and Inflammation, National Institutes of Health, Bethesda, MD
20814, USA. 11 BioFrontiers Institute, University of Colorado Boulder, Boulder, CO 80303, USA.
12
Life Sciences Department, Barcelona Supercomputing Center, Barcelona, Catalonia 08034,
Spain. 13
Department of Immunology and Infectious Diseases, Harvard T.H. Chan School of
Public Health, Harvard University, Boston, MA, USA. 14 MRC-University of Glasgow Centre for
15
Virus Research, Glasgow, UK. Howard Hughes Medical Institute, Chevy Chase, MD 20815,
USA. 16These authors contributed equally. Authors listed alphabetically by last name. 17
These
18
authors contributed equally. Lead contact. *Correspondence: Dylan_Kotliar@hms.harvard.edu
(D.K.), ALin@broadinstitute.org (A.E.L.), Lisa.Hensley@nih.gov (L.E.H.),
McIlwain@stanford.edu (D.R.M.)
1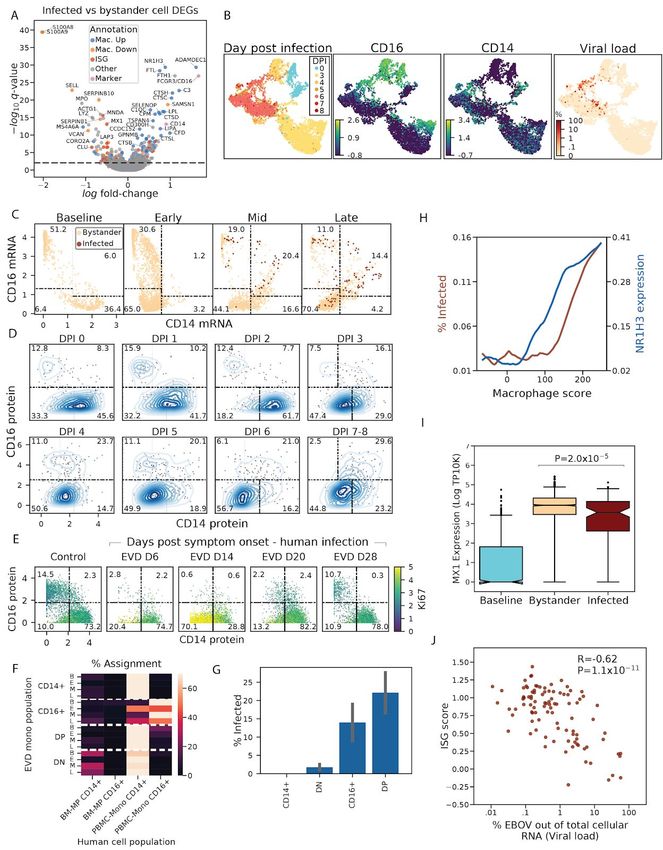
bioRxiv preprint doi: https://doi.org/10.1101/2020.06.12.148957. this version posted June 14, 2020. The copyright holder for this preprint
(which was not certified by peer review) is the author/funder. It is made available under a CC-BY-NC-ND 4.0 International license.
Summary
Ebola virus (EBOV) causes epidemics with high case fatality rates, yet remains understudied
due to the challenge of experimentation in high-containment and outbreak settings. To better
understand EBOV infection in vivo, we used single-cell transcriptomics and CyTOF-based
single-cell protein quantification to characterize peripheral immune cell activity during EBOV
infection in rhesus monkeys. We obtained 100,000 transcriptomes and 15,000,000 protein
profiles, providing insight into pathogenesis. We find that immature, proliferative
monocyte-lineage cells with reduced antigen presentation capacity replace conventional
circulating monocyte subsets within days of infection, while lymphocytes upregulate apoptosis
genes and decline in abundance. By quantifying viral RNA abundance in individual cells, we
identify molecular determinants of tropism and examine temporal dynamics in viral and host
gene expression. Within infected cells, we observe that EBOV down-regulates STAT1 mRNA
and interferon signaling, and up-regulates putative pro-viral genes (e.g., DYNLL1 and HSPA5) ,
nominating cellular pathways the virus manipulates for its replication. Overall, this study sheds
light on EBOV tropism, replication dynamics, and elicited immune response, and provides a
framework for characterizing interactions between hosts and emerging viruses in a maximum
containment setting.
2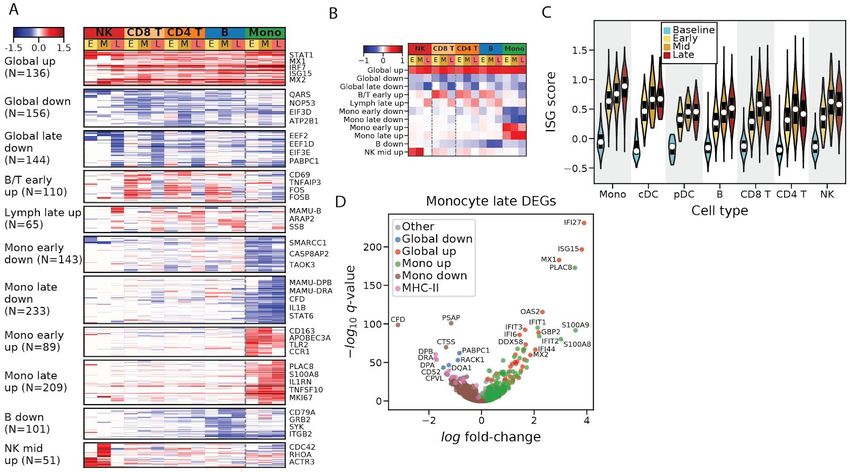
bioRxiv preprint doi: https://doi.org/10.1101/2020.06.12.148957. this version posted June 14, 2020. The copyright holder for this preprint
(which was not certified by peer review) is the author/funder. It is made available under a CC-BY-NC-ND 4.0 International license.
Introduction
Ebola virus (EBOV) is among the world’s most lethal pathogens, with an estimated case fatality
rate of 66% in the recent epidemic in the Democratic Republic of the Congo (Ilunga Kalenga et
al., 2019; World Health Organization, 2019) and 40% in the 2013–2016 epidemic in West Africa
(Lo et al., 2017). EBOV infection in humans causes Ebola virus disease (EVD), characterized by
fever, malaise, muscle aches, and gastrointestinal distress, rapidly progressing to coagulopathy,
shock, and multi-organ failure (Malvy et al., 2019). While recently developed vaccines (Kennedy
et al., 2017) and monoclonal antibody therapeutics (Mulangu et al., 2019) have shown great
promise for preventing and treating EVD, case fatality rates in treated patients still exceed 30%,
highlighting the need for further research into disease pathogenesis.
Studies of EVD pathogenesis, while paramount, face numerous logistical challenges which have
limited their scope relative to studies of other pathogens. Experiments involving live EBOV
require maximum containment (e.g., biosafety level 4 [BSL-4]) and therefore are restricted to a
small number of highly specialized research facilities. In vivo studies are especially challenging:
human EVD is difficult to study in the midst of deadly outbreaks in resource-limited settings,
necessitating animal models. However, commonly used laboratory mouse lines are resistant to
naturally occurring EBOV isolates, limiting their utility for research (Bray, 2001; Rasmussen et
al., 2014). Moreover, rodents and other small animal models such as ferrets lack the
primate-specific NPC1 genotype (Diehl et al., 2016), the key cellular receptor for EBOV entry
(Carette et al., 2011; Côté et al., 2011), and do not always recapitulate human EVD-like disease
(Bray et al., 2001; Geisbert et al., 2002). EVD in nonhuman primates (NHPs) most closely
resembles human EVD (Bennett et al., 2017; Geisbert et al., 2015; St Claire et al., 2017), but
NHP studies are often limited to small sample sizes, which reduces power to identify statistically
significant trends and to discern meaningful inter-individual variability.
The two predominant approaches to studying EVD – analyzing infected cells in culture and
infected animals in vivo – have revealed important, if somewhat contradictory, aspects of how
EBOV impacts the host immune system. In cell culture, EBOV infects myeloid cells, potently
inhibiting both production of type 1 interferon (Basler et al., 2003; Gupta et al., 2001; Harcourt et
al., 1998) and signal transduction downstream of interferon receptors (Harcourt et al., 1999;
Kash et al., 2006; Leung et al., 2006; Reid et al., 2008). Under-activation of this key innate
antiviral response hinders the ability of antigen-presenting cells to activate the adaptive immune
system to combat infection (Bosio et al., 2003; Lubaki et al., 2013; Mahanty et al., 2003), a key
determinant of fatal outcomes (Baize et al., 1999) and could be due to reduced presentation of
viral proteins by antigen-presenting cells (Lüdtke et al., 2016). In contrast to these culture-based
findings, EVD in vivo is characterized by high fever and dramatic up-regulation of hundreds of
interferon stimulated genes (Caballero et al., 2016; Liu et al., 2017; Reynard et al., 2019;
Speranza et al., 2018), correlating with the release of dozens of inflammatory cytokines
(Caballero et al., 2016; Reynard et al., 2019; Wauquier et al., 2010), suggesting that an aberrant
3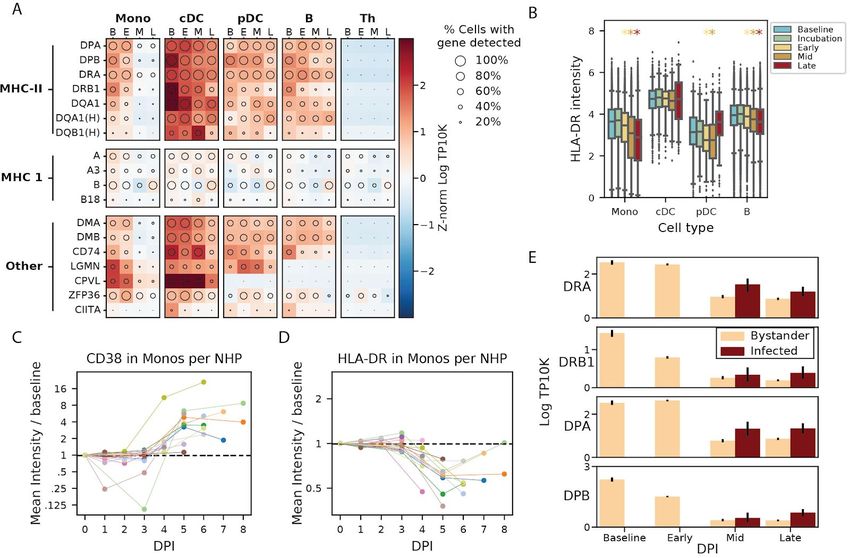
bioRxiv preprint doi: https://doi.org/10.1101/2020.06.12.148957. this version posted June 14, 2020. The copyright holder for this preprint
(which was not certified by peer review) is the author/funder. It is made available under a CC-BY-NC-ND 4.0 International license.
over-activation of innate and adaptive immunity underlies much of EVD pathology, rather than
solely virus-mediated cytotoxicity (Geisbert et al., 2003a, 2003b).
High-throughput single-cell technologies, such as single-cell RNA-sequencing (scRNA-Seq) and
protein quantification by CyTOF (Bendall et al., 2011), have made it possible to analyze the
response of individual cells to viral infection at unprecedented resolution (Hamlin et al., 2017;
Hein and Weissman, 2019; Newell et al., 2012; O’Neal et al., 2019; Russell et al., 2018, 2019;
Steuerman et al., 2018; Zanini et al., 2018a; Zhao et al., 2020). By generating mRNA or protein
profiles for thousands of cells in a sample, these methods can quantify the cell-type composition
and expression programs of individual cells -- signals that are obscured in bulk measurements.
By quantifying viral RNA within individual cells, scRNA-Seq allows comparison of gene
expression between infected and uninfected cells in a diseased host (i.e., bystander cells),
which can yield a far more nuanced view of host (Steuerman et al., 2018) and viral (Hein and
Weissman, 2019) gene expression within infected cells. Further, this approach can be used to
disentangle the direct effects of EBOV infection within a cell from the effect of the inflammatory
cytokine milieu. However, many scRNA-Seq technologies require droplet generator devices and
inactivation protocols that can be challenging to establish in a maximum containment facility. As
a result, such approaches have yet to be applied to a risk group 4 (RG-4) pathogen such as
EBOV. Furthermore, high-volume exhaust, superheated components, and other aspects of
CyTOF instrumentation make these devices incompatible with installation in maximum
containment facilities (Logue et al., 2019), necessitating development of new protocols
compatible with sample inactivation to study RG-4 pathogens.
Here, we describe the first investigation of an RG-4 agent under maximum containment with
high-dimensional single-cell technologies. We apply CyTOF and Seq-Well--a portable single-cell
RNA-seq platform (Gierahn et al., 2017; Hughes et al., 2019)--to a combined total of 90
peripheral blood mononuclear cell (PBMC) samples (90 by CyTOF, 28 by Seq-Well) collected
from 21 rhesus monkeys prior to infection or at multiple timepoints following lethal EBOV
challenge in vivo. We further inoculated PBMCs with EBOV ex vivo, using pre-defined
experimental parameters, and profiled their gene expression with Seq-Well. These data allow us
to dissect host-virus interactions and comprehensively catalog changes in cell-type abundance
and cell state over the course of EVD. Moreover, as EBOV harbors an RNA genome and
transcribes polyadenylated mRNAs, we were able to detect viral RNA within individual cells,
allowing us to define EBOV tropism with high resolution and identify EBOV-associated
transcriptional changes in putative pro- and antiviral genes.
We find that EVD leads to widespread changes in the circulating monocyte populations in vivo,
both in NHPs as well as in acute human infections, with replacement of conventional monocyte
subsets with a highly proliferative monocyte precursor population and a macrophage-like
population that is enriched for EBOV-infected cells. Furthermore, by comparing infected and
uninfected bystander monocytes, we resolve the apparent contradiction between in vivo and in
vitro studies of EBOV. We find that bystander cells of all major immune cell types express an
interferon response program, but that this response is suppressed specifically within infected
4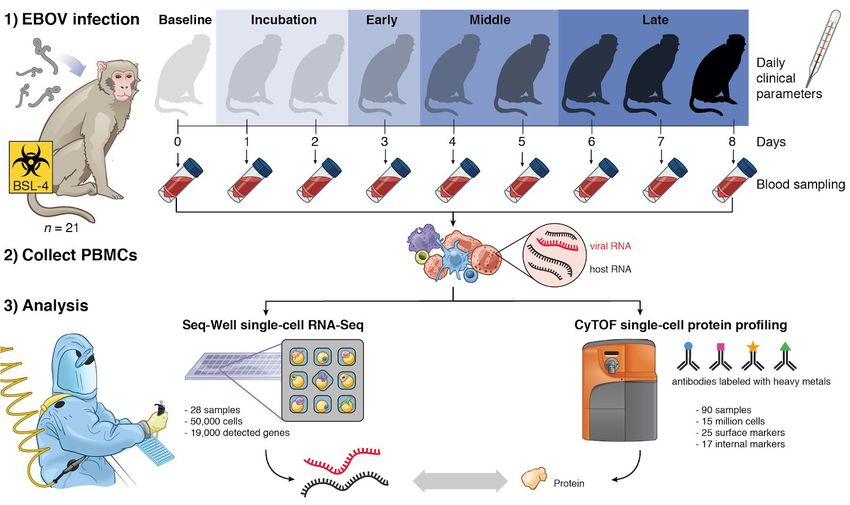
bioRxiv preprint doi: https://doi.org/10.1101/2020.06.12.148957. this version posted June 14, 2020. The copyright holder for this preprint
(which was not certified by peer review) is the author/funder. It is made available under a CC-BY-NC-ND 4.0 International license.
monocytes in vivo, consistent with previous studies in culture. In addition to down-regulating
host antiviral genes, we observe that EBOV drives the up-regulation of candidate pro-viral
genes, such as DYNLL1 and HSPA5, within infected cells. Taken together, this dataset
constitutes a unique resource for the study of EBOV, enabling the study of host immune
response in infected and bystander cells across cell types, in natural (in vivo) and
experimentally controlled (ex vivo) contexts.
Results
Single-cell characterization of RNA and protein expression in circulating immune
cells from Ebola virus infected rhesus monkeys
To comprehensively profile EBOV-induced immune dysfunction in vivo, we collected peripheral
immune cells from rhesus monkeys prior to infection and at multiple days post-infection (DPI),
corresponding to several stages of acute EVD (Figure 1). Cohorts of ≥3 nonhuman primates
(NHPs) were sacrificed as baseline uninfected controls (B), at pre-defined DPI, or upon
reaching pre-determined humane euthanasia criteria. These cohorts were recently
characterized for viral load, clinical score, blood chemistry (Bennett et al. in submission) and
liver pathology (Greenberg et al., 2020). Viral load first became detectable in all animals on DPI
3, preceding detectable clinical signs (e.g., fever) by 1–2 days (Figure 2A). Clinical signs of
EVD progressed until humane euthanasia criteria were uniformly reached between DPI 6–8
(Figure S1A). For each NHP, cells collected multiple times throughout disease were used for
CyTOF, while cells collected prior to infection and at sacrifice were used for CyOF and Seq-Well
(Figure S1B).
After standard quality control filters (Materials and Methods), we obtained single-cell
transcriptomes and 42-protein CyTOF profiles from ~58,000 and ~15,000,000 PBMCs,
respectively. We visualized these data with uniform manifold approximation and projection
(UMAP) non-linear dimensionality reduction (Becht et al., 2018; McInnes et al., 2018) (Figures
2B, 2C, 2E, 2F, and 2H). Unsupervised clustering of either the transcriptomes or a
down-sampled set of 1,100,000 protein profiles (Materials and Methods) yielded clusters that
could be readily identified as the major circulating immune cell types using well-known RNA and
protein markers (Figures 2B, 2C, S2A, and S2B). The CyTOF-based clustering gave
concordant results with an approach based on manual gating of conventional cell-type marker
genes (Figures S3A and S3B, Materials and Methods). After batch correction of the CyTOF
data and integration of the transcriptomes to adjust for technical sources of variation (Materials
and Methods), samples were well-distributed across cell-type clusters (Figures S2C–S2F) but
separated by DPI (Figures 2E and 2F), suggestive of dynamic cell states over the course of
disease progression. By sub-clustering within broad cell-type categories, we further identified
cell subtypes based on the expression of identifying marker genes (Figure S4).
5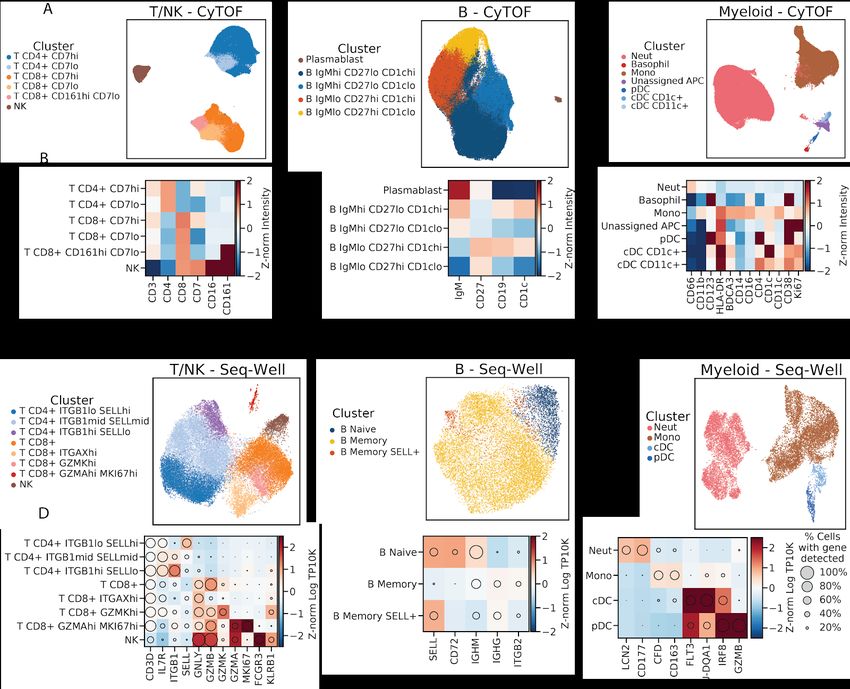
bioRxiv preprint doi: https://doi.org/10.1101/2020.06.12.148957. this version posted June 14, 2020. The copyright holder for this preprint
(which was not certified by peer review) is the author/funder. It is made available under a CC-BY-NC-ND 4.0 International license.
Cell-type abundance, proliferation, and EBOV infection rates vary throughout
EVD
In addition to the major PBMC cell types, a cluster of immature neutrophils emerged during
EVD, marked by high gene expression of CD177 and SOD2, and protein expression of CD66
and CD11b. Though neutrophils are typically removed during density-based PBMC isolations,
immature neutrophils (i.e., band cells) – which are less dense than mature polymorphonuclear
neutrophils – can be released from the bone marrow and co-isolate with PBMCs in infectious
and autoimmune inflammatory conditions (Carmona-Rivera and Kaplan, 2013; Darcy et al.,
2014; Deng et al., 2016), including during EVD (Eisfeld et al., 2017). Neutrophils were almost
entirely absent from baseline samples in our data but constituted a high proportion of cells in
late EVD samples (scRNA-Seq: 0.2% of baseline cells compared to 65.1% of late EVD cells;
CyTOF: 9.3% of baseline compared to 49.8% of late EVD; Figures S5A and S5B), which
supports the hypothesis that band cells are released into the periphery from the bone marrow in
response to cytokines elicited during EVD.
Next, we quantified absolute abundance of each cell type over the course of EVD by combining
CyTOF data with complete blood counts (CBC) (Materials and Methods) (Bennett et al. in
submission). CBC provided direct neutrophil, lymphocyte, and monocyte abundances, and we
integrated CBC and CyTOF data to obtain differential abundances of the lymphocyte cell types.
Cell-type percentage estimates based on CyTOF were in general agreement with those based
on scRNA-Seq (Figure S5A).
In agreement with previous NHP studies (Ebihara et al., 2011; Fisher-Hoch et al., 1985), there
was a >5-fold increase in neutrophil abundance by DPI 4 relative to baseline, before levels
returned to baseline in late EVD (p < .05 for DPI 3–4, p = 0.059 for DPI 5, Wilcoxon signed-rank
test, Figures 2D and S5B). Also consistent with previous studies, we observed a marked
decrease in lymphocyte abundance with NK cells declining one day before the other cell types
(p < 0.05 on DPI 3–6 for B, NK, CD8+ T, and CD4+ T; except for CD4+ T on DPI 5, Wilcoxon
signed-rank test). Interestingly, all lymphocyte populations slowly recovered after DPI 4 (Figure
S5B). Monocyte abundance initially increased >2-fold before declining precipitously between
DPI 4 and 5.
Changes in circulating cell-type abundance could reflect cell proliferation and/or death, as well
as movement of cells into and out of bone marrow, lymph, and tissues. While we were unable to
directly quantify rates of death or movement between different compartments, we estimated the
fraction of actively dividing cells using the proliferation marker Ki67 (encoded by the gene
MKI67) in both the CyTOF and scRNA-Seq data, and found good agreement between the two
modalities (Figure S5C).
The fraction of Ki67+ monocytes increased dramatically from 17% at baseline to 56% at DPI 5
and remained >40% for the remainder of disease (p = 1.1x10⁻⁵ rank-sum test of DPI 5-8 vs.
baseline samples), suggesting an increase in proliferation (Figures 2G and S5D). By contrast,
6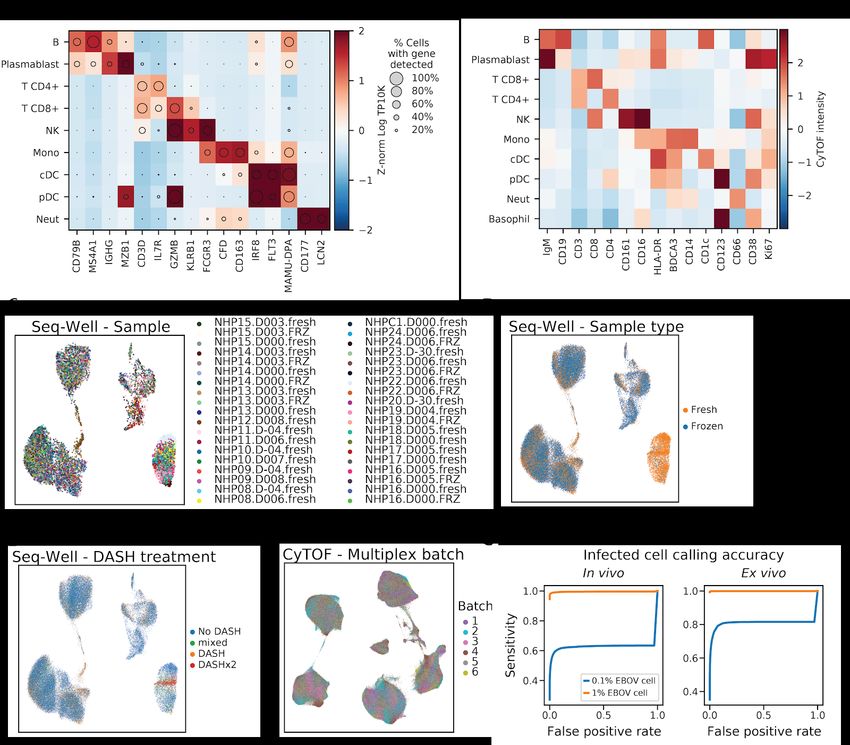
bioRxiv preprint doi: https://doi.org/10.1101/2020.06.12.148957. this version posted June 14, 2020. The copyright holder for this preprint
(which was not certified by peer review) is the author/funder. It is made available under a CC-BY-NC-ND 4.0 International license.
neutrophil proliferation remained roughly constant (Figures 2G and S5D) despite the dramatic
changes in abundance (Figures 2D and S5B), further evidence that immature neutrophils were
released from the bone marrow during disease (Summers et al., 2010). Intriguingly, the fraction
of dividing T and NK cells stayed relatively constant for most of the time course but increased
dramatically on DPI 8 for both of the NHPs (out of 6 total) that survived until then, both by RNA
(Figure S5C) and protein levels (p = 0.022 rank-sum test of DPI 8 vs. baseline for NK, CD8+ T,
and CD4+ T, Figure S5D). Proliferation is a core component of effective T-cell mediated viral
clearance, but requires time for activated T cells to accumulate; the observation that significant
proliferation of circulating T cells only occurred in the 2 animals that survived until the latest DPI
suggests that those animals may have begun to mount a T-cell response.
Not all cell types support EBOV entry and replication; here, we were able to identify which cells
were infected in vivo using scRNA-Seq because EBOV has an RNA genome and produces
poly-adenylated mRNA transcripts (Figure 2H). However, uninfected cells may also contain
EBOV reads due to ambient RNAs that contaminate single-cell profiles (Fleming et al., 2019;
Young and Behjati, 2018). We therefore developed a statistical approach to identify infected
cells as those that contain more EBOV transcripts than would be expected by chance, based on
the relative abundance of EBOV-mapped transcripts in a cell and the amount of ambient RNA
contamination (Materials and Methods). This allowed us to control the false positive rate (FPR)
at a pre-specified level while maximizing power to call infected cells. At a FPR of 1%, we were
well-powered to identify an infected cell when ≥1% of its transcripts mapped to EBOV, and
estimated an average sensitivity of 51% when ≥0.1% of cellular transcripts derived from EBOV
(Figure S2G) though the sensitivity for a given cell depends on read depth and other
parameters (Materials and Methods). In addition, we spiked uninfected Madin-Darby canine
kidney (MDCK) cells into a subset of PBMC samples to serve as a negative control (Table S1,
Materials and Methods).
Monocytes comprised the main infected cell population in vivo, first detectable at DPI 4, with an
increasing fraction of infected monocytes thereafter (Figure 2I). Consistent with previous
studies, T cells, B cells, and neutrophils were not identified as infected more often than would
be expected by chance (1% FPR threshold), nor more often than MDCK control cells. We did
not observe any infected plasmacytoid (pDC) or conventional dendritic cells (cDC) in circulation,
though infected DCs have been observed in culture and in lymph nodes (Geisbert et al., 2003c)
(see Discussion).
Interferon response drives gene expression programs across multiple cell types
Having examined temporal shifts in the frequency of each immune cell type, we next sought to
comprehensively catalog changes in their respective gene expression profiles throughout EVD.
To increase statistical power to detect differentially expressed genes, we grouped cells into EVD
stages based on clinically relevant phenomena: "incubation" which precedes detectable viral
load or clinical signs (DPI 1 and 2; CyTOF only), "early" when there is detectable viral load but
no clinical signs (DPI 3), "middle" when there is detectable viral load and clinical signs (DPI 4
7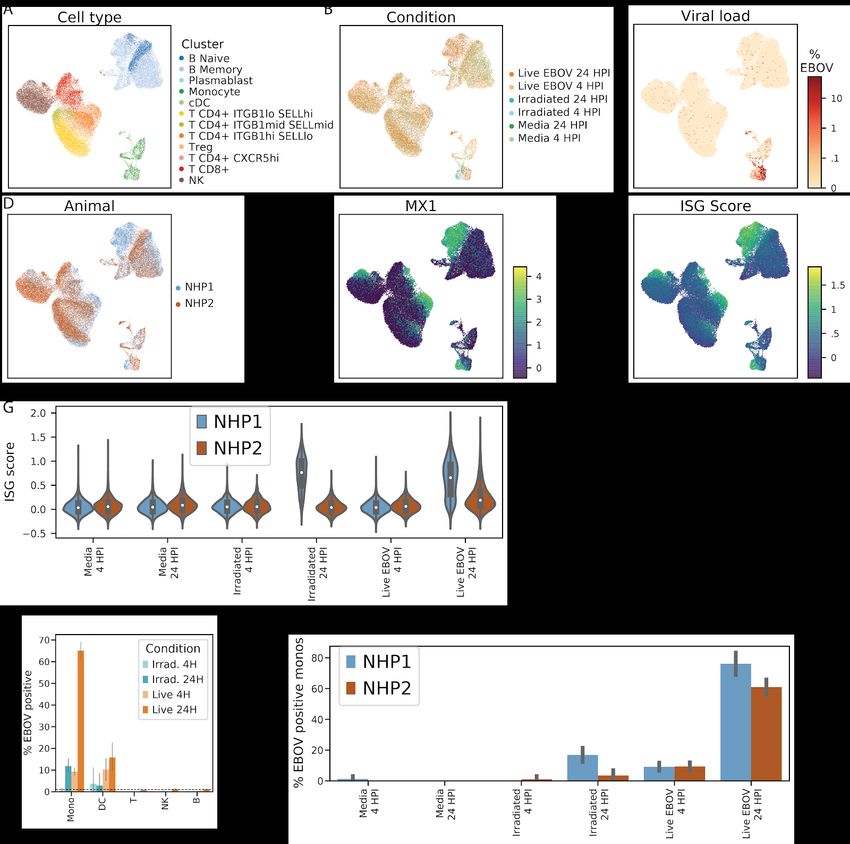
bioRxiv preprint doi: https://doi.org/10.1101/2020.06.12.148957. this version posted June 14, 2020. The copyright holder for this preprint
(which was not certified by peer review) is the author/funder. It is made available under a CC-BY-NC-ND 4.0 International license.
and 5), and "late" when animals uniformly reached human euthanasia criteria (DPI 6–8) (Figure
1).
We compared transcriptomes of cells from each EVD stage to baseline for each cell type
individually (Materials and Methods). This identified 1,437 differentially expressed genes with
an FDR corrected q-value < 0.05 and a fold-change of greater than 30% in at least one cell type
and stage (Table S2). To identify patterns of gene expression associated with cell type and
time, we performed unsupervised clustering of the differential expression signatures and
identified 11 modules of genes sharing similar patterns of changes (Figures 3A and 3B, Table
S3, Materials and Methods). We excluded neutrophils, pDCs, cDCs, and plasmablasts
because of small sample sizes. Three modules which we term "Global" were broadly up or
down-regulated across cell types, and the remaining modules were cell-type specific.
The “Global up” module contained 136 genes, consisting mostly of regulators and targets of the
interferon (IFN) alpha (α) and gamma (γ) signal transduction cascade such as STAT1, IRF7,
MX1, and ISG15. Gene sets labeled “response to interferon alpha”, and “response to interferon
gamma” were significantly enriched in this module (IFNα: OR = 69.5, q = 8x10-39; IFNγ: OR =
45.9, q = 1x10-39; Fisher's exact test; Table S3). The emergence of an IFN response was
consistent with another observation: IFNγ mRNA rises >10-fold in CD8+ T-cells from an average
of 0.4 transcripts per ten thousand (TP10K) at baseline to 5.0 at mid stage EVD. Concurrently,
type 1 IFN (α/β) mRNAs rose from undetectable at baseline to 0.03–0.05 TP10K at late EVD in
monocytes, along with a large number of other cytokines (Figure S6A). However, the increase
in type 1 IFN mRNAs was not statistically significant, as IFN mRNAs are expressed transiently
(Lin et al., 2011). To further characterize the dynamics of the IFN response, we assigned an
interferon stimulated gene (ISG) score to each cell, reflecting the average expression of
literature-annotated ISGs that overlap with the "Global up" module (Table S3, Materials and
Methods). The median ISG score increased substantially throughout EVD across each cell type
(p < 1x10⁻⁵ for all cell types and periods, rank-sum test, Figure 3C).
As there is substantial overlap between the genes stimulated by IFNα and IFNγ, we sought to
determine if one cytokine predominated, or if both acted independently. We therefore identified
genes that were annotated as regulated by IFNα but not IFNγ (i.e., uniquely IFNα-regulated)
and vice versa. Both uniquely IFNα- and uniquely IFNγ-regulated genes were significantly
enriched in the “Global up” module (q < 0.01, Table S3), with a larger fold-change for the
uniquely IFNα-regulated genes (IFNα OR = 20.9, IFNγ OR = 16.6). This pattern held true for
each cell type and EVD stage separately (Figure S6B). These results suggest that both IFNα
and IFNγ substantially and independently influenced the gene expression profiles of circulating
cells during EVD.
The "Global late down" module contained 144 genes that were predominantly down-regulated
across cell types during late EVD. It contained numerous regulators of translation initiation and
elongation (e.g. EEF2, EEF1D, EIF3E, and PABPC1; REACTOME_TRANSLATION gene set
enrichment q = 5.2x10⁻⁷, Table S3), which is consistent with a core antiviral function of IFN
8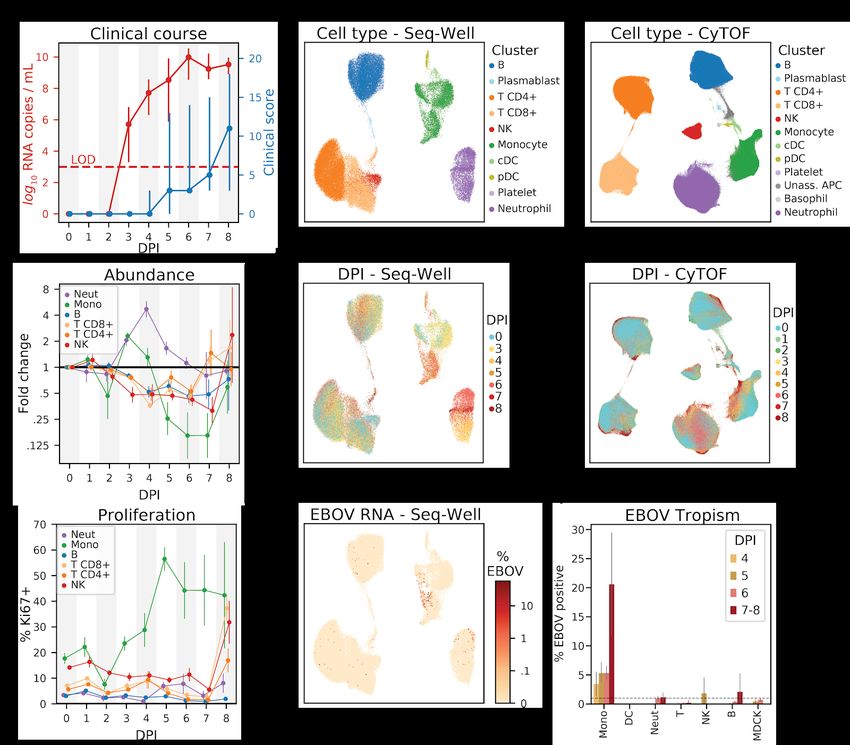
bioRxiv preprint doi: https://doi.org/10.1101/2020.06.12.148957. this version posted June 14, 2020. The copyright holder for this preprint
(which was not certified by peer review) is the author/funder. It is made available under a CC-BY-NC-ND 4.0 International license.
being to down-regulate translation (Li et al., 2015). The “Global down” module contained 156
genes, and similar to "Global late down", included several other genes involved in translation
(e.g. QARS, NOP53, and EIF3D). In addition, this module was most significantly enriched for
the HALLMARK_MITOTIC_SPINDLE gene set (q = 8.5x10⁻⁷) suggesting a global
down-regulation of cell cycling upon activation.
Cell-type and temporally-specific modules underlie cell states related to clinical
phenomena in EVD
After elucidating the global effects of EBOV infection on immune cells, we next investigated the
transcriptional responses specific to each cell population.
The 2 modules “B/T early up” and “Lymph late up” reflect changing gene expression states of
lymphocytes at different stages of acute EVD. “B/T early up” is strongly associated with the
gene set HALLMARK_TNFA_SIGNALING_VIA_NFKB (q = 1.3x10⁻⁹) and is characterized by
many lymphoid activation genes including the canonical marker CD69 (Testi et al., 1994), CD48
(McArdel et al., 2016), and the transcription factor FOS (Foletta et al., 1998). This module is
unlikely to represent antigen-dependent activation via the BCR/TCR as it occurs in most
lymphocytes and does not coincide with proliferation. Indeed, several of the top up-regulated
genes, such as GADD45B and ZFP36L2, are associated with growth arrest. In addition, the 5th
most enriched gene set in the “B down” module is
“REACTOME_ANTIGEN_ACTIVATES_B_CELL_RECEPTOR_LEADING_TO_GENERATION_
OF_SECOND_MESSENGERS” (q = 0.00017) suggesting a reduction in BCR activation
generally. Thus, the “B/T early up” module likely represents a cytokine-mediated,
non-antigen-dependent activation of lymphocytes.
The “Lymph late up” module is up-regulated in late EVD across all lymphocyte cell types. The
top associated gene sets implicate DNA repair (PUJANA_ATM_PCC_NETWORK, q = 0.00031)
and apoptosis via TRAIL (HAMAI_APOPTOSIS_VIA_TRAIL_UP, q = 0.00032). This latter gene
set is potentially consistent with previous reports of T-cell apoptosis in EVD (Geisbert et al.,
2000; Iampietro et al., 2017; Wauquier et al., 2010) and with the lymphopenia in our dataset
(Figure 2D).
The “NK mid up” module is highly specific to NK cells during early EVD (Figure 3A) and is most
enriched for “MARSON_BOUND_BY_FOXP3_STIMULATED” (q = 0.071) and
“BIOCARTA_CDC42RAC_PATHWAY” (q = 0.08, Table S3). FOXP3 expression is
characteristic of invariant NK cells (Engelmann et al., 2011) that secrete a wide variety of
cytokines in response to stimulation (Krovi and Gapin, 2018). The CDC42/RAC pathway is
essential for the polarization of cytolytic granules in NK cells, a requirement for effective
cytotoxicity (Sinai et al., 2010; Tybulewicz and Henderson, 2009). This suggests that NK cells
became activated with increased cytotoxicity in the mid EVD stage, but not in late EVD.
9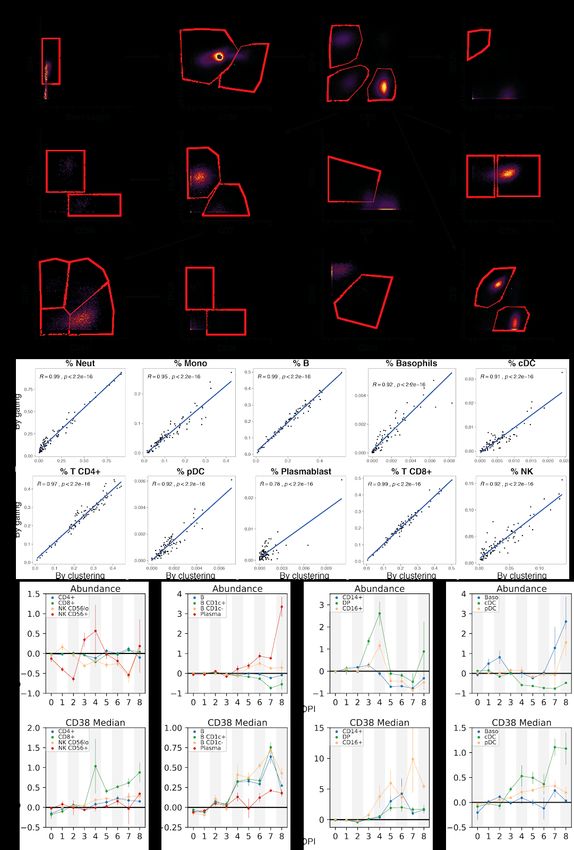
bioRxiv preprint doi: https://doi.org/10.1101/2020.06.12.148957. this version posted June 14, 2020. The copyright holder for this preprint
(which was not certified by peer review) is the author/funder. It is made available under a CC-BY-NC-ND 4.0 International license.
Monocytes express reduced MHC class II mRNAs and proteins independent of
infection status
Monocytes were of particular interest. In addition to being the preferred target of EBOV (Figure
2I), they had far more significant gene expression changes during EVD than the other cell types.
1,020 genes (11.6% of total genes tested) were differentially expressed in monocytes at one or
more EVD stages versus baseline, compared to 505 genes (6.6%) for B cells, the cell type with
the second most differentially expressed genes. We therefore focused our attention on
characterizing monocytes in detail.
One prominent feature of the monocyte differential expression profile was the striking
down-regulation of several MHC class II (MHC-II) genes by mid and late EVD (Figure 3D).
Monocytes and professional antigen-presenting cells display viral antigens on MHC-II proteins
at the cell surface to stimulate the adaptive immune response. While IFNγ typically up-regulates
MHC-II gene and protein expression (Steimle et al., 1994), we observed decreased MHC-II on
monocytes despite elevated IFNγ mRNA levels in T cells (Figure S6A) and widespread IFNγ
transcriptional response in monocytes (Figure S6B). Previous reports have described loss of
HLA-DR, one of the 4 MHC-II proteins, during EBOV infection of monocytes ex vivo (Hensley et
al., 2002), in experimentally infected NHPs (Menicucci et al., 2017) and in human EVD cases
(Lüdtke et al., 2016), similar to observations of reduced HLA-DR on monocytes in patients
experiencing septic shock (Wolk et al., 2000). However, the specific MHC genes affected, the
cell-type specificity, temporal dynamics, and relationship with EBOV infection status, have not
been previously described.
We observed widespread changes in levels of MHC genes throughout EVD (Figure 4A). The
most striking decreases occurred in MHC-II genes of monocytes (>5-fold for DPA, DPB, and
DRA by late EVD, q < 1x10-21 for all MHC-II genes), with smaller effect-size changes in MHC-I
genes (1.9-fold for DPA, DPB, DRA, and DQA1 at late disease, q
< 1x10-22). pDCs and cDCs showed no statistically significant reduction of any MHC-II gene (q >
0.05) but our dataset contained few DCs (Table S1), so we had less power to detect these
effects. We observed a corresponding pattern in the protein levels by CyTOF: in monocytes,
HLA-DR protein levels decreased to a greater extent than in the other cell types (p < 1x10-61 for
monocytes in early, mid, and late stages, rank-sum test, Figure 4B), with a more modest
reduction of HLA-DR in B cells at DPI 5–8 (p = 0.0012, rank-sum test) (Figure S6C). This
phenomenon held true for each individual NHP; even as monocytes became activated,
demonstrated by up-regulation of the canonical activation marker CD38 (Amici et al., 2018)
(Figures 4C and S3D), they showed dramatic down-regulation of average HLA-DR protein
expression in monocytes at DPI 5–8 versus baseline (p = 9.5x10⁻⁷, rank-sum test) (Figure 4D).
10bioRxiv preprint doi: https://doi.org/10.1101/2020.06.12.148957. this version posted June 14, 2020. The copyright holder for this preprint
(which was not certified by peer review) is the author/funder. It is made available under a CC-BY-NC-ND 4.0 International license.
Reduced MHC-II expression in monocytes was not a direct consequence of EBOV infection.
Only a small (~5%) percentage of monocytes were infected at mid EVD (Figure 2I), suggesting
that the striking decreased levels of MHC-II genes was unlikely to be specific to infected cells.
Moreover, we confirmed that the average expression of MHC-II genes was comparable or even
higher in infected cells relative to uninfected cells in NHPs with EVD (i.e. bystanders) (Figure
4E). Thus we conclude that the MHC-II decrease in monocytes observed in EVD is independent
of direct viral infection.
To identify co-regulated genes as well as possible drivers of MHC-II down-regulation, we looked
for other genes with expression correlated with MHC-II in monocytes (Materials and Methods).
Many of the most correlated genes were functionally involved in the antigen presentation
pathway, such as CD74 (Spearman ρ = 0.42, p = 1.8x10-296), which chaperones MHC-II to the
endosome and prevents premature binding of antigen (Schröder, 2016); LGMN (Spearman ρ =
0.41, p = 8.1x10-286), a protease that cleaves proteins to facilitate peptide presentation on
MHC-II (Dall and Brandstetter, 2016); and, B2M (Spearman ρ = 0.33, 2.6x10-175), a component
of the MHC class I complex (Figure 4A). In addition, one of the most associated genes was
ZFP36 (Spearman ρ = 0.43, p < 1x10-296), a protein that directly regulates mRNA stability and
turnover of MHC-II and other immune-related RNAs (Pisapia et al., 2019). These findings
suggest that MHC-II and other genes involved in antigen presentation may be part of a single
transcriptional module, co-regulated by ZFP36 and/or other genes.
Characterization of differentially expressed genes between infected and
bystander monocytes
Next we characterized genes that were differentially expressed between infected and bystander
monocytes, as these could represent host entry factors, restriction factors, or genes that are
regulated by infection within a cell. For this and all subsequent differential expression analyses,
EBOV transcripts were excluded from the denominator when normalizing cells by library size, to
avoid a bias in the estimated expression levels of host genes in infected cells (Materials and
Methods). We identified 505 genes that were differentially expressed between infected and
bystander monocytes (q < 0.05) of which 276 changed by more than 30% (Figure 5A, Table
S4). 181 (18%) of the 1,020 genes that were differentially expressed in monocytes at one or
more stages of EVD were also differentially expressed in infected monocytes relative to
bystanders.
We observed that the differentially expressed genes fell into 3 broad categories--genes
associated with monocyte subtypes, genes associated with monocyte-to-macrophage
differentiation, and interferon stimulated genes (ISGs)--which we explore in the sub-sections
below.
Emergence of CD14- CD16- immature monocyte precursors suggests emergency myelopoiesis
11bioRxiv preprint doi: https://doi.org/10.1101/2020.06.12.148957. this version posted June 14, 2020. The copyright holder for this preprint
(which was not certified by peer review) is the author/funder. It is made available under a CC-BY-NC-ND 4.0 International license.
A notable feature of the differential expression profile was that CD14 and FCGR3 (which codes
ere over-expressed in infected monocytes relative to bystanders. These two genes
for CD16) w
define classical (CD14+) and non-classical (CD16+) monocytes respectively (Kapellos et al.,
2019), which comprise the dominant monocyte subsets in the blood of healthy individuals.
Classical monocytes are highly phagocytic scavenger cells, while non-classical monocytes are
involved in complement and antibody-mediated phagocytosis. To understand the role of
monocyte subsets and other genes affecting monocyte heterogeneity across EVD, we
visualized the transcriptome profiles of just the monocytes in two dimensions using UMAP. The
monocytes separated by DPI and by EBOV infection status, consistent with changing cell states
over the disease course (Figure 5B). At baseline, monocytes separated into 2 distinct clusters,
marked by high expression of CD14 (Figure 5B, bottom half of the blue lobe of DPI panel) or
CD16 (Figure 5B, top half of the blue lobe of DPI panel), consistent with the conventional
subtyping.
However, monocyte subsets changed dramatically during EVD, with the decline of
single-positive CD14+ and CD16+ monocytes, and the corresponding rise of 2 unusual
populations: a large population of CD14- CD16- cells (double negatives [DNs]) and a smaller
population of CD14+ CD16+ cells (double positives [DPs]). To visualize the dynamics of these
populations, we plotted smoothed gene expression of CD14 and CD16 for each EVD stage
(Figure 5C, Materials and Methods). While 87.6% of cells fell into single CD14+ or CD16+
bins at baseline, this dropped to 33.8%, 35.6%, and 15.2% in the early, middle, and late stages
of EVD, respectively. We confirmed a corresponding loss of single-positive CD14+ or CD16+
monocytes and a gain of DNs and DPs at the protein level by CyTOF (Figure 5D). In both RNA
and protein measurements, these two populations began declining on DPI 3.
At late EVD, the most frequent monocyte population was CD14- CD16- DN cells, which rose to
make up 70.4% (by scRNA-Seq) or 56.7% (by CyTOF) of the monocytes. Given that they
expressed neither of the canonical (CD14/CD16) monocyte marker genes, we confirmed that
their overall gene expression profiles were most correlated with single-positive monocyte
populations in late EVD (Pearson correlation R=0.80 CD14+, R=0.58 CD16+) and CD14+
monocytes at baseline (R=0.40), and were less correlated with neutrophils, DCs, and
lymphocytes in late EVD (R=0.28, R=0.39, R=0.14, respectively) (Figure S7A). DNs first
emerged on DPI 3, coinciding with the 2-fold increase in monocytes we observed on that day
(Figure 2D). The DN population is highly proliferative; while 0% of monocytes at baseline
expressed moderate levels of Ki67 (smoothed log TP10K > 1), over 37% of DN monocytes
expressed Ki67 beyond this threshold by late EVD (Figures S7B and S7C). Therefore, this
population underlies the increased monocyte replication rates observed in the middle stage of
EVD (Figure 2G).
To determine if a corresponding increase in DNs occurs in acute EVD in humans, we
re-analyzed published CyTOF data from the 2013–2015 outbreak of 4 acute EVD cases that
were treated at the Emory University Hospital Serious Communicable Diseases Unit (McElroy et
al., 2020) (Materials and Methods). All of the human cases showed a congruent pattern to the
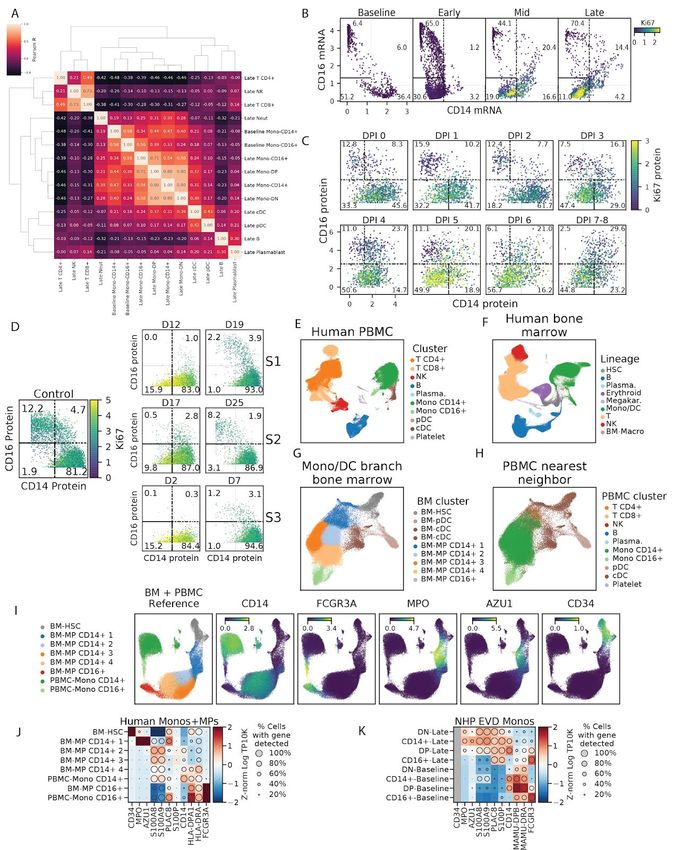
12bioRxiv preprint doi: https://doi.org/10.1101/2020.06.12.148957. this version posted June 14, 2020. The copyright holder for this preprint (which was not certified by peer review) is the author/funder. It is made available under a CC-BY-NC-ND 4.0 International license. NHP data, with loss of conventional CD14+ and CD16+ single-positive monocytes and an emergence of proliferative (Ki67hi) DN monocytes (Figures 5E and S7D). Then, the DNs disappeared and were replaced by the conventional CD14+ and CD16+ single positive monocytes at later days post symptom onset, as the human cases entered the convalescent period. Thus, the emergence of circulating DNs and the loss of conventional circulating monocyte subsets is a feature of human clinical cases as well as our NHP model of lethal EVD. The presence of proliferating DN monocytes was surprising because mature monocytes in circulation are believed to be non-dividing (van Furth et al., 1979). However, infectious and neoplastic diseases produce cytokines such as M-CSF that induce the release of proliferating immature myeloid cells from the bone marrow, a process known as emergency myelopoiesis (Chiba et al., 2018; Cuenca et al., 2015; Sayed et al., 2019). We therefore hypothesized that the DN population may reflect immature myeloid cells released from the bone marrow by emergency myelopoiesis. If DNs represent the product of emergency myelopoiesis, we might expect their gene expression profiles to be more similar to bone marrow resident monocyte precursors than circulating monocytes. To test this, we compared our monocyte populations against a reference scRNASeq dataset of bone marrow monocyte precursors (BM-MPs) from healthy human bone marrow (Hay et al., 2018) and mature monocytes from human PBMCs (Figures S7E–H, Materials and Methods). Notably, the BM-MPs showed lower expression of CD14 and FCGR3A (the human CD16 gene) than mature monocytes, consistent with the diminished expression of these genes in DNs relative to baseline single-positive monocytes in the NHP data (Figure S7I). In addition, the BM-MPs showed higher expression of MPO, AZU1, S100A8, and S100A9 than mature monocytes (Figures S7I and S7J), consistent with the observation that these genes are expressed at higher levels in DNs relative to baseline monocytes (Figure S7K). To formally test whether our monocyte populations were more similar to the mature PBMCs or the BM-MPs, we identified the nearest neighbor of each NHP monocyte in the reference dataset. As expected, DNs from mid and late EVD were significantly more likely to be matched with BM-MPs (32% at mid, 23% late), than single positive CD14+ or CD16+ monocytes, which almost exclusively were assigned to the corresponding circulating monocyte populations in the reference data (
bioRxiv preprint doi: https://doi.org/10.1101/2020.06.12.148957. this version posted June 14, 2020. The copyright holder for this preprint
(which was not certified by peer review) is the author/funder. It is made available under a CC-BY-NC-ND 4.0 International license.
with the fact that CD14 and CD16 were both independently higher in EBOV infected monocytes
than in bystanders (Figure 5A). At the late infection timepoints, 22.1% of DPs were infected
compared to only 1.74% of DNs. Thus, the differential expression of CD14 and CD16 in infected
cells results from increased infection of the DP cells, rather than increased expression of CD14
on classical and CD16 on non-classical monocytes.
We noticed that the differentially expressed genes between infected and bystander monocytes
(Figure 5A, Table S4) and between DP and DN monocytes (Figure S8A, Table S5) , were
enriched for monocyte-to-macrophage differentiation associated genes, including known EBOV
entry factors. It has been previously observed that freshly isolated monocytes are largely
refractory to EBOV infection in cell culture, but that EBOV entry factors are up-regulated during
in vitro macrophage differentiation, allowing increased infection (Martinez et al., 2013). In vivo,
we observed higher levels of macrophage differentiation markers such as NR1H3, ADAMDEC1,
and several cathepsins in infected cells relative to bystanders. Among these genes, the known
EBOV entry factors cathepsin L (CTSL) and B (CTSB) , and GNPTAB (Carette et al., 2011;
Gnirß et al., 2012) were all expressed at significantly higher levels in infected cells than
bystanders (q = 6.7x10⁻⁹, 3.8x10⁻⁷, and 2.1x10⁻³, respectively). By contrast, the cellular receptor
NPC1 was not significantly differentially expressed, suggesting that natural variability in the
mRNA abundance of NPC1 likely does not influence EBOV infectivity within circulating
monocytes in rhesus monkeys.
We suspected that up-regulation of the entry factors CTSL, CTSB, and GNPTAB might be
occurring as part of a general macrophage differentiation program. We tested this hypothesis
using gene sets derived from published bulk RNA-Seq data of primary blood monocytes before
and after differentiation into macrophages, in vitro (Dong et al., 2013) (Table S4). We found that
genes that are up-regulated during in vitro differentiation were significantly enriched in infected
cells (OR = 3.5, p = 3.1x10⁻¹¹, Fisher's exact test) and genes that were down-regulated during
differentiation were significantly enriched in bystanders (OR = 3.7, p = 4.2x10⁻⁸, Fisher's exact
test; combined chi-squared goodness of fit test p = 2.2x10⁻³⁰). Using gene set annotations from
two other RNA-Seq studies of macrophage in vitro differentiation resulted in similar findings
(chi-squared goodness of fit test p = 2.6x10⁻⁹ (Saeed et al., 2014), Fisher's exact test p =
5.7x10⁻¹² (Italiani et al., 2014)). Genes associated with differentiation into M2-polarized
macrophages were more enriched among EBOV-infected cells than those of M1-polarized
macrophages (OR = 7.8, p = 1.3x10⁻¹⁰ compared to OR = 3.3, p = 1.6x10⁻³ (Italiani et al., 2014),
Table S4).
Next, we quantified the proportion of infected cells as a function of macrophage-differentiation,
and found that infectivity increased along with expression of the macrophage differentiation
program. To determine the relative activity of the macrophage program in each cell, we
computed a “macrophage differentiation score” consisting of a weighted sum of the 618 genes
that were significantly positively or negatively correlated with in vitro differentiation in the (Dong
et al., 2013) dataset (Materials and Methods). Ranking cells from lowest to highest
macrophage score, we observed that the percentage of infected cells rose more than four-fold
14bioRxiv preprint doi: https://doi.org/10.1101/2020.06.12.148957. this version posted June 14, 2020. The copyright holder for this preprint
(which was not certified by peer review) is the author/funder. It is made available under a CC-BY-NC-ND 4.0 International license.
from 3.0% to 15.0% (Figure 5H). Thus, our data strongly suggests that of all circulating cells,
EBOV predominantly infects monocytes with the highest expression of the macrophage
differentiation program.
Given that macrophage differentiation genes were over-expressed in DPs relative to DNs
(Figure S8A), we sought to understand the relationship between the CD14 and CD16 defined
monocyte subsets and expression of the macrophage differentiation program. Comparing the
overall macrophage score of the different CD14/CD16-marked subpopulations confirmed that
DPs generally had the highest macrophage scores while DNs and single CD14+ cells had the
lowest (Figure S8B). Thus, some of the enrichment of infected cells among the DP subset could
potentially be attributed to their more ‘macrophage-like’ gene expression.
However, there was substantial heterogeneity in macrophage scores within DPs and the other
CD14/CD16-marked subsets, and we found that macrophage score and CD14/CD16 subset
were independently predictive of infectivity. To demonstrate this, we stratified cells in each
subset by macrophage score (above or below the median value across all subsets combined).
This showed that less macrophage-like DPs were still more likely to be infected than more
macrophage-like DNs, even though all cells in the former category had a lower macrophage
score than all cells in the latter (p =1.9x10⁻²⁵, Fisher’s exact Test, Figure S8C). However, within
the DPs, more macrophage-like cells were more likely to be infected than less macrophage-like
0.0003, Fisher’s exact Test, Figure S8C). This suggests that infection could not be
cells (p =
explained by either CD14/CD16 subset or macrophage score alone. As a further confirmation,
we fit a logistic regression predicting the infection status of each cell using macrophage score,
smoothed CD14 and CD16 expression values, and a CD14xCD16 interaction term (Materials
and Methods). As expected, the CD14xCD16 interaction term (which is highest in DPs) and
macrophage score were positively associated with infection status, and the CD14 and CD16
terms were negatively associated (p < 0.01 for all coefficients). These findings demonstrate that
monocyte CD14/CD16 subset and differentiation status independently impact the probability of
a cell being infected with EBOV, in vivo.
Interferon stimulated genes are down-regulated in infected monocytes relative to bystanders
Finally, we noticed that several key ISGs such as MX1 were expressed at lower levels in
infected cells than in bystanders (MAST q = 7.7x10⁻¹⁴, rank-sum test p = 2.0x10⁻⁵, Figures 5A
and 5I). To determine if infection had a suppressive effect on overall ISG expression, we
compared the magnitude of the interferon response (defined previously as the ISG score,
Materials and Methods) between infected and bystander cells at late EVD. While both
bystander and infected monocytes at late EVD had higher ISG scores than monocytes at
baseline, ISG scores were lower in infected cells than bystanders (not statistically significant by
rank-sum test, Figure S8D). More strikingly, there was a significant negative correlation
between ISG score and the percentage of cellular transcripts derived from EBOV (i.e., the
intracellular viral load) (Spearman ρ = -0.62, p = 1.1x10⁻¹¹, Figure 5J). This suggests that ISGs
are down-regulated during viral replication within infected cells (see Figure 7 and Discussion).
15bioRxiv preprint doi: https://doi.org/10.1101/2020.06.12.148957. this version posted June 14, 2020. The copyright holder for this preprint
(which was not certified by peer review) is the author/funder. It is made available under a CC-BY-NC-ND 4.0 International license.
Single-cell transcriptomics of ex vivo infected PBMCs reveals temporal dynamics
in viral gene expression
In order to more thoroughly probe viral and host gene expression changes during the viral life
cycle, we sought to obtain transcriptomes from a greater number of infected cells. Thus, we
isolated PBMCs from 2 healthy rhesus monkeys (NHP1 and NHP2) and inoculated them ex vivo
with either live EBOV, EBOV rendered replication-incompetent by gamma irradiation (Feldmann
et al., 2019), or media only as a control (Figure 6A). We selected a multiplicity of infection (MOI)
of 0.1 plaque forming units (pfu, titrated on Vero E6 cells)/cell to ensure that a large proportion
of cells would be infected. We performed scRNA-Seq using Seq-Well at 4 hours or 24 hours
post-infection (HPI), corresponding to very early (start of viral transcription) and middle-to-late
stages (viral genome replication, virion assembly) of the viral life cycle. Inoculation with
gamma-irradiated EBOV allowed us to characterize the host response in the absence of
effective viral transcription and translation.
We obtained single-cell transcriptomes from 50,646 PBMCs inoculated ex vivo, and observed
similar cell-type representation, clustering by treatment condition, and distribution of
EBOV-infected cells as with the in vivo collections (Figures S9A–S9C), with a few notable
exceptions. First, we observed that cells from NHP1 and NHP2 separated in UMAP embeddings
(Figure S9D) and that this separation was associated with higher expression of ISGs such as
MX1 in cells derived from NHP1 compared to NHP2 (Figures S9E and S9F). The ISG signal
was most predominant in cells from NHP1 at 24 HPI treated with either irradiated or live virus
(Figure S9G). We therefore analyzed cells from each animal both separately and jointly to avoid
potential artifacts. A second difference is that while we did not observe infected DCs in vivo, we
found that 16% of DCs (16.0% in NHP1, 15.7% in NHP2) inoculated with live virus ex vivo were
infected by 24 HPI (Figure S9H). This difference could be due to increased density of cells in
culture, the higher effective MOI we used in the ex vivo experiment, or even changes to the
expression states of DCs associated with culture conditions.
Consistent with the in vivo data, monocytes were the predominant infected cell type, with over
65% infected by 24 HPI after inoculation with live virus (76% in NHP1, 61% in NHP2) (Figures
S9H and S9I). 11.8% of the monocytes treated with irradiated virus also contained a statistically
significant number of viral reads by 24 HPI, despite the fact that gamma irradiation induces
damage to the viral genome that eliminates productive viral replication (Feldmann et al., 2019).
As expected, cells treated with irradiated virus had a significantly lower fraction of EBOV reads
per cell than those treated with live virus (Figure S10A). Moreover, viral RNAs from the cells
treated with irradiated virus were substantially less likely to be coding-sense mRNA transcripts
than anti-sense viral genomic RNA. For live-virus treated cells, 78% and 92% of detected RNAs
were mRNA at 4 and 24 HPI, compared to only 37% and 44% in cells treated with irradiated
virus (Figure S10B). This suggests that our method can detect fragments of viral genomic RNA
from irradiated virus that have entered cells, but as expected, these do not reflect productive
infections and do not generate significant quantities of poly-adenylated mRNAs.
16bioRxiv preprint doi: https://doi.org/10.1101/2020.06.12.148957. this version posted June 14, 2020. The copyright holder for this preprint
(which was not certified by peer review) is the author/funder. It is made available under a CC-BY-NC-ND 4.0 International license.
Exploiting the increased resolution of the ex vivo dataset, we characterized the heterogeneity in
viral transcript abundance per cell (i.e., the intracellular viral load). We observed that the
intracellular viral load varies over several orders of magnitude in infected cells, both in vivo and
ex vivo (Figures 6B and 6C). While most cells harbored viral loads below 0.1%, a substantial
minority had loads of >10%, with maximum detected loads of 57.5% and 52.3% for cells in vivo
and ex vivo respectively. The observed heterogeneity in viral load was not due to different
numbers of transcripts detected per cell, because cells with low and high viral load had a similar
range of total transcripts detected (Figures S10C and S10D).
We next analyzed the dynamics of EBOV gene expression to determine if it matched the
predicted pattern based on established models of EBOV transcription. Transcription of EBOV's
7 genes by the viral RNA-directed RNA polymerase L follows the canonical stop-start
mechanism described for filoviruses and other non-segmented negative-strand RNA viruses
e novo (Deflubé et al., 2019) at the 3’
(Brauburger et al., 2014, 2016). L initiates transcription d
end of the genome, and processes from 5’ to 3’; at each gene transcription termination signal, L
pauses and either falls off the genomic RNA template or reinitiates transcription of a new mRNA
for the subsequent gene (Figure 6D, (Mühlberger, 2007)). As a consequence, NP is the first
gene to be transcribed and is transcribed at the highest level, proceeding down the genome to
the polymerase gene L being transcribed last and at the lowest level.
When we quantified the relative expression levels of EBOV genes as a function of viral load, we
observed an unexpected accumulation of GP mRNA (Figures 6E and 6F) that was consistent
between NHP1 and NHP2 (Figures S10E and S10F). At low viral loads, both in vivo and ex
vivo, the gene expression distribution roughly matched the expected pattern, with most of the
transcripts derived from the 3’ end of the genome, in particular NP, and the fewest transcripts
derived from the 5’ genes VP30, VP24, and L. In agreement with this pattern, cells inoculated
with irradiated virus, which has impaired transcription due to RNA cleavage or crosslinking
(Feng et al., 2011; Ginoza, 1967; Ward, 1980), were highly enriched in NP mRNA (Figure
S10B), suggestive of RNA fragment transcription. However, as viral load increased in cells
infected with live EBOV, GP was the most highly expressed viral transcript. This finding is
unexpected based on the start-stop mechanism where NP should be transcribed at a strictly
higher rate than GP. This observation suggests a life-cycle dependent regulation of viral gene
expression that has not previously been observed for EBOV (see Discussion).
EBOV infection down-regulates host antiviral genes and up-regulates putative
pro-viral genes
Next, we exploited natural variability in viral load across infected cells to identify host gene
expression changes correlated with viral replication, which may therefore represent pathways
directly regulated by infection. Instead of testing for differential expression between infected and
bystander cells as we did previously to define tropism-associated genes, we looked for
continuous association between viral abundance and host transcript levels in infected
17You can also read