CFA Institute Research Challenge - CFA Society Italy
←
→
Page content transcription
If your browser does not render page correctly, please read the page content below
CFA Institute Research Challenge
                                                             Hosted by
                                                    CFA Society Italy
                                             Università Carlo Cattaneo - LIUC
                                                Politecnico di Milano

The CFA Institute Research Challenge is a global competition that tests the equity research and valuation,
investment report writing, and presentation skills of university students. The following report was prepared
in compliance with the Official Rules of the CFA Institute Research Challenge, is submitted by a team of
university students as part of this annual educational initiative and should not be considered a professional
report.

Disclosures:
Ownership and material conflicts of interest:
The author(s), or a member of their household, of this report does not hold a financial interest in the securities of this company.
The author(s), or a member of their household, of this report does not know of the existence of any conflicts of interest that might
bias the content or publication of this report.
Receipt of compensation:
Compensation of the author(s) of this report is not based on investment banking revenue.
Position as a officer or director:
The author(s), or a member of their household, does not serve as an officer, director or advisory board member of the subject
company.
Market making:
The author(s) does not act as a market maker in the subject company’s securities.
Disclaimer:
The information set forth herein has been obtained or derived from sources generally available to the public and believed by the
author(s) to be reliable, but the author(s) does not make any representation or warranty, express or implied, as to its accuracy or
completeness. The information is not intended to be used as the basis of any investment decisions by any person or entity. This
information does not constitute investment advice, nor is it an offer or a solicitation of an offer to buy or sell any security. This report
should not be considered to be a recommendation by any individual affiliated with CFA Society Italy, CFA Institute or the CFA
Institute Research Challenge with regard to this company’s stock.
Equity Research

Ferrari N.V.
Initiation of Coverage

February 16, 2019

The Pole Position Company
What’s it all about?
We initiated the coverage on Ferrari with a Buy rating and a Target Price of €172.       Team Draghi
Ferrari has always been one of the most recognized Italian luxury brand in the
world, associated with power, speed, design, style, beauty and success. Founded by
Enzo Ferrari in 1947 in Maranello, it produces top tier sports and racing cars. The      Buy
competition segment originated in 1929, when Enzo Ferrari founded the Scuderia
Ferrari in Modena that has been involved in Formula 1 since the first edition.           Target Price                          €172
Moreover, Scuderia Ferrari holds the record in the Formula 1 World Championship          Current Price*                        €154
Title. Thanks to manifold characteristics, namely (i) the strengths of the brand, (ii)   Upside                                +11%
the resilience of its cash flows and revenues, (iii) its unique client base, (iv) its
significant profitability and last but not least (v) its “vale upon volume” strategic
approach, Ferrari is set to achieve compelling results in the foreseeable future. We
believe that Ferrari currently trades at a discount to its fair value, which makes the
manufacturing company an attractive long-term investment, even with the ongoing          * The current price refers to the closing price on
                                                                                         January 30, 2020. This is indeed the reference date
dramatic changes that are affecting both the luxury and the automotive industries.       of the overall Report
Buy | €172
Equity Research
Upside | +11%
Ferrari in 1 Minute
Italy | Auto Manufacturer | MCAP €29,267
Investment Summary
Ferrari, An Exclusivity Heritage Manufacturer Market Data
We issue a Buy recommendation on Ferrari N.V. (RACE.MI) based on a 1-year
Bloomberg: RACE:IM Reuters: RACE.MI
target price of €172.03. The latter offers a +11.42% upside from the company
closing price of €154.4 on January 30, 2020. The latter is indeed the reference Market Cap (€ B) 29.26
date of the overall Report.
Shares Out (MM) 249
Outstanding valuation: expectations already beyond guidance Free Float 66%
We are confident that Ferrari’s stock will have a significant and consistent upside Avg. Daily Volume 6M 470,435
thanks to manifold characteristics. First of all, the premium valuation of the
company is guaranteed by the strength of the brand, the pricing power, and the YTD 76.77%
resilience of its cash flows and revenues. The demand for Ferrari’s cars is clearly 52 Weeks Low/High (€) 84.08 / 156.35
ahead of the offer, and, in fact, all cars are sold on a waiting list basis. This allows
the Company to maintain a complete visibility on the cash flows and profits that Beta (5Y - Monthly) 0.71
will be generated in the following months, and, consequently, Ferrari is perceived Current stock price 154,4 €
by investors as a consistent defensive security. Moreover, we believe that the
Source: Reuters & Bloomberg. Current stock price on Jan 30, 2020
targets defined in the Strategic Plan for 2020 are achievable beyond their own
bar: this mirrors how the company's approach is indeed conservative from this
FY to 31/12 (€) 2016 2017 2018
point of view, eventually leaving room for a further appreciation of the security.
Sales (MM) 3105.1 3416.9 3420.3
Signature mix: 360 degrees of the most exquisite luxury experience
EBITDA Adj (MM) 946.1 1013.9 1110.3
We forecast that in the next few years Ferrari will increase its production volume:
the latter comes from the building block that the Company is willing to (i) focus on EBIT Adj (MM) 698.4 753.3 821.5
the loyalty of current customers by meeting their ever growing demand, and (i) the
Net Income (MM) 567.4 746.2 802.9
desire to expand the customer base via entry level models. Furthermore, the spike
in the price/mix and the penetration of the hybrid support a higher profitability as Enterprise Value 14,957 22,620 22,350
well. Specifically, we expect a 2023 EBITDA of €2.19Bn, i.e. 40.4% 2023F EBITDA
EV/EBITDA 15.81 22.31x 20.13x
Margin. Eventually, our estimates made on the EBITDA for 2022 exceed Ferrari’s
expectations and targets. On the flip of the coin, the non-car business will be EV/EBIT 21.42x 30.03x 27.2x
renovated: half of the existing contracts will be substituted by new initiatives with
P/E 30.54x 32.43x 22.68x
exclusive luxury products and services (such as Ferrari’s partnership with Giorgio
Armani and Massimo Bottura), which will significantly contribute to the brand EPS 2.16 3.25 4.16
extension, name recognition and client’s loyalty.
Source: Reuters & Team computations
Every car on road will be Electri… fying
Even though Ferrari’s business is a Capital Intensive one and it is therefore Ferrari N.V. vs FTSE MIB (Rebased)
encountering restrictions in terms of emissions and environmental regulations, the
Company has indeed shown compelling Environmental, Social and Governance 400
350
parameters. The latter significantly reduces the specific risk of the Company 300
250
among institutional investors and have consequently a positive impact on Ferrari’s 200
150
risk premium. The expectation is therefore that these stringent parameters will 100
50
have a positive future impact in terms of market valuation, even without a mid term 0
gen-16
mag-16
lug-16
set-16
gen-17
mag-17
lug-17
set-17
gen-18
mag-18
lug-18
set-18
gen-19
mag-19
lug-19
set-19
gen-20
mar-16
nov-16
mar-17
nov-17
mar-18
nov-18
mar-19
nov-19
goal of full electric powertrains like other peers in the automotive industry.
Ferrari FTSE MIB
Note that all Ferrari’s Market Values are computed using the number of shared diluted calculated “using the diluted number of 2
shares on June 30, 2018 assuming no further shares buyback”, as reported in Ferraris’ company presentation investor meetings
December 2019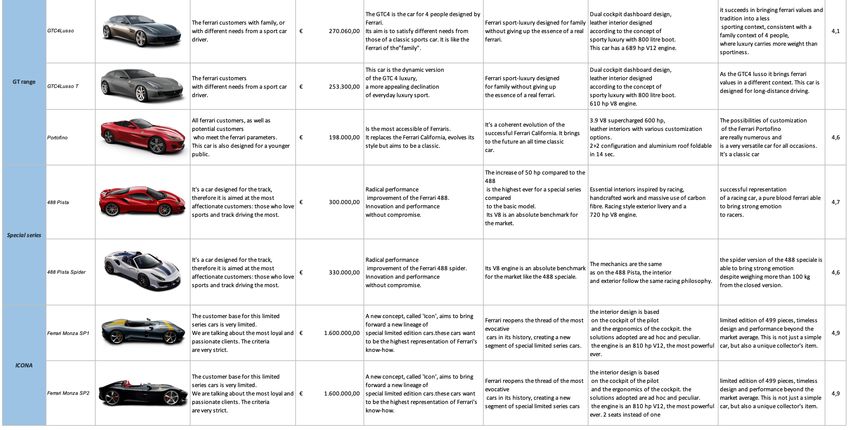
Buy | €172
                    Equity Research
                                                                     Upside | +11%

Contents
Investment Summary                                              2
Business Description                                            6
The Company Overview of a Leading Luxury Brand                  6
Throughout History of Successes                                 6
The Luxury Car Product Range                                    6
Company Strategy to Generate Value: no Edges nor Limits         6
Production Process Overview                                     7
From Production to Sales                                        7
Formula 1 Activities                                            8
Outstanding Properties to Complement Ferrari’s Portfolio        8
SWOT Analysis: Failure Never an Option                          9

Industry Overview & Outlook                                     9
The Overall Automotive Industry Future Trends                   9
A Cutting Edge “Eascy” of Mobility                              9
Technological Widespread | From Hardware to Software            10
Electric Vehicles | Regulatory Volatility & Customer Demand     10
The shift toward EVs | Ferrari leading the R&D per Sales race   10
High Luxury Car Outlook                                         11
Automakers Bypassing Cars for Muscles                           11
Trade Impact                                                    11
FX Exposure                                                     12
Potential Porsche IPO & Lamborghini Spin-Off                    12

Environmental, Social & Governance                              13
The Board of Directors                                          13
Shareholder Composition                                         13
A Strong Management in Pole Position                            13
The Code of Conduct                                             14
Ferrari’s People                                                14
Sustainability for a Better Future                              14

Financial Analysis                                              15
Historical Perspective: a Company that Never Settles            15
The boolean relationship between pricing-mix and volume
growth: will Ferrari truly become a luxury brand?               15
What’s in for Ferrari in the new Maserati and F1 agreements?    17
Ferrari’s spearhead: Research & Development                     19
Capital Expenditures                                            20
Renegotiations & changes in the debt structure                  20
The asset evolution in response to growth                       20

                                                                            3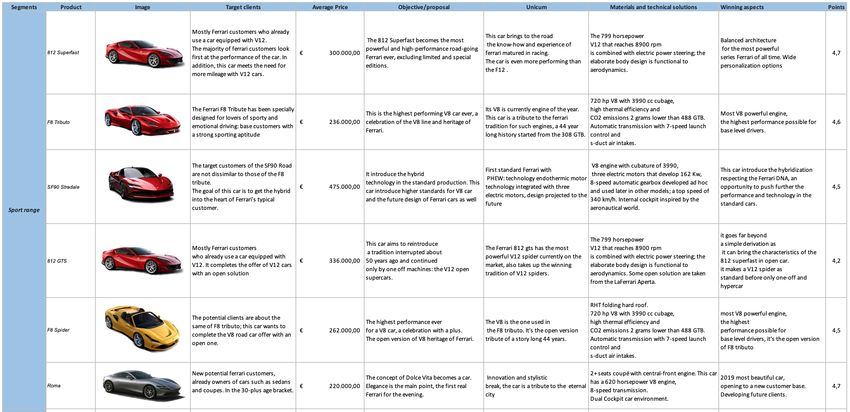
Buy | €172
                      Equity Research
                                                                    Upside | +11%

Liabilities & equity changes: new independent ways             21
Working Capital                                                21
An enviable EBITDA trend                                       21

Discounted Cash Flow                                           22
Why you should ramp up the Ferrari’s stake in your portfolio   22
Weighted Average Cost of Capital                               23
Cost of Equity                                                 23
Risk Free                                                      24
Cost of Debt                                                   24
Terminal Value                                                 25
Stress Test: Scenario Analysis                                 26

Relative Valuation                                             27
Value Map Method                                               27
Multiples Valuation                                            27
Bags vs Cars: two sides of the same coin?                      28
Price Earnings                                                 29
Stressed Scenario                                              30

Risk Assessment                                                31
Strategic: increasing expenses in R&D due to budget
constraints in F1 Championship                                 31
Strategic & Reputational                                       31
Strategic & Compliance                                         31
Operational                                                    32
Financial                                                      32
Wuhan Coronavirus (2019-nCoV)                                  33

Appendix 1                                                     34
Ferrari’s valuable car product portfolio                       34
Appendix 2                                                     35
Ownership Composition                                          35
Appendix 3                                                     36
Porter’s Five Forces Analysis                                  36
Appendix 4                                                     39
Ferrari’s Personalization Program                              39
Appendix 5                                                     41
Ferrari’s Share Price & Management Changes                     41
Appendix 6                                                     41
Properties & Plants                                            41
Appendix 7                                                     42
Analyst Estimates & Historical Recommendations                 42
Appendix 8                                                     43
Implied One Day Price % Move                                   43          4
Buy | €172
                    Equity Research
                                                           Upside | +11%

Appendix 9                                            45
Board of Directors Composition                        45
Appendix 10                                           46
Corporate Governance Evaluation                       46
Appendix 11                                           48
Risk Assessment                                       48
Appendix 12                                           49
Ansoff's Matrix                                       49
Appendix 13                                           49
Ferrari’s Web Researches Impact Analysis              49
Appendix 14                                           50
Altman Z-score Analysis                               50
Appendix 15                                           51
Beneish's M Score Analysis                            51
Appendix 16                                           52
Master Design Management Process Flow in Ferrari NV   52
Appendix 17                                           53
Ferrari Cash Flow Generation and Projections          53
Appendix 18                                           55
Peers Breakdown: is Ferrari really homogeneous with
anything among car manufacturers?                     55
Appendix 19                                           57
Luxury Peers Breakdown: where does the Maranello
company stand among luxury brands?                    57
Appendix 20                                           58
Eventually, is Ferrari conceivable among luxury
or automotive peers? An empiric approach              58
Appendix 21                                           59
Eventually, is Ferrari conceivable among luxury
or automotive peers? A graphical approach             59
Appendix 22                                           61
Montecarlo Simulation                                 61
Appendix 23                                           62
Profitability & Margins Breakdown                     62
Appendix 24                                           63
Key Indicators Breakdown                              63
Appendix 25                                           64
Income Statement                                      64
Appendix 26                                           65
Balance Sheet                                         65
Appendix 27                                           66
Cash Flow Statement                                   66
Appendix 28                                           67          5
Discounted Cash Flow Computation                      67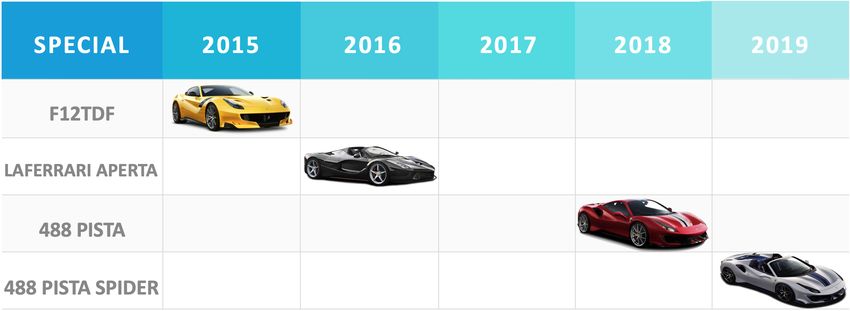
Buy | €172
                          Equity Research
                                                                                                                                Upside | +11%

Business Description
The Company Overview of a Leading Luxury Brand                                               Regional Markets - Unit Shipment (Exhibit 1)
Ferrari N.V. was officially founded in 1947 when the first racing car produced by
Enzo Ferrari was released from the iconic Maranello factory. The company is now
one of the world's leading luxury brand for designing, developing, manufacturing
and selling state-of-the-art sports car. Ferrari offers warranty programs, financial
supports, maintenance services, watches, apparels, earphones, caps, and other
accessories as well. The company has extended its presence in over 62 markets
through 167 dealers, spread across EMEA (Europe, Middle-East & Africa), Americas,
APAC (Asia Pacific) and China (Exhibit 1). Ferrari has a significant track of successes,
with its spearhead registered in 2019 when the Company sold 10,131 vehicles with
revenues of €3,766 MM.

Throughout History of Successes
Ferrari is named after Enzo Ferrari, a driver that founded his own racing team in
1924 and officially set up the company in 1939. The first racing car was produced in
1947 and, one year later, the first road one came into market. Thereafter, Ferrari           Source: Ferrari 2018 Annual Report (Team representation of vehicle

started its competition in Formula 1 (1950) and in 30 years-time debuted within the          sold in ground number and percentages)

GT segment, with a V8 engine and eventually with the F40, the first supercar ever
released. Fiat S.p.A. (now listed under FCA, Fiat Chrysler Automobiles) acquired              Historical Milestones (Exhibit 2)

half of Ferrari S.p.A. ownership in 1969 and the stake became 90% in 1988 after the
death of Ferrari’s founder, leaving to his son Piero the remaining 10%. Another
milestone of the Company’s history was the launch of the Ferrari Enzo supercar in
2002, the significant renewal of the GT Space in 2008 and the launch of LaFerrari in
2013, when Ferrari was named as the world’s most powerful brand by Brand
Finance (the world’s leading independent brand valuation and strategy
consultancy). Two years later, Ferrari, officially separated from FCA and successfully
                                                                                              Source: Ferrari 2018 Annual Report (Team representation)
completed its IPO on the NYSE (New York Stock Exchange) which was then spin-off
on the Mercato Telematico Azionario in 2016 (MTA, stock exchange managed by
Borsa Italiana S.p.A., part of London Stock Exchange Group).                                  Product Range Actual vs Forecast (Exhibit 3)

The Luxury Car Product Range
The road-car product offer of Ferrari is fourfold (Exhibit 3): the Sports range (with
the 488 GTB, 488 Spider, 812 Superfast), the GT range (with the Ferrari Portofino,
GTC4Lusso T, GTC4Lusso, Ferrari J50 and SP38), Special Series (with the 488 Pista
and 488 Pista Spider) and Icona. The latter are able to serve a variety of clients with
a throughout offer comprising enhanced technologies, personalized designs and
state-of-the-art performances. Moreover, the competitive advantage of Ferrari is
also given by a significant residual value, which eventually translates into both client
loyalty and recurrent purchases.

Company Strategy to Generate Value: no Edges nor Limits                                       Source: Ferrari 2018 Annual Report (Team representation)

Principles for Growth: Ferrari aims to enrich its product portfolio to target an-ever
                                                                                             Company Strategy (Exhibit 4)
increasing customer base. Nonetheless, this is not at the expense of mass-
production as the Company’s efforts to maintain exclusivity and scarcity are
mirrored by a low-volume production strategy. The actual principles to foster the
strategy comprehends three main pillars (Exhibit 4): (i) performance, where the
Company strives to always be the best performing car in its segment, (ii) comfort &
versatility, i.e. the ease of driving experience and the board interface and (iii) the so-
called driving emotions, with the car sound, acceleration and responsiveness.

Innovation: Ferrari aims to ensure innovation by leveraging: (i) its Formula 1 know-
how, (ii) its powertrain and aerodynamic first-mover technologies and (iii) multiple
and ever-growing synergies (namely brand image, marketing, visibility and
technology transferred to all cars). To conclude, Ferrari aims to maintain and invest         Source: Ferrari 2018 Annual Report (Team representation)
in its combustion engine technologies for the near future, but also drive towards
                                                                                                                                               6
hybrid powertrain to improve performances, satisfy costumer preferences and meet
emission regulatory requirements.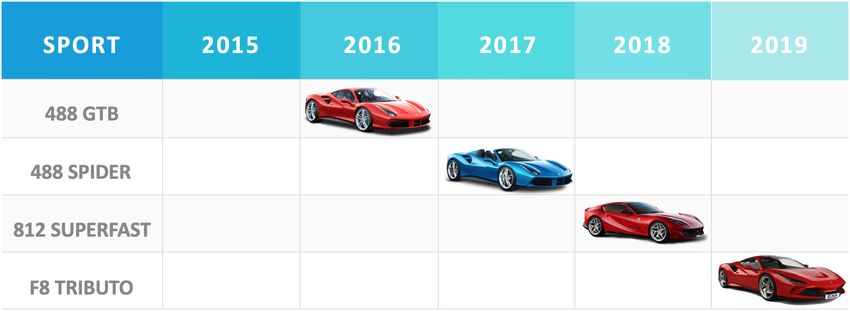
Buy | €172
                          Equity Research
                                                                                                                                 Upside | +11%

Mid-Term Strategy: Ferrari’s mid-term strategy is based on four building blocks:              Range Models: Latest Releases (Exhibit 5)
I. Organic controlled growth, in terms of both turnover and margins, but
     maintaining exclusivity. Namely, you can’t buy top tier Ferrari if you’re not a loyal
     client as you need to be entitled which eventually allows Ferrari not to chase
     growth like others, but to control it.
II. Ever-increasing industrial research and launch of new car models (including
     hybrids). Ferrari aims to launch 15 models across different segments between
     2019 and 2022, with the goal of achieving 60% of hybrid mix in 2022 and a
     significant increase in the average retail price. Ferrari’s has no plan to change its
     actual sales strategy (while maintaining a certain level of flexibility), which
     comprehends a network of authorized dealers (that is free to negotiate the
     price) without own dealership. The Company will target an ever-growing
     number of HNWI (High Net Worth Individual), but still preserving its exclusivity.
III. Steady pursuit toward excellence in the road and racing sector. The focus of
     Ferrari is going to be on (i) human-machine interface, with new steering wheels,
     head-up display and infotainment systems to enhance the passenger’s
     experience and (ii) autonomous driving, which will have a fundamental impact
     on the electronic architecture of Ferrari’s car. Nonetheless, Ferrari has currently
     no plan to develop a full self-driving car, as it is in contrast with the Company
     experience concept to sell emotions, not mere vehicles.
IV. Development of adjoining products’ sales in the context of Ferrari’s brand within
     the luxury sector. Ferrari aims to strengthen its brand identity through: (i) Ferrari    Source: Ferrari Company Presentation (Team representation)
     DNA, a refined collection of Made-in-Italy products with a dedicated team and
     exclusive partnership (e.g. Giorgio Armani). (ii) Ferrari “Tifosi” Entertainment, i.e.
     increased competition in Ferrari E-games, development of events and Ferrari’s
     museum (like Ferrari Theme Park) and last but not least (iii) car adjacencies for
                                                                                              Luxury Manufacturer Car Sales (Exhibit 6)
     Ferrari car owners, with exclusive luxury products to complement the client
     experience (like the launch of Ferrari’s Restaurant in 2020, with Michelin-Starred
     Chef Massimo Bottura). Ferrari's ultimate goal is to bring sales of Ferrari Brand
     products to weigh at least 10% of the total turnover over the next 7-10 years.

Production Process Overview
Although the limited number of vehicles produced (respectively 9,251 and 1,0131
in 2018 and 2019), Ferrari’s supply chain is significantly complex, with a
manufacturing process that requires over 40,000 products from 750 suppliers. The
plants were renovated between 2002 and 2012, with an estimated useful life of 20
years. Nonetheless, given the hybridization focus and the goal of enriching the
product range, the Company is planning significant further investments in Plants,             Source: CarSalesBase Dataset (Team representation). Luxury Car Index

Machinery & Equipments. Unlike many low-volume peers, Ferrari operates its own                refers to the total sum of sales of Aston Martin, Lamborghini, McLaren,
                                                                                              Rolls Royce, Porsche, Audi and Mercedes (vehicles worth more than
foundry for the production of several engine components which takes multiple                  €150,000)

steps: (i) body assembly, (ii) painting, (iii) assembly line, (iv) personalization and
road tests, (v) finishing and cleaning. Notably enough, Ferrari had still a relationship
with the Maserati’s brand. In fact, the former has been producing Maserati’s engine           Luxury Manufacturer Car % Change (Exhibit 7)
since 2003, which in 2018 counted for 900 V8 turbo engines and 1500 V8 aspirated
engines. This contract will potentially come to an end between 2021 and 2022 as
stated by Ferrari itself, releasing the know-how and work force for the own Ferrari
production.

From Production to Sales
As conceivable from Exhibit 6, Ferrari’s sales have regularly grown toward the last
two decades, mirroring a consistent and resilient business. The building blocks of (i)
maintaining low volumes compared to demand, (ii) have a significant variety of
product choices for clients and eventually (iii) launch a greater number of releases
compared to the homogeneous peers, have proven to be successful. In fact,
                                                                                              Source: CarSalesBase Dataset (Team representation)
Ferrari’s sales volatility has been less significant than the competitors’ one, fairly
reacting to multiple shocks (Exhibit 7). Moreover, as discussed below, Ferrari’s effort
                                                                                                                                                7
to be always on top of the market have guaranteed an assured customer based,
with both value preservation and secondary market opportunities.
Buy | €172
                          Equity Research
                                                                                                                                    Upside | +11%

Formula 1 Activities                                                                        Ferrari Revenues Mix 2019 vs 2018 (Exhibit 8)
Ferrari’s brand and history is closely related to its Formula 1 Racing Team, Scuderia
Ferrari, which represents the second revenue source of the company. The latter is
currently the most successful Formula 1 Team in history with 238 Grand Prix wins, 16
Constructor World titles and 15 Drivers’ World titles. Participating in Formula 1 is
not only a marketing effort: in fact, it represents an endless source of technological
and engineering innovations, which eventually creates synergies between the
Formula racing and the road cars. On top of Ferrari’s long-term Research &
Development (R&D) efforts, Formula 1 strict FIA rules force the manufacturer to
improve the technologies at the building block of its engines and cars. Therefore,
                                                                                            Source: Reuters (Team representation)
this creates a virtuous cycle of technological and know-how transfer, from cutting-
edge development for racing cars to road ones. Notably, the F1 contract has been
                                                                                            Capture Retail Value Opportunity (Exhibit 9)
revised, coming into force in 2021, heading towards more homogeneous prize
distribution amongst the F1 team and a for the first time ever will have an impact as
per financial rules. Eventually, Formula 1 allows Ferrari to promote its brand and
technology to a global audience without relying on plain-vanilla advertising
activities, and it is eventually fundamental to Ferrari’s effort to capture more retail
value and have the ancillary sources as a 10% of overall profitability in seven years.

Outstanding Properties to Complement Ferrari’s Portfolio
Ferrari has multiple intellectual properties, aimed to protect its brand reputation
through the years, and physical ones. An ever-increasing number of registered               Source: Ferrari 2019 Presentation (Team representation)

designs and utility patent is owned by the Company, including 485 word and
figurative trademarks, with a particular level of protection given by 4,000                 Capture Retail Value Opportunity (Exhibit 10)
applications in 140 countries for the ones presented in Exhibit 12. Moreover, the
physical properties include the Maranello factory (entirely renovated between 2002
and 2012), the new Ferrari Design Centre (completed in 2018), the Mugello Racing
Circuit, the Carrozzeria Scaglietti plant and two Museums with a total carrying value
of property, plant and equipment of €850,550 thousand in 2018 EoY. Notably,
these Museums (along with ongoing projects like the new signed Restaurant with              Source: Ferrari 2018 Annual Report (Team representation)

Massimo Bottura), contribute significantly to the brand extension of Ferrari for the
previously-exposed 10% of ancillary revenues sources.
                                                                                             SWOT Radar Chart (Exhibit 11)
SWOT Analysis: Failure Never an Option
Ferrari has key strengths that has always fostered to achieve the compelling market
position and brand recognition it owns right now. This, merged with the capability
of embracing cutting-edge opportunities, makes the car maker one of its kind in
this luxury auto industry. Nonetheless, there are inevitably sources of weaknesses
and threats, but still it is Ferrari’s ability to manage the latter that makes this brand
unique.

Strengths:
Starting from the key strengths, the Company may count on: (i) a powerful and
valuable brand, coming from Formula 1 successes as well, which attracts a solid
customer base of HNWI, that receives an incomparable treatment (ii) an ever-
growing offer of products, tailored to the clients’ needs and preferences, (iii) a
strong value chain that is controlled end-to-end via in-house design, engineering
and production, (iv) a long-lasting value of vehicles over time, (v) high entry barriers
which will be further discussed later on, and eventually (vi) an extremely valuable
and diversified human capital.

Weaknesses:
Ferrari’s main weaknesses are instead its FX (Foreign Exchange) risk which dent the
revenues in different currencies and the clients’ buying propensity, along with a
production concentration in Maranello (Italy).
                                                                                                                                                8
Buy | €172
                                     Equity Research
                                                                                                                                  Upside | +11%

Opportunities:
Regarding the Company’s opportunities, they mainly derive from the industry
trends (that will be discussed in the next chapter) and clients’ preferences. (i) Firstly,
Ferrari can exploit the ever-growing demand for personalized vehicles, with
multiple programs that add customizable experiences to the clients. Moreover, (ii)
the Company, given its significant R&D strengths, may win the race for the most
powerful, adaptable and customer-enjoyable EV (Electric Vehicles), which
according to Ferrari’s CEO may become a reality in 2023. This gives to the
Company the possibility to target different markets and reach multiple clients of
disparate preferences, eventually increasing its volume produced and sold. Last but
not least, (iii) the Company could increase its M&A propensity given the reduced
leverage, still the management expressed no public interest in doing so.

Threaths:
To conclude with the threats, Ferrari encounters a period of both external and
internal pressures. The Maranello brand has to face the commercial U.S.-China
trade war and the new Chinese Coronavirus, which could impact the sales in
multiple countries in the short/mid run. Moreover, Ferrari is facing ever-growing
changes in the emission regulations field, which sometimes foster and sometimes
limit its capital expenditure toward different ends. Eventually, the Company needs
also (i) to balance client’s demand with the power of its exclusivity mission, (ii) solve
the trade-off between internalization and externalization of processes and (iii)
needs to enhance its Formula 1 pole positions so to increase the brand recognition
and prideness in costumer’s minds.                                                           Source: Ferrari 2018 Annual Report (Team elaboration)

Industry Overview & Outlook
                                                                                             Private vs Shared Vehicles (Exhibit 12)
The Overall Automotive Industry Future Trends
The key trends1 related to the automotive industry are forecast to be (i) a shift
towards markets and revenue pool, (ii) increased changes in the consumer mobility
habits, (iii) the widespread of ground-breaking technologies and (iv) major
competition and cooperation in the overall value chain. Overall, the shared mobility
trend and multiple macroeconomic factors will impact vehicles unit sales that are
forecast to grow but at a slower pace, from 3.6% of the last five years to
approximately 2% by 2030. This is linked to the possibility that one out of ten cars
will be a shared vehicles with fit-for-purpose mobility solutions (Exhibit 14).
Moreover, growth will rely on emerging economies such as China and India and will
be pushed by the medium-term reality that cars will take over the control from
                                                                                             Source: IHS Automotive (Team elaboration, millions of vehicles)
drivers.

A cutting-edge “Eascy” Type of Mobility                                                      Manufacturer & Suppliers Shift (Exhibit 13)
The car of the next decade is going to be so-called eascy: electrified, autonomous,
shared, connected and yearly updated. This results in a 40% mileage covered by
autonomous vehicles by 20302, with a parallel pace development in E.U. and U.S.
and a faster one in China. Therefore, this type of mobility will change significantly
the habits of the consumer, that will eventually travel more kilometers, and of
manufacturers as well (e.g. Exhibit 15). Future vehicles will be used more intensively
and therefore they will be replaced sooner, effect partially offset by fewer accidents
and less maintenance costs. Nonetheless, the manufacturers need to face the reality
of sinking margins and ever-increasing R&D expenses for customer-oriented
innovations, i.e. to capture the shift from traditional automobiles that represented a
                                                                                             Source: Deloitte Electric Vehicles Outlook (Team elaboration)
form of personal ownership with emotional ties, to digital preferences.

1   Source: IHS Automotive & McKinsey Automotive Revolution - Perspective Towards 2030                                                           9
Buy | €172
Equity Research
Upside | +11%
Technological Widespread | From Hardware to Software Software Lines of Code Required (Exhibit 14)
The key-challenges that are currently limiting the introduction of Advanced Driver
Assistance Systems (ADAS) and Fully Autonomous Vehicles (AVs) are pricing,
consumer recognition and safety topics. The crucial transition will now be from the
Level 3 standard NHTSA (National Highway Traffic Safety Administration), which
allows the driver to take control in certain situations to the Level 4 NHTSA, which
instead does not require any on-board intervention. This transition will likely be
achieved thanks to further technological improvements and R&D investments, and
will lead to a cutting-edge value offering for consumers with a 50% of vehicles
being highly autonomous by 2030 and 15% fully autonomous. Therefore, this
disruption trend and its complexity (as shown in Exhibit 15 and 16), requires new
competencies, actions and way of thinking in order to face the competition of the
market itself and the one coming from Start-Ups and Tech Giants, which with their Source: McKinsey Center for Future Mobility (Team elaboration, data in
data-richness, huge-capitals and R&D-intensity aspire to shape the future of Millions of lines of code)
mobility as well.
Electric Vehicles | Regulatory Volatility & Customer Demand Electric Car Deployment (Exhibit 15)
The last decade has been noteworthy to create a landmark for Electric Vehicles
(EVs, Exhibit 17), namely divided into Battery Electric Vehicles (BEV) and Plug-in
Hybrid Vehicles (PHEV). EV deployment has accelerated thanks to (i) a positive
environment created by policy and regulations, (ii) growing customer demand and
habits and (iii) continued investments and innovations by Original Equipment
Manufacturers (OEMs). The key purchasing barrier is represented by the cost-of-
ownership, until it will reach the par with the internal combustion engine (ICE) one.
As a result, the share of EVs will grow exponentially. Moreover, the E.U. Council
proposal of achieving a 21% reduction in CO2 emission by 2021 and 37.5% by
2030, has target implications across the mobility industry. For instance, the PHEV
and BEV market will merge into a 10% of the market share by 2025 and 22% by
Source: IEA (Team elaboration, data in Millions)
2030. Moreover, financial incentives (namely government subsidies and VAT, tax
exemptions) and city access restrictions (with multiple bans for gasoline and diesel
EBIT-Margin Trajectories (Exhibit 16)
vehicles) are key to make EVs more appealing and affordable to both private and
business customers. On the flip of the coin, the EV transition is hitting margins
significantly, with a downward trajectory that is expected to continue until an
optimal level of production is achieved and battery prices fall below USD 100/KWh.
The key factors are namely ever-growing tech expenditures, already-mentioned
emission compliance, higher input costs and dilution from selling more EVs (Exhibit
18). To conclude, this shift needs to be matched by charging infrastructures, with
the availability of fast chargers and their ability to recharge 80% of battery in 15
minutes.
The shift toward EVs | Ferrari leading the R&D per Sales race
On one side, the threat from Tesla and other entrants is posing risks to EU Source: Bloomberg (Team elaboration, data updated December 2019)
automakers. On the flip of the coin, they may count on over €60 Bn net cash, which
put them in a strong position to invest in new technologies, with EV losses that can
Global Sales by EU OEMs (Exhibit 17)
be initially offset by profitable combustion-powered sales. The key threat posed to
Tesla is represented by the Porsche Taycan BEV, which is set to take the pole
position in electric-car performance. The latter is followed by (Exhibit 19 & 20)
Mercedes, Audi and Jaguar for an exclusive-upper market, and from VW which
stated it is ready to release 80 EV models by 2025 and 300 by 2030. Ferrari is
currently leading the ratio of R&D to Sales. Daimler and BMW’s R&D expenditures
have doubled from 2007-2008 levels amid expanding model offer and new
emission targets. VW’s R&D budget is the third-largest in the world, behind Amazon
and Alphabet. Overall, GM, Ford and FCA have committed to ramp-up R&D
expenditures at USD 40 Bn combined, to fund the above-mentioned electric
drivetrains development and progress on self-driving and driving-assistant systems. Source: Bloomberg Data (Team elaboration, data in Units Rebased)
10
2 Source: PwC, Five Trends Transforming the Automotive Industry (2019)Buy | €172
Equity Research
Upside | +11%
High Luxury Car Outlook Summary EU Automaker (Exhibit 18)
Since 2008, the spend on high luxury vehicles (HLS) has grown faster than the
spend in any other luxury goods, with an estimated market value of €495 Bn in
2018. An ever-increasing luxury vehicles offer, a shift in consumer preferences from
sedan to SUVs and an incremented disposable income with more HNWI (Exhibit 21)
than ever, have propelled the demand for luxury cars worldwide. The global luxury
car market is expected to register a CAGR of about 5.83% during the period 2019 -
2024, with revenues of USD 5 Bn. This is fueled by the launch of electric variants
which comprehend smart mobility technologies such as AV, personal voice
assistance and retina recognition. The main established HLS markets include
Europe, North America and Japan, which benefit from a significant amount of
HNWIs, advanced infrastructure and brand reputation, while developing markets Source: McKinsey Center for Future Mobility & Bloomberg data (Team
elaboration, data in Millions updated in 2019)
can count on Russia, India and China. Reading these considerations, the investors
must keep in mind that an uncertainty in the economic cycle, specifically with a
potential recession in the upcoming two years, may reduce significantly the Evolution of HNWI (Exhibit 19)
consumer’s willingness to buy HLS cars.
Automakers Bypassing Cars for Muscles
A growing trend is represented by the client’s propensity to buy luxury SUVs, which
is forecast to grow by 30% between 2019 and 20303. Pickup trucks, crossover and
SUVs are higher-margin vehicles currently benefitted by a significant momentum,
especially in the U.S.. The number has strongly shifted from cars to trucks, offsetting
Source: World Wealth Report 2018 (Team elaboration, data USD
the impact of decreasing car volumes growth and boosting retail revenues by 79%. Trillions; HNWI represents individuals with assets USD 1-50 MM)
Multiple automotive manufacturer are exploring the SUVs and truck segment, amid
the competition with Tesla new-edgy truck release. The astonishing number of Auto Loan Delinquent (Over 90D) (Exhibit 20)
orders received mirrors the interest of the overall public in this new technologies
and the need to foster new consumer habits. The latter has been furtherly
embraced in the luxury segment by multiple automakers, namely Bentley, Rolls-
Royce, Lamborghini, Maserati, Porsche, Aston Martin and Jaguar. Moreover, a lack
of profitability and limited competitive pressure has currently delayed a marriage
between the three most popular light-truck segments, which represent more than a
third of U.S. unit sales, and the so-called pluggable drivetrains, which currently are
less than 2%.
Trade Impact
i) United States: the Import tariff is expected to raise from the current 2.5% to 25%
(Source: Bloomberg) in 6 months. Among others, the above-mentioned increase is
expected to hit in particular the sport-car segment: given their high price point, the Source: Bloomberg (Team elaboration, data updated December 2019
increase will conceivably be entirely shifted to the consumer. This will give a hedge in percentage)
to US and Japanese brands, since they are more competitively priced, especially in
the SUV segment. Within the European car marker, BMW, Daimler and Volkswagen
Destination of EU Vehicles Export (Exhibit 21)
are characterized by the highest level of US production concerning automobiles,
SUVs and also heavy trucks. Prolonged tariffs threat could lead automakers to shift
the production to cheapest location, with dangerous effects regarding the Capital
Expenditures thought for R&D.
ii) China: despite the first US-China trade deal, the production located in United
States might be potentially harmed by the reintroduction of Chinese incremental
tariffs on US-made vehicles equal to 25%. In 2018 BMW, Daimler, Toyota and VW
were responsible for the 70% of passenger vehicles import in China, and this
panorama is also significantly growing for exotic and luxury vehicles. For what
concerns European luxury brands, they have benefited from the 2018 Chinese tariff
reduction (from 25% to 15%), that led to a decrease of their price point. Moreover,
the premium segment is expected to increase its 2019 sales in China, since the
production is entirely located in EU, thus the danger of a Chinese retaliation against
US-made cars is avoided. Source: Bloomberg Data (Team elaboration)
11
3 Source: IHS Global Automotive Outlook 2018Buy | €172
Equity Research
Upside | +11%
Vehicles Exported from EU (Exhibit 22)
iii) United Kingdom: Brexit is estimated to lead to a possible 10% tariffs on UK
US
auto imports, as well as a weaken of the pound that will affect the purchasing power China
of the British consumers. The threaten arising from a no-deal endangers €27 Bn of Turkey
annual sales and 6% EBIT of German automakers. The combined imports from Switzerland
Germany and France amount to the 54% (€33 Bn) of estimated UK annual auto Japan
purchases, against a 16% market share of domestic production. Comparing the Norway
effects of US tariffs increase and a no-deal Brexit, the latter scares mostly European Australia
South Korea
carmakers: the cars exported from EU to US amounted to 640,000 units (estimated Russia
€22 Bn of revenues) in 2018, while just the German production shipped to UK Serbia
amounted to 850,000 vehicles (estimated €27 Bn of revenues). Including French -100.000 100.000 300.000 500.000 700.000 900.000 1.100.000
and Italian owned brands, the amount of vehicles shipped to UK is 1.4 Million, with
Source: European Automobile Manufacturers Association, ACEA (Team
an estimate sales value of €35 Bn. elaboration)
FX Exposure
The past years have been characterized by extensive currencies hedging, with
favourable average sterling and dollar rates. Daimler (Source: Bloomberg Passenger Cars by Segment in EU (Exhibit 23)
Intelligence) expects that the strength of the Euro would cause a 0.5-1 Billions of
headwinds across multiple currencies and BMW has already increased its hedging 15.000.000
to €500 MM. Moreover, FCA is expected not to be impacted from future changes, 13.000.000
given its Chrysler USD business . The threats arising from the FX exposure will harm 11.000.000
mostly firms like Ferrari, since it hedges 12 months in advance for its largest market. 9.000.000
BMW, Daimler, Ferrari and VW thanks to their size and capability to hedge the key 7.000.000
currencies, are expected to limit the impact of sterling weakness, while other 5.000.000
companies are expected to face immediate pressure, given their unhedged 3.000.000
position in euro-sterling estimated in 5.8 billions of revenue in 2018.
1.000.000
-1.000.000 2008 2009 2010 2011 2012 2013 2014 2015 2016 2017 2018
Small (A+B) Medium (C) Upper Medium (D) Luxury (E+F) MPV SUV
Potential Porsche IPO & Lamborghini Spin-Off
Ferrari’s valuation has already inspired Aston Martin market debut and innovative Source: European Automobile Manufacturers Association, ACEA (Team
elaboration)
ways to showcase the merge between technology and hidden luxury are attracting
interesting multiples, compared to plain-vanilla automakers. Softbank has already Import & Export of Vehicles, Parts and
invested USD 2.25 Bn for 20% of GM Cruise Automation unit and the race toward Accessories from/to UK (Exhibit 24)
value creation for automakers’ tech division has surged with the BMW and Daimler
partnership for mobility-services businesses. Bloomberg estimates a €100 Bn 22,7
valuation for Porsche AG in case VW would opt for its IPO, with a 15% EV/EBITDA 18,5
discount to Ferrari. On this note, a Lamborghini IPO could achieve similar luxury
multiples, valuing the automaker at €8.3 Bn on the wake of its new-released URUS 7,3
SUV that has almost double the Company 2019 EBITDA compared to the 2015 4,2
2,6
4,7 5,2
3,4 3,6
2,1 2
1,8 1,7 1,9 1,51,6
0,81,50,7
figure. Moreover, the latter is focused on limited special series, a similar strategy to 0,1
-0,1
Ferrari which trades at luxury-goods 2020 multiple of 19.2x EV/EBITDA and with Germany Belgium Spain France Poland Netherlands Italy
Import from UK Export to UK Balance
Lamborghini that employee just 40% of Ferrari’s total workforce. This would further
stimulate the market, adding capitals, transparency and competition for the Source: European Automobile Manufacturers Association, ACEA (Team
elaboration, Billions of EUR)
previously mentioned future trends.
Ferrari vs Porsche vs Lamborghini Valuation (Exhibit 25)
Ferrari N.V Porsche AG Lamborghini
2017 2018 2019 2020E 2017 2018 2019E 2020E 2017 2018 2019E 2020E
Units sold 8398 9251 10133 10722 246375 256000 264704 306527 4156 6621 7575 8075
Revenue (€M) 3.417 € 3.420 € 3.767 € 4.102 € 21.674 € 23.668 € 24.326 € 27.606 € 933 € 1.316 € 1.508 € 1.651 €
Revenue/Unit (€M) 292.451 € 274.050 € 295.125 € 305.802 € 87.972 € 92.453 € 91.898 € 90.060 € 224.495 € 198.762 € 199.073 € 204.413 €
EBIT (€M) 775 € 827 € 958 € 1.083 € 4.003 € 4.110 € 4.135 € 4.831 € 141 € 145 € 268 € 329 €
EBIT Margin 22,68% 24,18% 25,43% 26,40% 18,47% 17,37% 17,00% 17,50% 15,11% 11,02% 17,77% 19,93%
Adj. EBITDA (€M) 1.036 € 1.115 € 1.275 € 1.417 € 6.279 € 6.677 € 6.856 € 7.824 € 245 € 351 € 478 € 539 €
EBITDA Margin 30,32% 32,60% 33,85% 34,55% 28,97% 28,21% 28,18% 28,34% 26,26% 26,67% 31,70% 32,65%
Depreciation (€M) 261 € 289 € 318 € 334 € 2.276 € 2.567 € 2.721 € 2.993 € 104 € 205 € 210 € 210 €
Market Cap (€M) 15.493 € 18.832 € 26.793 € 26.793 € - - 130.812 € 149.439 € - 8.587 € 10.183 € 8.264 €
Net Cash/Debt (€M) 473 € 370 € 200 € 200 € 3.067 € 2.635 € 2.635 € 2.635 € - - - -
Minorities (€M) 5€ 5€ 7€ 5€ - - - - - - - -
EV (€M) 16.057 € 27.453 € 27.266 € 27.266 € - - 131.969 € 150.596 € - 8.622 € 10.218 € 8.299 €
EV / EBITDA (x) 15,5 24,6 21,4 19,2 - - 19,3 19,3 - 24,6 21,4 15,4 12
Source: Bloomberg (Team elaboration)Buy | €172
Equity Research
Upside | +11%
Environmental, Social & Governance
The Board of Directors The BoD Composition (Exhibit 26)
Ferrari has adopted a code of governance that follows the Dutch standards, i.e. the
country of domicile. The BoD, which is fully responsible for the company's strategy,
is currently composed by twelve members (eight men and four women), one
executive and the other non-executive. L. C. Camilleri replaced as executive S.
Marchionne in 2018. A. Felisa is the former CEO (2016) and member of BoD, G.
Capaldo is member of the Governance & Sustainability Commitee (2018), P. Ferrari
and E. Cue are members of the Compensation Commitee (2018) and S. Duca is the
chairman of the audit committee. The independents supervise the action of the
executives and the evolution of the company's business, including the
implementation of the strategy and the creation of value in the medium and long
term. The Governance & Sustainability Commitee assists and advises the BoD on
the periodic, i.e. annual, assessment of the performance of individual, executive
and non-executive directors, along with ethical (as gender diversity) policy controls.
In addition, this committee evaluates the work of the Audit and the Compensation
ones. To conclude, the BoD meetings are key in order to discuss several building
Source: Ferrari 2018 Annual Report (Team elaboration)
blocks of Ferrari, such as the group strategy, the reporting and financial results,
sustainability, acquisitions and divestments, technological development, executive
compensation, risk management, human resources, legal and compliance and the
remuneration policy.
Shareholder Composition
Ferrari shareholding composition aims to create stability both in the concept of a Key-Shareholders (Exhibit 27)
widely-held company and with the framework of effective decision-making power.
Exor N.V. has the majority of Ferrari’s stake with its 23.7% that counts for
approximately 33.6% of voting power in the Company and Piero Ferrari that holds
10.1% of common shares with 15% of voting rights. The two signed an agreement
which states a pre-emption right in favor of the former and right of first offer in case
of common shares transfer for the latter. The remaining 66% is represented by a
free float where the TOP100, TOP50 and TOP10 investors control respectively the
72%, 67% and 60% of these outstanding shares. Among the latter is worth
mentioning: Baillie Gifford & Co. (7.23%), T. Rowe Price Associates, Inc (4.60%), The
Vanguard Group, Inc. (2%), CPP Investment Board (1.41%), AKO Capital LLP
(1.36%), D1 Capital Partners L.P. (1.34%), Winslow Capital Management, LLC Source: Reuters Data (Team representation). For detailed information
about the Institutional shareholders please see Appendix 2
(1.16%) and Melvin Capital Management LP (1.08%). Notably enough, 128 MM of
outstanding shares are divided between the Netherlands (44 MM), the U.S. (41
MM), the U.K. (22 MM) and Italy (21 MM).
A Strong Management in Pole Position
John Philip Elkann, grandson of Gianni Agnelli, chairman and CEO of Exor N.V. (a Management Chart (Exhibit 28)
holding company controlled by the Agnelli family) has been appointed from July
2018 as chairman of Ferrari after the untimely health issues of Sergio Marchionne.
Following J.P. Elkann on the line there is Piero Ferrari, co-chairman and the only
remaining son of Enzo Ferrari, and Louis Camilleri, Chief Executive Officer from
2018. Mr Camilleri has a throughout history of successes in covering C-level
positions in multiple industries, from Kraft Foods to Philip Morris. Different Chief-
officers follows the former, with a clear diversification in terms of coverage and
operating supervision. The role of co-chairmen held by Mr Ferrari fosters the link
between the heritage of the company and its actual and future positioning. The
position of CEO played by Mr Camilleri ensures the technical knowledge necessary Source: Ferrari 2018 Annual Report (Team representation)
to push forward the company and face the actual challenges that are
revolutionizing the automotive industry. Different Chief-officers follows the former,
with a clear diversification in terms of coverage and operating supervision.
13Buy | €172
Equity Research
Upside | +11%
Internal Programs & Initiatives (Exhibit 29)
The Code of Conduct
Ferrari's code of conduct complies with multinational standards to ensure high
levels of integrity and to sustain different cultural, regional and minorities. The latter
is approved by the BoD and it is applicable to all Ferrari’s members. The company
firmly prohibits and condemns conduct such as corruption, bribery and
whistleblowing4 which would result in serious damage to Ferrari’s image.
Ferrari’s People Source: Ferrari 2018 Annual Report (Team elaboration)
The Human Capital is a paramount building block for Ferrari to maintain its position
as a global leader in the luxury car segment. As a result, the company organises Employees per Gender 2018 (Exhibit 30)
Graduate Programs to identify prospect talents to onboard and multiple activities to
foster the consistent and periodic development of the workforce. The company
organizes meetings with several universities as well as many Graduate Programs
and graduate projects such as the "Ferrari F1 Engineering Academy" to discover the
best talents. The training is carried out with tailor-made programs in order to
motivate the talents and guide them in their career. In this way, business continuity
is ensured through the transfer of expertise. By 2018, Ferrari had 3851 employees,
110 of whom were executives. An incentive plan is placed for the entire staff and
the work environment is completely built on the idea of obtaining the best
performance possible from the staff: among others, many investments took place Source: Ferrari 2018 Annual Report (Team elaboration)
to increase the green areas in the plants, restaurants, noise reduction tools, lights CO2 Emissions per Vehicle (Exhibit 31)
optimisations and more. Ferrari launched in the same year the MBA Ferrari
corporate executive in collaboration with the Bologna Business School and multiple
programs like the ones in "cyber security" and "data collect and protection" were
offered, increasing the total number of training hours increased by 45%. To
conclude, Ferrari's Maranello and Modena plants focus on accident prevention and
safety: periodically, a health and safety audit process is held in compliance with the
Ferrari health and safety management system. In 2018 there were no fatal
accidents.
Sustainability for a Better Future
The greatest efforts in terms of environmental achievements are linked to
maintaining high manufacturing efficiencies and reducing polluting emissions. The Source: Ferrari 2018 Annual Report (Team elaboration)
monitoring of the plants is entrusted to a team that reports directly to the Chief
Technological Officer (CTO). At the moment, 13% of the plants' energy
ESG Parameters - Ferrari & Peers (Exhibit 32)
requirements come from renewable resources, namely solar panels and the lighting
system has been replaced with the new LED technology. Moreover, a significant
focus is paid to the management of waste, with several initiatives such as the reuse
of excess aluminum and the processing of waste by business partners in circular
economy perspective. The vehicles production process is water intensive, so an
innovative cooling system with re-circulation of water has been developed. The
water resources come from nearby municipalities and utilities. The water produced
by particular industrial processes are treated with break-through instruments before
being re-introduced into the public system. The vehicles produced must be
compliant with regional, national and local regulations: notably, with regard to the
emissions, the company benefits from the qualification of being a Small Volume
Manufacturer and this applies in all jurisdictions in which Ferrari sells its product. In
2012, a 27% reduction in emissions was achieved compared to 2002. The new
target is to reduce the fleet's CO2 emissions by 15% in 2020. As conceivable by
Exhibit 32, Ferrari is significantly capital intensive, but has a strong ability to retain
talents and design an efficient remuneration policy compared to the selected
peers5.
Source: Bloomberg Data (Team elaboration).
4The Company complies with the new 2017 Italian whistleblowing regulation which is supervised by the Audit, HR and Legal department. 14
5 Thepeer for this specific analysis have been selected from Ferrari identification in its 2018 Annual Report and are LVMH, Ferragamo, Richemont, Hermes,
Moncler, Brunello Cucinelli, and BurberryBuy | €172
Equity Research
Upside | +11%
Financial Analysis
Historical Perspective: a Company that Never Settles Revenues, EBITDA and Net Income Margin
Ferrari key revenues’ components, i.e. the 77%, is represented by the sales of cars (Exhibit 33)
and spare parts (Exhibit 10), the rest namely being engines, sponsorship and 4.000 40%
33,7%
brands and other. The Compound Average Growth Rate (CAGR) for the 2014-2018 3.500 30,3% 32,6% 35%
27,1%
has been 4.36%. As conceivable from Exhibit 37, Ferrari generated increasing 3.000 24,6% 25,2% 30%
Revenues in the last 5 years; nonetheless, it's important to notice that the revenues 2.500 22,9% 25%
18,6%
have indeed remained quite stable between 2017 and 2018. Despite the latter, the 2.000 12,8% 15,7%
20%
EBITDA Margin in 2018 is still greater than the one of 2017, as well as the net 1.500
9,5% 10,1%
15%
income. This could mainly be attributed to the 2018 new tax regime (patent box) by 1.000 10%
500 5%
Ferrari. The revenues variation gives a quick guidance on future trends, and helps to 2.762 2.854 3.106 3.417 3.420 3.767
0 0%
make informed decisions regarding the business strategy. Moreover the Return on 2014 2015 2016 2017 2018 2019
Equity (ROE), is used to verify the rate of return on risk capital. The indicator can be Revenues (€M) EBITDA (%) Net Income (%)
considered as a summary of the overall cost effectiveness, evaluating how the Source: Reuters data (Team representation)
management has been able to administrate its own resources to increase Ferrari’s
profits. For this reason, the indicator gives a first idea of the profitability of the Basic EPS Including Extraordinary Items
(Exhibit 34)
company: it's possible to notice that Ferrari has an impressive ROE, around 60%.
Subsequently, we carried out the calculation of the debt to equity ratios of the 38%
4,0 40%
company. Specifically, we can appreciate that Ferrari presents coefficients slightly 3,5 32% 35%
above the level defined by the theory (except for the 2015, in which the ratio is 3,0
28%
30%
23%
around -90,4). Thanks to the analysis, we are therefore able to get a first idea about 2,5 25%
what was the strategy adopted by Ferrari, in terms of consistency with the 2,0 20%
1,5 15%
positioning in relation to external pressures.
1,0 10%
0,5 5%
1,63 2,24 2,82 3,39 3,72
Values in 2014 2015 2016 2017 2018 2019 0,0 0%
€M 2015 2016 2017 2018 2019
ADJ. EPS CAGR EPS
Total
Revenues 2.762,36 2.853,88 3.105,55 3.416,89 3.420,32 3.766,59
Source: Reuters data (Team representation)
EBIT 389,67 443,67 594,66 774,90 826,74 917,55
CAGR 13,9% 23,5% 25,8% 20,7% 18,7% Debt / Equity Percentage (Exhibit 35)
% on Rev 14,1% 15,5% 19,1% 22,7% 24,2% 24,4%
EBITDA 678,65 718,43 842,13 1.035,51 1.115,49 1.270,06
CAGR 5,9% 11,4% 15,1% 13,2% 13,4% 2019 57% 43%
% on Rev 24,6% 25,2% 27,1% 30,3% 32,6% 33,7%
2018 59% 41%
Net Income 261,57 287,17 398,34 534,88 784,91 699,16
2017 70% 30%
CAGR 9,8% 23,4% 26,9% 31,6% 21,7%
2016 85% 15%
% on Rev 9,5% 10,1% 12,8% 15,7% 22,9% 18,6%
2015 101%
2014 17% 83%
The boolean relationship between pricing-mix and volume growth:
0% 25% 50% 75% 100%
will Ferrari truly become a luxury brand? Long Term Debt (%) Equity (%)
Source: Reuters data (Team representation)
Ferrari’s average price on total shipments has decreased both in 2015 (-1,4%) and
2018 (-7,3%). This phenomena has been partially offset by an increase of +6.6% in
2019. Overall we believe that the pricing power was untapped in the past, since: (i)
Shipment by pillars (Exhibit 36)
higher shipments contribution, (ii) lower pricing contribution compared to luxury
pricing growth.
0,3% 1,4% 1,7% 1,1%
4% 7%
11%
• The number of shipments have weighted more than the price on revenues 32%
28%
17%
Car and spare parts revenues increased steadily year on year from 2014 to 2019, 38%
38%
36%
with the exception of 2018. In fact, in 2018 Ferrari registered a positive increase in 36%
Range and Special cars’ revenues, but it was €100M lower than 2017 change,
64%
worsened by a €66M reduction in Hypercars and Limited cars’ revenues. However, 46% 49% 54%
36%
the overall 2014-2019 cumulated growth in cars and spare parts revenues is mostly
attributable to a positive shipments contribution than price. Considering a log 2018 2019 2020 2021 2022
computed cumulated increase of 44,2% from 2014 to 2019 in cars’ revenues, a Sports GT Special Series Icona
33,4% change is attributable to shipments contribution, while just 10,7% to price
Source: Team estimates from Ferrari’s historical data and comments
contribution. It corresponds to 6,9% CAGR in terms of shipments and 2,2% CAGR in
terms of average price, between 2014 and 2019. 15You can also read


