Whiteleg Shrimp Litopenaeus vannamei - Seafood Watch
←
→
Page content transcription
If your browser does not render page correctly, please read the page content below
Whiteleg Shrimp
                                        Litopenaeus vannamei

                                     ©Scandinavian Fishing Yearbook

                                           Thailand
                                       Intensive ponds

                                             July 6, 2020
                                         Seafood Watch Staff

Disclaimer
Seafood Watch® strives to have all Seafood Reports reviewed for accuracy and completeness by external
scientists with expertise in ecology, fisheries science and aquaculture. Scientific review, however, does
not constitute an endorsement of the Seafood Watch® program or its recommendations on the part of
the reviewing scientists. Seafood Watch® is solely responsible for the conclusions reached in this report.

                                                    1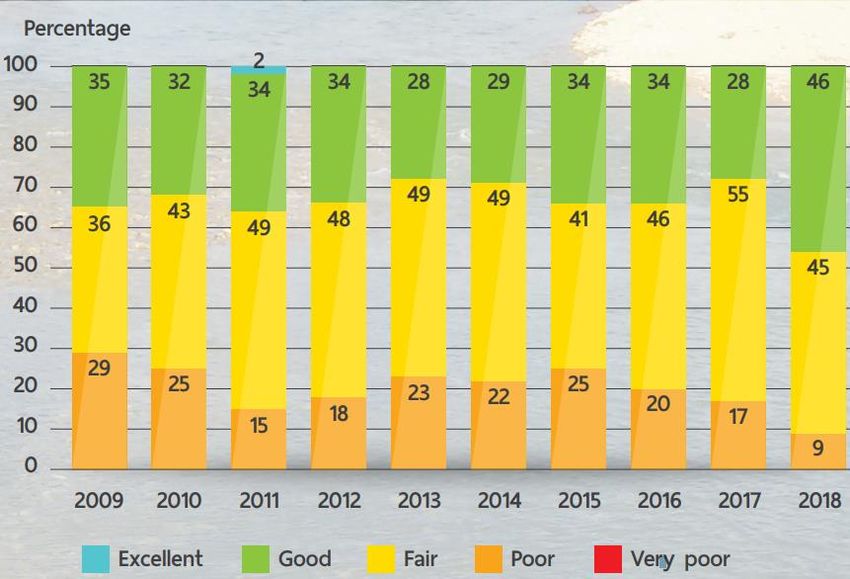
About Seafood Watch®
Monterey Bay Aquarium’s Seafood Watch program evaluates the ecological sustainability of
wild-caught and farmed seafood commonly found in the United States marketplace. Seafood
Watch defines sustainable seafood as originating from sources, whether wild-caught or farmed,
which can maintain or increase production in the long-term without jeopardizing the structure
or function of affected ecosystems. Seafood Watch makes its science-based recommendations
available to the public in the form of regional pocket guides that can be downloaded from
www.seafoodwatch.org. The program’s goals are to raise awareness of important ocean
conservation issues and empower seafood consumers and businesses to make choices for
healthy oceans.

Each sustainability recommendation on the regional pocket guides is supported by a Seafood
Watch Assessment. Each assessment synthesizes and analyzes the most current ecological,
fisheries and ecosystem science on a species, then evaluates this information against the
program’s conservation ethic to arrive at a recommendation of “Best Choices,” “Good
Alternatives” or “Avoid.” This ethic is operationalized in the Seafood Watch standards,
available on our website here. In producing the assessments, Seafood Watch seeks out research
published in academic, peer-reviewed journals whenever possible. Other sources of
information include government technical publications, fishery management plans and
supporting documents, and other scientific reviews of ecological sustainability. Seafood Watch
Research Analysts also communicate regularly with ecologists, fisheries and aquaculture
scientists, and members of industry and conservation organizations when evaluating fisheries
and aquaculture practices. Capture fisheries and aquaculture practices are highly dynamic; as
the scientific information on each species changes, Seafood Watch’s sustainability
recommendations and the underlying assessments will be updated to reflect these changes.

Parties interested in capture fisheries, aquaculture practices and the sustainability of ocean
ecosystems are welcome to use Seafood Watch assessments in any way they find useful.

                                                2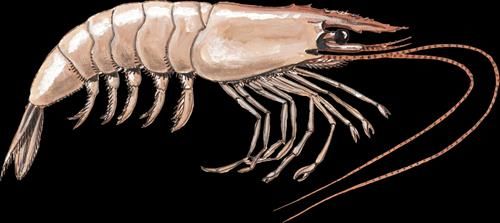
Guiding Principles
Seafood Watch® defines “sustainable seafood” as seafood from sources, whether fished or farmed, that
can maintain or increase production without jeopardizing the structure and function of affected
ecosystems.

Sustainable aquaculture farms and collective industries, by design, management and/or regulation,
address the impacts of individual farms and the cumulative impacts of multiple farms at the local or
regional scale by:

1. Having robust and up-to-date information on production practices and their impacts available for
   analysis;
   Poor data quality or availability limits the ability to understand and assess the environmental
   impacts of aquaculture production and subsequently for seafood purchasers to make informed
   choices. Robust and up-to-date information on production practices and their impacts should be
   available for analysis.
2. Not allowing effluent discharges to exceed, or contribute to exceeding, the carrying capacity of
   receiving waters at the local or regional level;
   Aquaculture farms minimize or avoid the production and discharge of wastes at the farm level in
   combination with an effective management or regulatory system to control the location, scale and
   cumulative impacts of the industry’s waste discharges.
3. Being located at sites, scales and intensities that maintain the functionality of ecologically
   valuable habitats;
   The siting of aquaculture farms does not result in the loss of critical ecosystem services at the local,
   regional, or ecosystem level.
4. Limiting the type, frequency of use, total use, or discharge of chemicals to levels representing a
   low risk of impact to non-target organisms;
   Aquaculture farms avoid the discharge of chemicals toxic to aquatic life or limit the type, frequency
   or total volume of use to ensure a low risk of impact to non-target organisms.
5. Sourcing sustainable feed ingredients and converting them efficiently with net edible nutrition
   gains;
   Producing feeds and their constituent ingredients has complex global ecological impacts, and the
   efficiency of conversion can result in net food gains or dramatic net losses of nutrients. Aquaculture
   operations source only sustainable feed ingredients or those of low value for human consumption
   (e.g., by-products of other food production), and convert them efficiently and responsibly.
6. Preventing population-level impacts to wild species or other ecosystem-level impacts from farm
   escapes;
   Aquaculture farms, by limiting escapes or the nature of escapees, prevent competition, reductions
   in genetic fitness, predation, habitat damage, spawning disruption, and other impacts on wild fish
   and ecosystems that may result from the escape of native, non-native and/or genetically distinct
   farmed species.
7. Preventing population-level impacts to wild species through the amplification and retransmission,
   or increased virulence of pathogens or parasites;
   Aquaculture farms pose no substantial risk of deleterious effects to wild populations through the
   amplification and retransmission of pathogens or parasites, or the increased virulence of naturally
   occurring pathogens.

                                                     3
8. Using eggs, larvae, or juvenile fish produced from farm-raised broodstocks thereby avoiding the
    need for wild capture;
    Aquaculture farms use eggs, larvae, or juvenile fish produced from farm-raised broodstocks thereby
    avoiding the need for wild capture, or where farm-raised broodstocks are not yet available, ensure
    that the harvest of wild broodstock does not have population-level impacts on affected species.
    Wild-caught juveniles may be used from passive inflow, or natural settlement.
9. Preventing population-level impacts to predators or other species of wildlife attracted to farm
    sites;
    Aquaculture operations use non-lethal exclusion devices or deterrents, prevent accidental mortality
    of wildlife, and use lethal control only as a last resort, thereby ensuring any mortalities do not have
    population-level impacts on affected species.
10. Avoiding the potential for the accidental introduction of secondary species or pathogens resulting
    from the shipment of animals;
    Aquaculture farms avoid the international or trans-waterbody movements of live animals, or ensure
    that either the source or destination of movements is biosecure in order to avoid the introduction of
    unintended pathogens, parasites and invasive species to the natural environment.

Once a score and rating has been assigned to each criterion, an overall seafood recommendation
is developed on additional evaluation guidelines.            Criteria ratings and the overall
recommendation are color-coded to correspond to the categories on the Seafood Watch pocket
guide:

Best Choices/Green: Are well managed and caught or farmed in environmentally friendly ways.

Good Alternatives/Yellow: Buy, but be aware there are concerns with how they’re caught or
farmed.

Avoid/Red: Take a pass on these. These items are overfished or caught or farmed in ways that
harm other marine life or the environment.

                                                     4
Final Seafood Recommendation
Whiteleg shrimp
Litopenaeus vannamei
Thailand
Intensive ponds
Criterion Score Rank Critical?
C1 Data 5.45 Yellow n/a
C2 Effluent 6.00 Yellow No
C3 Habitat 4.27 Yellow No
C4 Chemicals 4.00 Yellow No
C5 Feed 3.00 Red No
C6 Escapes 4.00 Yellow No
C7 Disease 4.00 Yellow No
C8X Source 0.00 Green No
C9X Wildlife -5.00 Yellow No
C10X Introduction of secondary species -1.50 Green n/a
Total 24.22
Final score (0-10) 3.46
OVERALL RANKING
Final Score 3.46
Initial rank Yellow
Red criteria 1
Interim rank Yellow Final Rank
Critical Criteria? 0 Yellow
Scoring note – Scores range from zero to ten where zero indicates very poor performance and
ten indicates the aquaculture operations have no significant impact. Two or more red criteria, or
1 Critical criterion trigger an overall Red recommendation.
Summary
The final numerical score for intensively farmed whiteleg shrimp (Litopenaeus vannamei) in
Thailand is 3.46 out of 10, which is in the Yellow range. With one Red criterion (Feed), the final
rank is Yellow and a “Good Alternative” recommendation.
5Executive Summary Today, the majority of Thai (whiteleg) shrimp pond systems are intensive, low-exchange, and periodically discharge water throughout a cycle and harvest that results in an average exchange rate of
Shrimp farm siting in Thailand is controlled and restricted to shrimp aquaculture zones, though
it is unclear to what degree ecological considerations were factored into the zoning process. All
farms are required to register with the DOF and obtain a license prior to operation, and
mangrove deforestation for the construction of aquaculture ponds is illegal. The government
also is actively working to reclaim land and restore mangroves in affected areas, and has
restored over 100,000 hectares since the lowest point in 1996. Enforcement of siting and
mangrove conservation laws is somewhat limited due to a lack of capacity. The score for
Criterion 3 – Habitat is a combination of the scores for Factor 3.1 – Habitat conversion and
function (4 out of 10) and Factor 3.2 – Farm siting regulation and management (4.8 out of 10),
and the final score is 4.27 out of 10.

Overall, chemical use in Thai shrimp aquaculture is common, though most do not pose
significant environmental concerns. Most chemicals used for pond preparation and disinfection
pose a low risk to the environment, given the low water exchange rates and rapid degradation
of these compounds and their by-products. On the other hand, the use of antibiotics in
aquaculture can result in the development of antibiotic-resistant bacteria in the environment
and pose significant risks to both the environment and human health.

This assessment considers the majority of shrimp farms in Thailand to discharge
67.49%; score of 3 out of 10) and moderate feed footprint (20.39 kg CO2-eq. per kg harvested
protein; score of 5 out of 10), the three factors combine to give a final score of 3.00 out of 10
for Criterion 5 – Feed.

Escape risk of shrimp ponds in Thailand is moderate-high, as the majority of the industry is sited
in low-lying and/or coastal areas where flooding regularly occurs. Despite this, on-farm escape
prevention measures taken by farmers (such as elevated dike construction, screens on outlets,
harvesting prior to large storms) and the effectively closed nature of farms (
The data regarding the impact that predator control at shrimp farms has on wild species is
poor, and the Risk-Based Assessment method was used. Overall, it is understood that Thai
shrimp farms may interact with predators and other wildlife, and farmers primarily utilize
nonlethal control methods to exclude predators and limit interactions; thus, it is considered
that management practices for non-harmful exclusion are in place. Despite this, there is limited
information available to determine whether any mortality (accidental or intentional) occurs
beyond the killing of fish as a biosecurity measure, and given the “near-threatened” population
status of numerous bird species that interact with shrimp ponds, some concern is warranted. It
is unlikely, though, that any mortalities that may indeed occur would significantly impact the
population size of the affected species. The final score for Criterion 9X – Wildlife and Predator
Mortalities is -5 out of -10.

Given the available evidence, it is determined that 40% of the Thai whiteleg shrimp farming
industry is reliant on international or trans-waterbody movements of live animals, resulting in a
score of 5 out of 10 for Factor 10Xa – international or trans-waterbody animal shipments. The
source of animal movements is mostly from fully biosecure broodstock and/or hatchery
facilities, while the destination of animal movements – production ponds – have some
uncertainty regarding the implementation and effectiveness of biosecurity measures in place,
resulting in an overall score of 7 out of 10 for Factor 10Xb. The final score for Criterion 10x –
Escape of Secondary Species is -1.5 out of -10.

Overall, the final numerical score for intensively farmed whiteleg shrimp (Litopenaeus
vannamei) in Thailand is 3.46 out of 10, which is in the Yellow range. With one Red criterion
(Feed), the final rank is Yellow and a “Good Alternative” recommendation.

                                                9
Table of Contents
About Seafood Watch® ................................................................................................................................. 1
Guiding Principles ......................................................................................................................................... 2
Final Seafood Recommendation ................................................................................................................... 4
Executive Summary....................................................................................................................................... 5
Introduction ................................................................................................................................................ 10
Scope of the analysis and ensuing recommendation ............................................................................. 10
Species Overview ............................................................................................................................... 10
Criterion 1: Data quality and availability .................................................................................................... 15
Criterion 2: Effluent .................................................................................................................................... 19
Factor 2.1 – Biological waste production per ton of shrimp .................................................................. 20
Factor 2.2 – Management of farm-level and cumulative impacts ......................................................... 22
Criterion 3: Habitat ..................................................................................................................................... 29
Factor 3.1 – Habitat conversion and function ........................................................................................ 29
Factor 3.2 – Farm siting regulation and management ........................................................................... 32
Criterion 4: Evidence or Risk of Chemical Use ............................................................................................ 37
Criterion 5: Feed ......................................................................................................................................... 43
Factor 5.1. Wild Fish Use ........................................................................................................................ 44
Factor 5.2 – Net protein gain or loss ...................................................................................................... 50
Factor 5.3 – Feed Footprint .................................................................................................................... 51
Criterion 6: Escapes..................................................................................................................................... 54
Factor 6.1 – Escape risk .......................................................................................................................... 55
Factor 6.2 – Competitive and genetic interactions ................................................................................ 57
Criterion 7: Disease; pathogen and parasite interactions .......................................................................... 60
Criterion 8X. Source of Stock – independence from wild fisheries ............................................................ 70
Criterion 9X: Wildlife mortalities ................................................................................................................ 71
Criterion 10X: Escape of secondary species................................................................................................ 74
Factor 10Xa – International or trans-waterbody live animal shipments................................................ 74
Factor 10Xb – Biosecurity of source and destination ............................................................................. 75
Overall Recommendation ........................................................................................................................... 78
Acknowledgements..................................................................................................................................... 79
References .................................................................................................................................................. 80
Appendix 1 - Data points and all scoring calculations ................................................................................ 94
10Introduction Scope of the analysis and ensuing recommendation Species: Whiteleg shrimp (Litopenaeus vannamei) Geographic coverage: Thailand Production Method: Intensive ponds Species Overview Litopenaeus vannamei live in tropical marine habitats and are native to the Eastern Pacific coast from Sonora, Mexico in the north to Tumbes, Peru in the south. As such, they are non-native to Thailand. As for all Penaeid species, adults live and spawn in the open ocean, while postlarvae (PL) migrate inshore to spend their juvenile, adolescent and sub-adult stages in coastal estuaries, lagoons or mangrove areas (FAO 2006). Production System Intensive farms are generally characterized as using aeration and manufactured feeds to support elevated stocking and biomass densities of shrimp beyond that which the natural environment can. This is the case in Thai L. vannamei production, with the vast majority of production (99.6%) occurring in intensive ponds (356,359 metric tons (mt) out of a total 357,933 mt in 2018; DOF, 2020). Average intensive Thai shrimp farm size (data are inclusive of P. monodon) is just under 2 hectares (ha), with 19,553 intensive farms registered by the Department of Fisheries (DOF) occupying 35,744 ha (DOF, 2020); there is, of course, a range of farm sizes in operation and no “median” value could be obtained, though large farms are often >16 ha in size (Boyd et al. 2017; Na nakorn et al. 2017). Pond size ranges from 0.33 to >1.5 ha, though commonly are 1 ha in size (Boyd et al. 2017; Seafood Watch field research). The majority of intensive Thai whiteleg shrimp pond systems are low-exchange, and periodically discharge water to the environment (i.e. outside of the farming system) throughout a cycle and harvest that results in an average exchange rate of
culture ponds. Culture ponds frequently are equipped with polyethylene liners to limit erosion
(either on the banks, or on the entire pond, depending on the size of the farm) along with
central drains to facilitate the removal of sediment and/or sludge (uneaten feed, feces, etc.).
This helps to minimize the accumulation of organic content so as not to support the growth of
bacteria, such as VPAHPND (Boyd et al. 2017; Na nakorn et al. 2017; pers. comm. Robins
McIntosh, Charoen Pokphand, 2018; pers. comm. Nick Leonard, Rubicon Resources, 2018).
Water is recirculated and maintained within the system throughout a production cycle, with
small additions of water to culture ponds from the treated reservoir(s) to replace water lost
through evaporation and sludge removal; this system is sometimes referred to as “intensive
2.0” or “the toilet”, with the removal of sludge referred to as “flushing” (pers. comm. Robins
McIntosh, Charoen Pokphand, 2018; pers. comm. Nick Leonard, Rubicon Resources, 2018). See
Figure 1 for schematic diagrams depicting this system in small-scale (16.1 ha) farms in Thailand.

  Figure 1. Diagram of used water and water management practices at each scale of shrimp farm at
 Bandon Bay, Surat Thani province, Thailand: (A) small-scale farms; (B) medium-scale farms; (C) large-
     scale farms. (Surveyed during January-October, 2013). Figure from Na nakorn et al. (2017).

Production statistics
Annual production of L. vannamei in Thailand steadily rose from roughly 375,000 mt in 2005 to
a peak of 603,000 mt in 2011 before rapidly declining in the following years due to disease
(Figure 2). In 2018, 357,933 mt of L. vannamei were produced, accounting for just under 96% of
all Thai shrimp production; the remaining 4% was largely accounted for by the black/giant tiger
prawn P. monodon (DOF, 2020). In 2017 (the most recent available total statistics), farmed

                                                  12
whiteleg shrimp represented roughly 30% of total aquaculture production in Thailand (FAO,
2018; DOF, 2020). Overall, Thailand is currently the sixth largest producer of whiteleg shrimp
globally, following China, Indonesia, India, Ecuador, and Viet Nam (FAO, 2018).
Farmed L. vannamei production in Thailand, 2006 - 2018
700,000
600,000
Production in metric tons (mt)
500,000
400,000
300,000
200,000
100,000
0
Year
Figure 2. Farmed Litopenaeus vannamei shrimp production in Thailand from 2006 to 2018. (DOF, 2020).
Import and export sources and statistics
Despite recent disease challenges that have significantly affected production, Thailand remains
one of the world’s main shrimp producing nations and the United States (US) is their highest
volume importer.
Farmed L. vannamei represented roughly 97% of total shrimp exports and totaled 163,925 mt in
2019 according to a summary export document from the Thai Frozen Foods Association (TFFA)1.
A more detailed breakdown of shrimp exports is available from TFFA for 2017 and shows the US
imported 74,605 mt of shrimp from Thailand (fresh, chilled, frozen, prepared, processed),
worth $875.2 million USD, out of a total 208,068 mt ($2.04 billion USD) exported shrimp,
roughly 35% by volume and 41% by value2. The next largest importers of Thai shrimp are Japan,
which imported 44,758 mt, nearly 22% of total shrimp exports, followed by Canada, which
1
https://www.thai-frozen.or.th/index.php/seafood-industry-info/statistic-3/118-summary-statistics
2
https://www.thai-frozen.or.th/index.php/seafood-industry-info/statistic-3/119-export-2017
13imported 10,715 mt, or 5.15%. Though the TFFA export data are inclusive of all species of both
farmed and wild-captured shrimp, it is understood that >99% of exports are farmed whiteleg
shrimp (Portley, 2016).
US imports of Thai shrimp have closely mirrored production, and dropped by nearly 70%
between 2010 and 2014 (Figure 3). Data from the National Marine Fisheries Service (NMFS)
show a higher volume of imported shrimp from Thailand than export data from the TFFA. This
discrepancy is likely due to the preliminary nature of the TFFA data, though the accuracy of the
data coming from the TFFA may be questionable, as the numbers provided are lower than
those data reported by NMFS in every year back to 2006.
US imports of Thai shrimp, 2006 - 2019
250,000
194,091
203,290
200,000 188,867 183,406 192,766 185,783
Imports of shrimp (mt)
150,000 135,936
100,000 84,048 82,190
73,463 74,988
65,242
50,750
43,318
50,000
0
Year
Figure 3. US imports of Thai shrimp, inclusive of all species and wild-capture fisheries. Data from the
National Marine Fisheries Service.3
Common and market names
Scientific Names Litopenaeus vannamei
Common Names Pacific white shrimp, whiteleg shrimp,
western white shrimp, or shrimp
United States Whiteleg shrimp
Spanish Camarón patiblanco
French Crevette pattes blanches
3
https://www.st.nmfs.noaa.gov/commercial-fisheries/foreign-trade/applications/annual-product-by-
countryassociation
14Japanese Banamei-ebi (バナメイエビ)
Product forms
Shrimp are exported from Thailand in a variety of product forms, primarily frozen (61%),
followed by fresh or chilled (23%), and dried, salted, smoked, or in brine (16%)4. In the US, over
95% of shrimp imported from Thailand is frozen5. The primary form is frozen-raw with shell-on,
followed by frozen-peeled – these two make up well over 60% of the market – with other major
forms included frozen-breaded and frozen-prepared6.
4
http://www.intracen.org/itc/market-info-tools/trade-statistics/
5
https://www.st.nmfs.noaa.gov/commercial-fisheries/foreign-trade/applications/annual-product-by-
countryassociation
15Criterion 1: Data quality and availability
Impact, unit of sustainability and principle
▪ Impact: Poor data quality and availability limits the ability to assess and understand the
impacts of aquaculture production. It also does not enable informed choices for seafood
purchasers or enable businesses to be held accountable for their impacts.
▪ Unit of sustainability: The ability to make a robust sustainability assessment.
▪ Principle: Having robust and up-to-date information on production practices and their
impacts available for analysis.
Criterion 1 Summary
Data Category Data Quality Score (0-10)
Industry or production statistics 7.5 7.5
Management 5 5
Effluent 5 5
Habitat 5 5
Chemical use 5 5
Feed 5 5
Escapes 5 5
Disease 5 5
Source of stock 10 10
Wildlife mortalities 2.5 2.5
Introduced species 5 5
Other – (e.g. GHG emissions) Not Applicable n/a
Total 60.0
C1 Data Final Score (0-10) 5.45 Yellow
Brief Summary
Overall, the availability and quality of data regarding shrimp farming in Thailand is fair, despite
some significant data aggregation and gaps, given the variability and small-holder nature of the
industry. Uncertainty arises from a lack of information regarding the use of chemicals and the
feed supply chain, while there are also gaps in data regarding the enforcement of effluent laws,
escapes, and impacts to wild species through disease transfer and predator control. For the
most part, the data were able to provide a reasonable understanding of the Thai shrimp
industry, and the final score for Criterion 1 – Data is 5.45 out of 10.
Justification of Ranking
Industry or production statistics
16Aggregated industry and production statistics are readily available from the Department of
Fisheries (DOF), Thai Frozen Foods Association (TFFA), and FAO’s FishstatJ software.
Information regarding average farm size and the distribution of farms could be obtained from
the aforementioned sources, as well as from the literature. There is some uncertainty regarding
adoption rates of certain production methodologies within the “intensive” label (such as the
use of pond liners, multiple reservoirs, sediment disposal, etc.), but overall, data quality
regarding industry and production statistics is moderate-high and receives a score of 7.5 out of
10.
Management and Regulations
A significant amount of information was able to be obtained regarding legislation governing the
Thai shrimp industry from official Thai government websites6, unaffiliated websites7, the FAO
National Aquaculture Legislation Overview, literature, and personal contacts with government
officials. There are some gaps in understanding the intent and/or implementation of certain
legislation, despite using translation software, as well as limited information in some areas
regarding compliance and enforcement of the law. As such, data quality regarding management
and regulations is moderate and receives a score of 5 out of 10.
Effluent and Habitat
Information regarding farm siting and effluent discharge practices was able to be obtained,
though gaps in the data regarding enforcement remain. A general understanding of the location
of farms was obtained through visual tools like Google Maps and an official Thai government
database listing farm certifications and locations bolstered this. Reports from the Department
of Marine and Coastal Resources (DMCR) and Pollution Control Department (PCD) informed the
status of water quality and mangrove area and restoration, and overall confidence in the data
for these criteria is moderate. The data scores for the Effluent and Habitat criteria are both 5
out of 10.
Chemical Use
Detailed data regarding chemical use in Thailand were not able to be obtained, though a
general understanding of usage across the industry was developed through the literature and
personal contacts with government officials, farmers, and industry experts. Uncertainty in
actual chemical use exists due to the variability of the production methodologies amongst
farmers, as well as opaqueness in the chemical supply chain (e.g. brokers selling antibiotics as
probiotics). Little research has been done to understand the link between on-farm chemical use
and associated environmental impact, but water discharge in Thai shrimp farming systems is
limited, mitigating much of the environmental risk. The data quality and ensuing confidence in
understanding the nature of chemical use on Thai shrimp farms is moderate and scores 5 out of
10.
Feed
6
https://www4.fisheries.go.th/index.php/dof
7
www.thailaws.com
17Information regarding feed composition, conversation ratios, and the source of wild fish was
obtained through personal communications with the Thai Feed Mill Association (TFMA), private
feed manufacturers, industry experts, government officials, and the literature. Given the
proprietary nature of feed composition, estimates regarding the proximate and ingredient
composition were based on a range of data. Significant uncertainty remains regarding the
volume and source fisheries of whole-fish fishmeal ingredients, though data sources include
published literature, white papers, and personal communications with industry experts that
constrain the uncertainty to a reasonable degree. The data quality and confidence in the data is
moderate and scores 5 out of 10.
Escapes
Very limited information was obtained regarding the incidence or number of escaped shrimp.
The only source of information detailing these numbers were news reports and several studies
assessing the presence of L. vannamei in the wild in Thailand. Information regarding escape and
flood mitigation measures was obtained from the literature and personal communications with
government officials and industry experts. The body of literature assessing the competitive and
genetic risks to wild species posed by escaped shrimps in Thailand and elsewhere is moderately
robust. As such, the data score for Criterion 6 – Escapes is 5 out of 10.
Disease
There is a large body of literature and study detailing the pathogens, biosecurity measures,
disease control methods, and water exchange rates in the Thai shrimp industry, but there is
limited information regarding the risk and/or evidence of disease transfer to wild species.
Disease incidence rates were obtained from the literature, personal communications with
government officials, farmers, and industry experts, as well as quarterly reports from the
Network of Aquaculture Centers in Asia (NACA). Limited information regarding pathogen
prevalence amongst wild shrimp was obtained through the literature. As the focus of this
Criterion is on the risk of or actual impact of farm disease on wild populations, the availability
and quality of data is considered moderate and scores 5 out of 10.
Source of stock
As is the case for L. vannamei production globally, Thai farmed shrimp are produced from
domesticated broodstocks and are therefore independent of wild shrimp populations. There is
also information specific to the Thai industry available through personal communications
detailing selective breeding strategies and programs. The data score for Source of Stock is 10
out of 10.
Wildlife mortalities
No data are available regarding deliberate or accidental mortalities of any animals at shrimp
farms. Predator control methods in use on farms were understood through the literature and
personal contacts with government officials, farmers, and industry experts. The status of
potentially affected species was obtained through the literature and sources like the
International Union for Conservation of Nature (IUCN). Overall, the confidence in the data
18regarding the impact that predator control at shrimp farms has on wild species is poor, and the
score is 2.5 out of 10.
Escape of secondary species
Data regarding the international and/or trans-waterbody movement of live animals were
incomplete, though reasonable estimates were able to be made through limited literature and
personal communication with industry experts. The biosecurity of both source and destination
were somewhat uncertain, though well understood for the majority of the industry, given the
variability within the supply and production chains; again, limited literature sources were
available and personal communication with industry experts contributed to the understanding
of biosecurity. The confidence in the data is moderate, and scores 5 out of 10.
Conclusions and Final Score
Overall, the availability and quality of data regarding shrimp farming in Thailand is fair, despite
some significant data aggregation and gaps, given the variability and small-holder nature of the
industry. Uncertainty arises from a lack of information regarding the use of chemicals and the
feed supply chain, while there are also gaps in data regarding the enforcement of effluent laws,
escapes, and impacts to wild species through disease transfer and predator control. For the
most part, the data were able to provide a reasonable understanding of the Thai shrimp
industry, and the final score for Criterion 1 – Data is 5.45 out of 10.
19Criterion 2: Effluent
Impact, unit of sustainability and principle
▪ Impact: Aquaculture species, production systems and management methods vary in the
amount of waste produced per unit of production. The combined discharge of farms, groups
of farms or industries contribute to local and regional nutrient loads.
▪ Unit of sustainability: The carrying or assimilative capacity of the local and regional receiving
waters.
▪ Principle: Not allowing effluent discharges to exceed, or contribute to exceeding, the
carrying capacity of receiving waters at the local or regional level.
Criterion 2 Summary
Effluent Risk-Based Assessment
C2 Effluent parameters Value Score
F2.1a Waste (nitrogen) production per of fish (kg N ton-1) 59.12
F2.1b Waste discharged from farm (%) 20.00
F2.1b Boundary adjustment (0-1) 0.00
F2 .1 Waste discharge score (0-10) 8
F2.2a Content of regulations (0-5) 3
F2.2b Enforcement of regulations (0-5) 3
F2.2 Regulatory or management effectiveness score (0-10) 3.60
C2 Effluent Final Score (0-10) 6
Critical? No Yellow
Brief Summary
The discharge of shrimp farm effluent in Thailand is regulated under an area-based, cumulative
management system in conjunction with other industries. Receiving waterbodies are managed
to meet specific water quality standards based on their intended use and defined class, and
standards for discharge quality are defined for each contributing industry (inclusive of
aquaculture); however, there is uncertainty regarding the extent to which ecological
considerations, such as carrying capacity of the receiving waterbody, are considered in the
development of water quality standards. It is also unclear how small farms (Justification of Rating
Data quality and availability for effluent impacts is considered moderate (i.e. a Criterion 1 score
of 5 out of 10 for the effluent category) and therefore, the Risk-Based Assessment methodology
was utilized.
Intensive whiteleg shrimp culture in Thailand represented over 95% of Thailand’s total shrimp
production in 2018 (DOF, 2020). Higher stocking densities and increased feeding, characteristic
of intensive shrimp systems, frequently result in reduced water quality in ponds and discharge
of pond water has the potential to affect the surrounding waterbodies in the environment
where farms are sited (Nair 2015).
Thailand manages and measures water quality throughout the country through collaboration
between the Pollution Control Department (PCD) and Department of Fisheries (DOF). While
there is a great deal of information available regarding the water quality status of coastal
watersheds, there appears to be a lack of robust analysis relating whiteleg shrimp aquaculture’s
contribution to the overall impact, or lack thereof, to coastal watersheds. As such, the Risk-
Based Assessment method is used in this Criterion.
Factor 2.1 – Biological waste production per ton of shrimp
Factor 2.1a – Biological waste production
The Risk-Based Assessment method estimates the amount of waste nitrogen produced per ton
of whiteleg shrimp farmed.
Shrimp excrete waste primarily as a result of incomplete digestion and absorption of their
feeds, and only a small portion of the nutrients in feed are consumed, assimilated, and retained
for tissue growth. Early research by Briggs and Funge-Smith (1994) and Green et al. (1997)
indicated that only 24%–37% of the nitrogen (N) and 13%–20% of the phosphorus (P) from feed
was retained by shrimp. Similarly, Lorenzen (1999) also reported that 20%–40% of the fed
nitrogen was incorporated into shrimp tissue. These ranges are still considered valid today,
though considerable investment has gone into increasing the efficiency of shrimp feeds and
have resulted in higher phosphorus retention in shrimp (Dien et al., 2018; Van Nguyen and
Maeda, 2015).
To estimate the nitrogenous waste produced by shrimp, nitrogenous inputs and outputs are
calculated. Fertilizers are rarely used in intensive shrimp farming in Thailand, as the shrimp
receive all required nutrition from formulated feeds (Boyd et al., 2017).
The following data were provided by the Thai Feed Mill Association (TFMA), as well as gathered
from personal communications with Charoen Pokphand (a major producer of Thai shrimp feed)
and Rubicon Resources (a major US importer of Thai shrimp). The provided data were found to
be aligned with and supported by information from the listed primary literature, and are used
in the calculations for this criterion:
21a) Protein content of feed: 30 – 65% (Boyd et al., 2017; pers. comm. TFMA, 2018; pers.
comm. Robins McIntosh, Charoen Pokphand, 2018; pers. comm. Nick Leonard, Rubicon
Resources, 2018)
b) Economic Feed Conversion Ratio (eFCR): 1.3 – 1.6 (Boyd et al., 2017; pers. comm. TFMA,
2018; pers. comm. Robins McIntosh, Charoen Pokphand, 2018; pers. comm. Nick
Leonard, Rubicon Resources, 2018)
c) Protein content of harvested whole shrimp – 17.8% (Boyd et al., 2007)
For the purposes of this assessment, a protein content of 36.5% and an eFCR value of 1.5 are
considered representative of the Thai whiteleg shrimp farming industry – please see Criterion 5
– Feed for further details regarding these figures. The calculations that were carried out using
these figures and used in assessing the production and effects of effluents are:
N input per ton of shrimp produced = a x N content factor (0.16) x b x 10 = 87.60 kg N t-1
N content of harvested shrimp = c x N content factor (0.16) x 10 = 28.48 N t-1
Waste N produced per ton fish produced (2.1a) = N input – harvested N = 59.12 kg N t-1
Therefore, the net excretion of nitrogen in soluble and particulate wastes is 59.12 kg N per ton
of whiteleg shrimp production.
Factor 2.1b – Production system discharge
Historically, pond management schemes resulting in daily water exchange rates of >10% and
discharge at harvest were characteristic of the Thai shrimp farming industry (SFW, 2010;
Flaherty and Vandergeest, 1999).
Today, the majority of Thai shrimp pond systems are low-exchange and periodically discharge
water throughout a cycle and harvest that results in an average exchange rate ofnakorn et al. 2017; pers. comm. Robins McIntosh, Charoen Pokphand, 2018; pers. comm. Nick
Leonard, Rubicon Resources, 2018). Residence times in sedimentation basins vary, and
reported values range from as low as 12 hours to greater than one week (pers. comm. Robins
McIntosh, Charoen Pokphand, 2018; Seafood Watch field research, March 2018). This warrants
the application of adjustments to the basic production system discharge score by -0.14 and -
0.08, for the use of a settling pond for daily exchange and harvest discharge, respectively, as
determined by the Seafood Watch Aquaculture Standard.
Sediment/sludge that settles in these basins is then removed, yet its fate is uncertain.
Historically (pre-2013), settled material was used to rebuild dikes, as the composition of this
material was equal amounts sludge (organic waste material, such as uneaten feed or feces) and
sediment (pond walls washed away with exchange) (pers. comm. Robins McIntosh, Charoen
Pokphand, 2018). Today, however, with generally reduced water exchange in ponds and an
increased number of ponds utilizing pond liners, the primary composition of settled material is
organic sludge material, which does not make good building material (pers. comm. Robins
McIntosh, Charoen Pokphand, 2018). It was suggested that most of this sludge is used as an
organic soil amendment for nearby agricultural farms, but its usability would depend on its
salinity (pers. comm. Robins McIntosh, Charoen Pokphand, 2018); otherwise, it may be brought
to a disposal area or spread around a marsh area (pers. comm. Robins McIntosh, Charoen
Pokphand, 2018; Yuvanatemiya et al., 2011), though no information could be found regarding
the suitability of these sites. It is noteworthy that the Thai GAP for marine shrimp, to which
certification is required for shrimp producers selling to exporting processors, mandates that
sediment shall not be disposed of in public or “non-permitted” areas (MoAC, 2014); however,
the effectiveness and enforcement of this standard is somewhat uncertain (more in Factor
2.2b). As such, the application of an adjustment for proper sludge disposal is not warranted at
this time.
Considering the adjustments detailed above (i.e. 0.42 – 0.14 – 0.08, meaning 0.20 or 20% of the
waste produced by the shrimp is considered to be discharged to the environment), the
estimated total waste discharged per ton of shrimp produced is 11.8 kg N t-1. This equates to a
final score for Factor 2.1 – Waste discharged per ton of shrimp of 8 out of 10.
Factor 2.2 – Management of farm-level and cumulative impacts
Factor 2.2a – Content of effluent management measures
In this factor, effluent regulations or other management measures are considered to assess
how discharged wastes from shrimp farms are being managed at the farm and industry level.
Effluents from shrimp farms are regulated at the national, provincial, and district level, with
legislation primarily administered and enforced through the Department of Fisheries (DOF),
housed within the Ministry of Agriculture and Cooperatives (MoAC) in conjunction with several
other government bodies, such as the Ministry of Natural Resources and Environment
(MoNRE). The DOF has a main office in Bangkok, with a provincial office in each of the 76
23provinces, 22 of which are coastal8. Each province has a Provincial Fishery Officer, as well as
multiple District Fishery Offices (527 total in Thailand) and officers; the District Office and its
officers report to the Provincial Officer, which in turn reports to the central Department of
Fisheries office.
The Royal Ordinance on Fisheries of 2015 is the broad legislative framework governing the
management of aquatic resources in Thailand, inclusive of shrimp farming; this Ordinance
repealed and replaced The Fisheries Act (2015), which was first enacted in 1947 (FAO, 2018b).
Through this Ordinance, a National Fisheries Committee was established to develop fisheries
and aquaculture policies, in addition to prompting the developing Provincial Fisheries
Committees (PFCs); PFCs are authorized to designate aquaculture zones, as well as to issue
notifications/legislation regarding aquaculture production, post-harvest, and processing
activities within each province (Fishery Royal Ordinance, 2015).
The primary piece of legislation regulating shrimp farm discharges is the Enhancement and
Conservation of Environmental Quality Act of 19929, by which the MoNRE is granted the
authority to determine water quality standards for sea, ground, and underground waters (FAO,
2018b). The MoNRE also has the authority to regulate wastewater discharges from point
sources in all sectors, inclusive of aquaculture; water quality standards for discharges from
multiple sectors were developed and adopted in 200410 (FAO, 2018b). Farmed L. vannamei are
considered a coastal aquaculture species, and as such, effluent discharges from shrimp ponds
are subject to the effluent quality standard for coastal aquaculture (Table 1). It is unclear how
the parameter thresholds were determined, and whether there was any ecological
consideration in their development. This standard is enforced by the DOF and the Pollution
Control Department (PCD), housed within the MoNRE (FAO, 2018b), at the district and
provincial level. Of note, these water quality standards were incorporated into the ThaiGAP
standard in 2014, a country-level “best aquaculture practices” certification that is indirectly
required of farms producing for export; shrimp processing facilities are required to implement
Hazard Analysis and Critical Control Points (HACCP) plans, and part of this requirement is to
only source shrimp from ThaiGAP certified farms (pers. comm. Dr. Putth Songsanjinda, DOF,
2018).
Farms equal to or over 10 rai (1.6 ha) (the average intensive L. vannamei farm in Thailand in
2018 was 11.4 rai, see DOF, 2020) are required to inform the district and/or provincial DOF
office of intent to discharge water, and must supply a water sample to the DOF for testing
(pers. comm. Dr. Adisorn Promthep, DOF, 2018). Approval for discharge is not granted unless
the sample test meets the aforementioned water quality standards (shown in Table 1) (pers.
comm. Dr. Adisorn Promthep, DOF, 2018). It is unclear, though, how this process varies at the
district and/or provincial level; various personal communications with industry experts and
8
https://www4.fisheries.go.th/index.php/dof_en/view_role/1
9
http://portal.mrcmekong.org/assets/documents/Thai-Law/Enhancement-and-Conservation-of-National-
Environmental-Quality-Act-(1992).pdf
10
http://www.wepa-db.net/policies/law/thailand/std_coastal_aqua.htm
24farmers highlighted a diversity of practice and regulation regarding reporting and testing,
though the requirement for discharge water to meet water quality standards was constant
(pers. comm. Dr. Rawee Viriyatum, 2018; Seafood Watch field research, March 2018). Farms
under 10 rai are not covered by these regulations, and it is unclear whether there are any
controls regarding effluent discharges for farms of this size.
Table 1. Effluent water quality standard for coastal aquaculture11
Parameter Range or Maximum Permitted Values
pH 6.5 – 9.0
Biochemical oxygen demand (BOD) 20.0 mg L-1
Suspended solids (SS) 70.0 mg L-1
Ammonia nitrogen (NH3-N) 1.10 mg L-1
Total phosphorus (TP) 0.40 mg L-1
Hydrogen sulphide (H2S) 0.01 mg L-1
Total nitrogen (TN) 4.00 mg L-1
In addition to water quality standards for effluent discharges, Thailand has also developed
quality standards for surface water (established in 1994), groundwater (established in 2000),
and seawater (established in 2006), as mentioned above. There are six coastal water quality
and five surface water quality classes, with specific quality standards for each12. It is unclear if
these standards were developed with ecological considerations, such as carrying capacity.
Further, while waterbodies are required to meet specific water quality standards based on their
intended use, there is no indication that pollution allocations have been developed for the
industries discharging into these waterbodies. Shrimp farms are sited in areas defined as
aquaculture zones, as legislated by the Royal Ordinances on Fisheries (2015), yet these zones
may feature waterbodies of various classifications. Therefore, it is possible for shrimp farm
discharges to enter waterbodies of higher water quality standards, with no indication of any
limits to the cumulative discharges of multiple shrimp farms and other contributing industries,
like agriculture or manufacturing.
Additionally, while the MoNRE is also granted authority to determine which types of
projects/activities require an Environmental Impact Assessment (EIA), aquaculture is not
currently included as a designated activity requiring an EIA to be conducted 13 (FAO, 2018b). This
is discussed further in Criterion 3 – Habitat.
Broadly, discharges from shrimp ponds are regulated under an area-based, cumulative
management system in conjunction with other industries in Thailand; receiving waterbodies are
managed to meet specific water quality standards based on their intended use and defined
11
http://seaisi.org/thumbnail/a2d48bd75c37da42970ca2b30b0bd69a.pdf
12
https://docplayer.net/62421493-Water-quality-standards.html; Source : Notification of the National
Environment Board No.8, B.E.2537 (1994), which was issued under the Enhancement and Conservation of National
Environmental Quality Act B.E.2535 (1994) dated January 20, B.E.2537 (1994), and published in the Royal
Government Gazette, Vol.111, Part 16 D, dated February 24, B.E.2537 (1994).
13
https://www.boi.go.th/upload/content/ENVIRONMENTAL%20.EGULATIONS_28083.pdf
25class, and standards for discharge quality are defined for each contributing industry (inclusive of aquaculture). However, there is uncertainty regarding the extent to which ecological considerations, such as carrying capacity of the receiving waterbody, is considered in the development of water quality standards. It is also unclear how small farms (
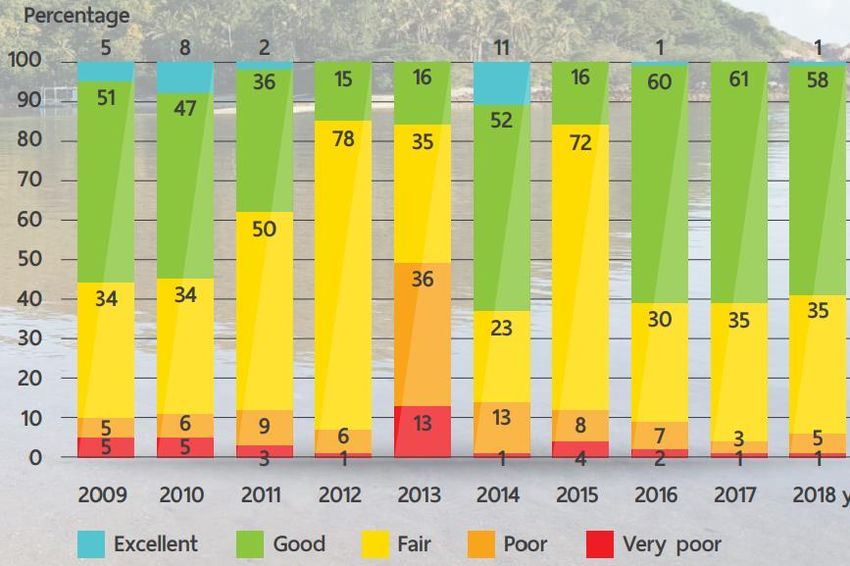
Figure 4. State of coastal water quality in Thailand, 2009 – 2018; image sourced from Thailand State of
                                          Pollution Report 2018.

                                                  27
Figure 5. State of surface water quality in Thailand, 2009 – 2018; image sourced from Thailand State of
Pollution Report 2018.
Marine shrimp aquaculture has occasionally been listed as a contributor to pollution leading to
various parameters failing to meet water quality standards, despite the regulations intended to
prevent discharge of effluent water that does not meet the coastal aquaculture effluent
standard. Communications with industry experts, farmers, and representatives of the DOF
indicated that farms (>10 rai in area) are not allowed to discharge without first having effluent
water tested by DOF/PCD officers, but this process – how samples are taken and tested, how
long it takes, how results are communicated, etc. – is fairly ambiguous, with somewhat
inconsistent information communicated by different stakeholders. If the farm is ThaiGAP
certified and found to have not complied with the standards requirements (which feature
identical discharge standards and testing requirements to the aforementioned effluent coastal
aquaculture Standard), ThaiGAP certification is lost, the farmer cannot reapply for a period of
180 days, and is subject to being placed on a watch list and follow up audits (pers. comm. Dr.
Putth Songsanjinda, DOF, 2018). General penalties for noncompliance amongst non-ThaiGAP
certified farms are unknown.
The effectiveness of the DOF and PCD to enforce shrimp farm effluent standards is considered
high, despite some concerns regarding human capacity limitations and a lack of sufficient
resources (Pornpinatepong et al., 2016). This is supported by frequent interactions between
farmers and officers and literature indicating that the DOF and PCD are effectively enforcing
28shrimp farm discharges (Seafood Watch field research, March 2018; Bottema et al., 2018; Bueno, 2018; Uppanunchai et al., 2016; Pornpinatepong et al., 2016), alongside the recent trend of moderately improving water quality. Overall, enforcement of effluent discharge regulation appears to be moderately effective. Enforcement organizations are identifiable and contactable, with activity at the area-based scale and coverage of the entire production cycle. Evidence of monitoring is clear, though evidence of penalties for infringements and compliance violations are absent. There are also some questions as to the enforcement capacity of the DOF and PCD relative to the scale of the industry, given some concerns regarding a lack of sufficient resources and human capital. Despite this, water quality in Thailand appears to be improving to some degree over the last five years due to the declining fractions of poor and very poor water classifications. As such, the enforcement of effluent discharges from shrimp farms is considered moderately effective. The final score for Factor 3.2b – Enforcement of effluent management measures is 3 out of 5. The final score for Factor 2.2 is a combination of Factor 2.2a (3 out of 5) and Factor 2.2b (3 out of 5), and results in a final score of 3.6 out of 10. Conclusions and Final Score Shrimp farm effluent discharges in Thailand are regulated under an area-based, cumulative management system in conjunction with other industries; receiving waterbodies are managed to meet specific water quality standards based on their intended use and defined class, and standards for discharge quality are defined for each contributing industry (inclusive of aquaculture). However, there is uncertainty regarding the extent to which ecological considerations, such as carrying capacity of the receiving waterbody, is considered in the development of water quality standards. It is also unclear how small farms (
Criterion 3: Habitat
Impact, unit of sustainability and principle
▪ Impact: Aquaculture farms can be located in a wide variety of aquatic and terrestrial habitat
   types and have greatly varying levels of impact to both pristine and previously modified
   habitats as well as to the critical “ecosystem services” they provide.
▪ Unit of sustainability: The ability to maintain the critical ecosystem services relevant to the
   habitat type.
▪ Principle: Being located at sites, scales and intensities that maintain the functionality of
   ecologically valuable habitats.

Criterion 3 Summary
 C3 Habitat parameters                                                    Value         Score
 F3.1 Habitat conversion and function (0-10)                                              4
 F3.2a Content of habitat regulations (0-5)                                 4
 F3.2b Enforcement of habitat regulations (0-5)                             3
 F3.2 Regulatory or management effectiveness score (0-10)                               4.80
 C3 Habitat Final Score (0-10)                                                          4.27
                                                             Critical?     No          Yellow

Brief Summary
Shrimp farm siting in Thailand is controlled and restricted to shrimp aquaculture zones, though
it is unclear to what degree ecological considerations were factored into the zoning process. All
farms are required to register with the DOF and obtain a license prior to operation, and
mangrove deforestation for the construction of aquaculture ponds is illegal. The government
also is actively working to reclaim land and restore mangroves in affected areas, and has
restored over 100,000 hectares since the lowest point in 1996. Enforcement of siting and
mangrove conservation laws is somewhat limited due to a lack of capacity. The score for
Criterion 3 – Habitat is a combination of the scores for Factor 3.1 – Habitat conversion and
function (4 out of 10) and Factor 3.2 – Farm siting regulation and management (4.8 out of 10),
and the final score is 4.27 out of 10.

Justification of Rating

Factor 3.1 – Habitat conversion and function
Shrimp aquaculture in Thailand takes place in the coastal zones of central, southern, and
eastern Thailand, all areas originally consisting of dense mangrove forests, totaling nearly
375,000 hectares (ha) in size in the 1960s (Iwasaki and Teerakul, 2017; Pumijumnong, 2014;
MFF, 2011). The multiple ecosystem services that mangroves provide cannot be overstated:
their submerged roots provide a nursery and breeding ground to many marine species; they
provide protection against storm surges in the face of floods and cyclones; they stabilize
shorelines; they sequester carbon; and provide fuel, medicine, and construction materials to

                                                30
You can also read