Collision Course: The Hazards of Lighted Structures and Windows to Migrating Birds - FLAP Canada
←
→
Page content transcription
If your browser does not render page correctly, please read the page content below
Collision Course:
The Hazards of Lighted Structures and
    Windows to Migrating Birds

           A special report for
       World Wildlife Fund Canada
           and the Fatal Light
           Awareness Program
             September 1996

   Duotone that is not too dark here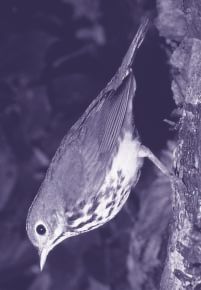
The Author
This report was written by Lesley J. Evans Ogden
for World Wildlife Fund Canada (WWF)
and the Fatal Light Awareness Program (FLAP).
Lesley received her M.Sc. in Biology from York University
and her B.Sc. in Zoology from the University of Toronto.
She specializes in the behaviour, ecology and conservation
of neotropical migrant birds. She currently works as a
research consultant and freelance writer and has been
involved in a wide range of conservation projects with
World Wildlife Fund Canada.

Collision Course: The Hazards of Lighted Structures
and Windows to Migrating Birds
Published by World Wildlife Fund Canada
and the Fatal Light Awareness Program.
September 1996
46 pages

For more information or to obtain additional copies
of this report at a cost of $10 each, please contact:
World Wildlife Fund Canada
90 Eglinton Avenue East, Suite 504
Toronto, Ontario M4P 2Z7
tel: (416) 489-8800
fax: (416) 489-3611

Partial reproduction of the contents of this document
is permitted, with indication of the source.

Cover Photos: Buildings – FLAP;
Ovenbirds in hand – Alan Cairns / The Toronto Sun;
Ovenbird – WWF / Edgar T. Jones.

i

                                                       Preface

In an annual ritual observed for millennia, hundreds of millions of birds arrive each spring in Canada to choose their breeding
grounds, only to return to warmer climes in autumn. Covering return flight distances of up to 25,000 kilometres, migratory
birds make a truly extraordinary effort.

Only in this century, and therefore suddenly in evolutionary time-scales, have migrating birds faced collisions with artificial
obstacles along their flight paths: buildings and other towering structures covered in glass and lit at night. In the dark, and
especially in foggy or rainy weather, the combination of glass and light becomes deadly. Confused by artificial lights, blinded
by weather, and unable to see glass, birds by the hundreds and even thousands can be injured or killed in one night at one
building. Over 100 different species of birds have collided with buildings in Toronto alone. One expert estimates that across
North America, up to 100 million birds die in collisions each year. Many species that collide frequently are known to be in
long-term decline and some are already designated officially as threatened.

For these reasons, World Wildlife Fund Canada (WWF) and the Fatal Light Awareness Program (FLAP) have formed a new
partnership, and jointly published Collision Course: The Hazards of Lighted Structures and Windows to Migrating Birds. Formed in
1993, FLAP continues a 30-year tradition in Toronto of rescuing birds trapped in the city’s downtown core following late-
night collisions with tall buildings: in the wee hours of the morning, volunteers scour plazas and sidewalks beneath skyscrap-
ers for dead, injured or disoriented birds, and later release the survivors back to the wild. WWF, dedicated to wildlife conser-
vation in both the temperate and tropical worlds, seeks to identify emerging issues and advocate practical solutions for the
long-term protection of wildlife at risk.

Compared to habitat loss, pollution, and over-hunting, the issue of building collisions is neither well-known nor adequately
understood. Yet across North America, more birds die from collisions each year than succumbed to the Exxon Valdez oil spill.
As author Lesley J. Evans Ogden points out in Collision Course, bird collisions is a continent-wide issue affecting millions of
birds. Her research experience with migratory species, combined with a commitment to conservation, show us what lessons
can be learned and applied. In principal, it is delightfully simple to prevent collisions: by night, turn out the lights; by day,
make windows visible to birds. In practice, solutions require commitment and action from building owners, managers and
tenants in the short-run, and new approaches to office environments by architects, engineers and designers in the long-run.

Responding to the call to action in Collision Course, FLAP and WWF will campaign to make Toronto the first “bird-friendly”
city in North America. Royal Bank of Canada, which generously sponsored publication of Collision Course, is leading the reform
of building management practices in Toronto, with the goal of minimizing escaped light at night and thus bird
collisions at the Royal Bank Plaza office towers. When we consider that a bird flying north from the Gulf of Mexico to eastern
Canada stands a 70 percent chance of encountering at least one urban area, it is clear that other buildings and other cities must
take up the challenge, too. Those who do will find Collision Course their starting point.

Steven Price                                                             Michael Mesure
Director, International Program                                          Founding Member
World Wildlife Fund Canada                                               Fatal Light Awareness Program
Toronto, Canada September, 1996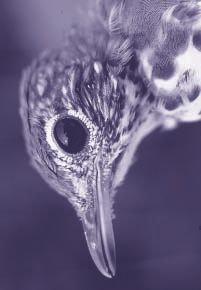
Table of Contents

Preface . . . . . . . . . . . . . . . . . . . . . . . . . . . . . . . . . . . . . . . . . . . . . .i   Conclusions . . . . . . . . . . . . . . . . . . . . . . . . . . . . . . . . . . . . . . . .32

Executive summary . . . . . . . . . . . . . . . . . . . . . . . . . . . . . . . . . .2                 Author’s acknowledgements . . . . . . . . . . . . . . . . . . . . . . . . . .34

Introduction to the problem . . . . . . . . . . . . . . . . . . . . . . . . . . .4                     References . . . . . . . . . . . . . . . . . . . . . . . . . . . . . . . . . . . . . . . . .35

Migration . . . . . . . . . . . . . . . . . . . . . . . . . . . . . . . . . . . . . . . . . . .6       Appendices
                                                                                                       1.       Bird collision literature summary table . . . . . . . . . . . .38
FLAP – Toronto case study . . . . . . . . . . . . . . . . . . . . . . . . . .9
         Migratory bird collisions in Toronto . . . . . . . . . . . . . . . .9                         2.       List of species recorded by FLAP . . . . . . . . . . . . . . . . . .44
         1993-1995 data . . . . . . . . . . . . . . . . . . . . . . . . . . . . . .12

The broader picture . . . . . . . . . . . . . . . . . . . . . . . . . . . . . . . . .16
                                                                                                       Tables
Significance of the problem . . . . . . . . . . . . . . . . . . . . . . . . . .17                      1.       Numbers of birds found near tall Toronto
                                                                                                                buildings during migration (1993-1995) . . . . . . . . .13
Effects of light on nocturnal migrants . . . . . . . . . . . . . . . . .19
         Migratory bird navigation . . . . . . . . . . . . . . . . . . . . . .19                       2.       Ten most frequent species found near tall Toronto
         Light attraction behaviour . . . . . . . . . . . . . . . . . . . . . . .21                             buildings during migration (1993-1995) . . . . . . . . .13

Windows as an avian hazard . . . . . . . . . . . . . . . . . . . . . . . . . .24                       3.       Ranking of abundance of birds found near tall
                                                                                                                Toronto buildings during migration (1993-1995),
Species-specific vulnerability . . . . . . . . . . . . . . . . . . . . . . . . .25                              categorized by sub-family . . . . . . . . . . . . . . . . . . . . . . . .14

What can be done – solutions and recommendations . . . .27                                             Figures
         Lights and nocturnal migrants . . . . . . . . . . . . . . . . . . .27                         1.       Major urban areas of Canada and the U.S.
         Recommendations regarding lighting . . . . . . . . . . . . . .29                                       – A threat to migrating birds . . . . . . . . . . . . . . . . . . . . .5
         Windows . . . . . . . . . . . . . . . . . . . . . . . . . . . . . . . . . . . . . .29
                                                                                                       2.       Area monitored by the Fatal Light Awareness
Summary of recommendations . . . . . . . . . . . . . . . . . . . . . . . .31                                    Program in Toronto’s downtown core . . . . . . . . . . . . . .10
         Lights . . . . . . . . . . . . . . . . . . . . . . . . . . . . . . . . . . . . . . . .31
         Windows . . . . . . . . . . . . . . . . . . . . . . . . . . . . . . . . . . . . . .31         3.       A bird’s eye view of Toronto’s downtown core . . . . . . . .11
2 T h e Ha za rd s of L ig h ted Stru ctu res an d Win d ows to Mig ra tin g Bird s
Executive summary
The collision of migrating birds with human-built structures and windows is a
world-wide problem that results in the mortality of millions of birds each year
in North America alone. Birds killed or injured at such structures are due to
two main factors. The first of these is the lighting of structures at night, which
“traps” many species of nocturnal migrants. The second factor contributing to
the hazard is the presence of windows, which birds in flight either cannot de-
tect, or misinterpret. In combination, these two factors result in a high level of
direct anthropogenic (human-caused) mortality. Bird mortality at human-built
structures receives relatively little public attention, but structural hazards are
actually responsible for more bird kills than higher profile catastrophes such as
oil spills. The purpose of this report is to summarize what is currently known
about migratory bird collisions, to investigate the seriousness of the threat, to
present data on migratory bird mortality in central Toronto, and finally to
make preliminary recommendations on how to help eliminate the problem.
The collision of migrating birds with human-built structures and windows is a world-wide
problem that results in the mortality of millions of birds each year in North America alone.
A large proportion of migrating birds affected by human-built structures are
songbirds, apparently because of their propensity to migrate at night, their low
flight altitudes, and their tendency to be trapped and disoriented by
artificial light, making them vulnerable to collision with obstructions. In many
species of songbirds known to be undergoing population declines, extra anthro-
pogenic mortality may be an important conservation issue.
A group of volunteers known as the Fatal Light Awareness Program (FLAP)
have been collecting birds killed and injured by nocturnal collisions during mi-
page 2 photo: WWF / Edgar T. Jones; page 3 photo: Ted Almond
gration seasons in the downtown district of Toronto since 1993. FLAP has
recorded an average annual total of 1,818 birds adversely affected by artificial
light, and an average annual mortality rate of 732 birds. These figures are mini-
mum estimates only, since collection does not occur every day and only a small
portion of central Toronto is searched. During 1993-95, 100 different species
were recorded by FLAP. This phenomenon is not an isolated one, with bird killsEx ecu tiv e su mmar y 3
reported at various types of structures across North America and worldwide. A
single tall building in Chicago checked daily during migration seasons has
caused an average of 1,478 bird deaths annually, and over a period of 14 consec-
utive years, the cumulative kill amounted to 20,697 birds.
Further research is necessary to clearly determine why nocturnal migrants are
trapped by sources of artificial light. However, birds rely heavily on vision
during nocturnal migration and artificial lights apparently interfere with their
ability to see the landscape clearly.
With respect to tall office buildings, the obvious solution to migratory bird
mortality from collisions is to turn out the lights at night during migration
seasons. Where lights are required at structures for the safety of air or marine
traffic, the use of flashing white lights (rather than continuous light, red light,
The obvious solution to migratory bird mortality from collisions is to
turn out lights at night during migration seasons.
or rotating beams) will reduce the danger to migrating birds. There is no evi-
dence that coloured lights are more effective than white lights at reducing the
degree of threat to birds. With respect to windows, the only effective way to
prevent bird strikes is to make the glass more visible from the outside with the
use of external window coverings. Modifications to make panes of glass tinted
and non-reflective, or to incorporate non-reflective interference zones, are
additional possibilities.
Migration exposes birds to many natural hazards, but the degree of anthro-
pogenic mortality incurred at artificial obstacles, in concert with other fac-
tors such as degradation of breeding, stopover, and wintering habitats, neces-
sitate serious consideration of this world-wide problem and the initiation of
effective solutions.4 T h e Ha za rd s of L ig h ted Stru ctu res an d Win d ows to Mig ra tin g Bird s
Introduction to the problem
Human-built structures have been recognized as a hazard to ing food once trapped in an urban environment may present an
birds for more than a century (Cooke, 1888; Kumlien, additional threat.
1888). However, the accelerated rate of urban development Windows are the second major factor rendering structures
in recent years has seen the proliferation of radio and televi- potentially lethal to birds. Available evidence suggests that
sion towers, office buildings, power lines, cooling towers, windows are not visible to birds (e.g. Klem, 1989), and thus
emission stacks, and residential housing, all of which repre- the presence of either reflective or clear plate glass in the
sent an increasing threat to flying birds. The major factors flight path of a bird causes death or injury due to impact at
contributing to the perilous nature of human-built struc- high velocity. Windows represent not only a day-time colli-
tures are: (1) the presence of artificial lights at night; and sion hazard for birds, but are the medium through which
(2) the presence of windows, which are potentially haz- light is transmitted at night from office towers and other
Birds migrating at night are trapped by sources of artificial light and
become vulnerable to collisions with lit structures.
ardous both day and night. Power lines buildings. Window invisibility and light
pose both an electrocution and collision thus compound the potential danger of
hazard to birds, particularly to raptors, but night-time collisions.
this issue has been widely studied (e.g. Resident bird species living alongside
Bevanger, 1994) and will not be dealt with humans face a constant threat from human-
in this report. built structures, and it has been suggested
Birds migrating at night are strongly at- that while rare, some individuals may actu-
tracted to, or at least trapped by, sources of ally learn to avoid such threats through ex-
artificial light, particularly during periods perience (Klem, 1989). Migrating birds,
of inclement weather (e.g. Verheijen, 1958, however, face such risks wherever human-
1985). Approaching the lights of light- built structures occur along their migratory
Ted Almond
houses, floodlit obstacles, ceilometers (light flight path, and are likely more vulnerable
beams generally used at airports to deter- than resident birds to collisions and poten-
mine the altitude of cloud cover), communi- tially fatal disorientation. The entrapment
cation towers, or lighted tall buildings, they become vulnera- of nocturnally migrating birds by areas of artificial light
ble to collisions with the structures themselves. If collision is sources is a particularly serious problem, and light is proba-
avoided, birds are still at risk of death or injury. Once inside a bly the single most important factor in rendering a structure
beam of light, birds are reluctant to fly out of the lighted area a potent killer to such species (K. P. Able, personal commu-
into the dark (Graber, 1968), and often continue to flap nication). The unnatural threat of human-built structures to
around in the beam of light until they drop to the ground such migrants, with reference to both nocturnal and diurnal
with exhaustion (Weir, 1976, and references therein). A sec- hazards, constitutes the focus of this paper.
ondary threat resulting from their aggregation at lighted struc- To understand the threat posed by human-built structures
tures is their increased vulnerability to predation (e.g. to migrating birds, it is necessary to first understand some
Stoddard and Norris, 1967; this study). The difficulty of find- basic concepts about migration.Figure 1
Major urban areas of Canada and the U.S. – A threat to migrating birds
Cities with an east-west distance
greater than 25 km and a population
greater than 1,000,000.
Cities with an east-west distance
greater than 25 km and a population
between 100,000 and 1,000,000.
Cities with an east-west distance
less than 25 km and a population
VA
over 100,000. NCO
UV
ER
SEA
EveTTLE Spok Winnipeg
rett – ane
PO
RT
LA ND Fargo –
Moorehead
125° W
S
OA ACRA
FR SA KLAN MEN
AN N D TO
CIS DENVER
CO
Sa
Se linas SAN Visa
Mo aside – – JOS li
nter E Porta – Tul
ey ervi are –
San lle
ta B
Oxn arbara
ard – Sa
– V nta
entu Ma
LOS ra – ria – Oklahoma City
AN Sim Lom Albequerq
GEL i Va poc ue
ES lley PHO
SAN ENIX
DIE
GO
Tucso
120° W n
DALL
FT. W
El Paso
SAN ANTONIO
Brownsv
Harling
San Be
115° W 110° W 105° W 100° W125°W
120°W
115°W
110°W
105°W
100°W
95°W
90°W
85°W
80°W
75°W
70°W
65°W
60°W
55°W
Vancouver Denver Dallas Chicago Toronto Boston Halifax
Projection of all major urban areas onto one line of latitude, amounting to 41% of North America’s horizon.
55° W
er Bay
Thund L
ÉA 60° W
NTR
y MO
Su dbur
ll
-Hu
awa
Ott N
– oy
NTO any – Tr STO
O Albctady BO
MINNEAPOLIS – TOR ne RK
ST. PAUL S che YO
falo EW
- Buf N
ines nton
T C a thara Falls Scra y –
AUKE
E I
RO St.Niagar Cit ille
MILW DET ND – w n – ston r sey illv 65° W
ELA wn t o E a J e
d–
M
E V n gstoren n
Allehem – lan
GO
CHICA E. Chicag–
o– CL u
Yo War
e t h le
s b u rg V ine dgeton wel
l
Gary ond S G H B Harri Bri H ope
nd – U R
Rock Islane – Hamm UMB TSB
U
RE ts. – ton
Moli ort COL PIT I MO n ial H Hamp
Davenp I – LT d l o
NAT BA chmon g – Co ews –
POLI
S CIN N – Ri r N
ANA CIN MILTO ON rsbu port
INDI HA DDLET e
Pet New
M I
ston – lk – h –
g t o n – Charle n s borolem – N orfoa Beac th
ti n e
KANSAS CITY IS Louis
ville HunAshland Gre ston Saoint i u
gin mo
ST. LOU Win Highp – Vir Ports 70° W
h a m
Dur aleigh
te – R
h a rlotonia
C ast
ille G
is Nashv ville
–
Memph L A NTA G reentanburg
AT Spa r
gham
Birmin
S
RLEAN
NEW O LE -
OUSTON RDA
Beaumont – L A UDEWOOD 75° W
AY – FT. HOLLY
Port Arthur – PA B URG
Orange TAMETERSB MI
MIA
ST. P
95° W 90° W 85° W 80° WIn trod u ction to the pr o bl e m 5
Migratory bird mortality result-
ing from collisions with buildings
probably occurs in every major
WWF / Edgar T. Jones
city throughout North America.
The presence of urban areas along the routes of migrating birds
in flight can be imagined in the following way: If the east-
west width of all Canadian and American cities over 100,000
in population is projected onto one line (i.e. a single imaginary
“horizon” from a bird’s-eye view), then the aggregate width of
these large urban areas is equivalent to 41 percent of the total
east-west width of North America measured from its most
easterly and westerly points (see figure 1 inside).6 T h e Ha za rd s of L ig h ted Stru ctu res an d Win d ows to Mig ra tin g Bird s
Migration
Bird migration is a world-wide phenomenon. During migra- Moore, 1989). Nocturnal migration may also reduce the risk
tion, some 50 million birds passing over the coast of the of predation for small birds. Categories of night-time and
southern United States can be seen on radar screens over the day-time migrants are not necessarily mutually exclusive at
course of a few hours (Gauthreaux, 1994). In southern either the species or population level (Martin, 1990), with
Ontario, a long-term study of migration over the Toronto area some individuals migrating at different times than others.
found that southbound migration traffic rates in autumn are Physiological preparation for migration is crucial for an in-
highly variable, ranging from zero to almost 30,000 birds per dividual’s survival through a period of extreme physical exer-
kilometre of migration front per hour (Richardson, 1982). tion, particularly for long-distance migrants that make non-
Migration in North America is mainly south to north dur- stop flights. Prior to migration, birds spend considerable
ing spring, and north to south during fall, as birds make their time gorging to build up fat reserves (e.g. Alerstam, 1994).
way to their breeding and wintering grounds, respectively. In Fat deposits are stored subcutaneously and in the body cavity
North America, peak migration occurs between March and (Meier and Fivizzani, 1980). Deposits of fat, a highly concen-
May in spring, and between August and October in autumn trated and lightweight form of energy, allow birds to fly for
(Weir, 1976). Migration distances vary widely, with some long periods of time without having to stop to “refuel.”
species or populations traveling relatively short distances, and Different species use different physiological migration strate-
others migrating from nearly pole to pole (Alerstam, 1994). gies. Some species store small fat reserves and migrate in
Some birds make a series of short flights, while others fly huge short stages. Others, particularly those species that must tra-
distances without stopping. For example, certain populations verse inhospitable terrain such as deserts or open ocean, store
of the northern wheatear (Oenanthe oenanthe) make non-stop 24- large fat reserves. To compensate for the weight of additional
hour journeys across the Atlantic Ocean (Martin, 1990), fat, some species also build up their flight muscles prior to
whereas species such as the Swainson’s thrush (Catharus ustula- migration (Bibby and Green, 1981).
tus) apparently adopt a “feed-by-day, fly-by-night” strategy, Entrapment in urban areas during migration has poten-
making numerous stop-overs en route (Winker et al., 1992). tially dangerous physiological consequences for migrants.
Migration behaviour is thus highly variable. Migrants lose weight quickly during migration (Alerstam,
Physiology and feeding behaviour probably determine 1994, p. 286), and may continue to lose weight during the
whether a particular species migrates by day or by night first several days at a stopover site before regaining their fat
(Alerstam, 1994; Kerlinger and Moore, 1989). Birds able to reserves (e.g. Rappole and Warner, 1976). Therefore, trapped
In North America, peak migration occurs between March and May in spring,
and between August and October in autumn. Some birds make a
series of short flights, while others fly huge distances without stopping.
feed on the wing, such as swallows and swifts, may travel by birds which avoid collision but remain within the concentra-
day and feed while migrating. Songbirds (order tion of buildings are potentially at risk of starvation from lack
Passeriformes) require daylight in order to forage for food, of resources such as seeds and insects. This lack of food may
and largely migrate at night (Weir, 1976; Alerstam, 1994). be an important secondary cause of mortality for exhausted
Waterfowl can feed by either day or night, and thus their mi- migrants trapped in a sterile environment.
gration occurs at either time. With respect to physiology, Migration altitude is an important causal component af-
cooler temperatures and less turbulent air at night may also fecting the likelihood of mortality at human-built structures.
suggest why many birds are nocturnal migrants, since day- Heights of migration vary enormously, depending on species,
time temperatures can cause overheating and enormous loss of location, geographic feature, season, time of day and weather
body water through evaporative cooling (Kerlinger and conditions (Cooper and Ritchie, 1995). Birds have beenMigr at i o n 7
recorded migrating at heights up to 9,000 metres above sea While obtaining species-specific data has proven elusive,
level (just over the Himalayas) (Berthold, 1993). There are radar studies on nocturnal bird migration have provided rela-
many gaps in our knowledge of migration altitude, particu- tively consistent results on flight altitude for migrants (Able,
larly for nocturnal migrants. However, some generalizations 1970; Gauthreaux, 1968; Eastwood and Rider, 1965). Cooper
can be made based on what we know thus far: and Ritchie (1995) indicated that a large proportion of birds
tracked by radar (98 percent in spring and 77 percent in fall)
(1) nocturnal migrants migrate at higher altitudes than flew at heights below 500 metres above ground level (agl).
diurnal migrants; Several other studies also report that nocturnal migration
(2) very low migration close to the Earth’s surface is almost usually occurs below 500 metres agl (e.g. Bellrose, 1971;
completely non-existent at night; Bruderer and Steidinger, 1972; Gauthreaux 1972, 1978,
(3) in head winds, birds withdraw to lower altitudes with 1991). Others found flight altitudes extending over a broader
lower wind velocities; altitudinal range below approximately 2,000 metres agl (e.g
(4) lower altitudes are used over mainland and small bodies of Able, 1970; Eastwood and Rider 1965; Nisbet 1963;
water than during transoceanic migrations; Richardson 1971a,b, 1972). Research indicates that after
(5) marshes, lowlands, etc. are usually crossed at relatively take-off, small birds climb rapidly to their migrating alti-
high altitudes, whereas migrants often cross mountainous tude. Maximum numbers of birds in flight and maximum
regions at relatively low height, sometimes using migration altitudes are achieved around midnight. (Lowery
mountain passes; and Newman, 1966; Richardson, 1971b; Bruderer et al.,
(6) faster flyers may prefer higher altitudes than do slower 1995). While general ranges of migrational altitude have
species (Berthold, 1993: p. 82, and references therein); been defined, a high degree of geographic variability in flight
(7) in North America, birds migrate at higher altitudes in altitudes cautions that site-specific studies are necessary to as-
fall than in spring (Richardson, personal communication; sess the impact of tall structures at particular locations
Cooper and Ritchie, 1995). (Cooper and Ritchie, 1995).
Despite the variability in migration altitudes, songbirds
Radar, infrared, and visual observations have provided have been consistently identified as a group of species flying
much useful information on the altitudinal distribution of at relatively low levels (e.g. ibid; Able, 1970). This makes
species groups (e.g. Able, 1970; Cooper and Ritchie, 1995; these species particularly vulnerable to mortality at human-
Trapped birds which avoid collision are potentially at risk of starvation in
downtown areas where resources such as seeds and insects are scarce.
Liechti and Bruderer, 1995). In general, swans, geese, ducks built structures from collisions or from secondary causes such
and cranes fly at higher levels than do raptors, shorebirds and as exhaustion, predation, starvation and dehydration. The low
songbirds (Cooper and Ritchie, 1995). Cooper and Ritchie’s flight altitudes of migratory songbirds are reflected in the
study (1995), which combined radar and visual observations high incidence of their representation amongst the kills re-
to study both diurnal and nocturnal flight, was able to deter- ported in the literature (e.g. this study).
mine flight altitudes for individual species flying during the Weather conditions have a pronounced effect on the mor-
day. Identifying flight altitudes for individual species at night tality of migrating birds at human-built structures. While
has thus far proved difficult. However, a new technology significantly fewer birds are aloft in conditions of rain or
using audio equipment to identify species-specific flight calls snow (e.g. Gauthreaux 1977; Alerstam, 1978; Zalakevicius
during migration is currently being developed, which may 1984; Richardson, personal communication), significantly
allow future research in this area (Bill Evans, personal greater numbers of kills at human-built structures occur
communication). on nights of overcast or inclement weather conditions (e.g.8 T h e Ha za rd s of L ig h ted Stru ctu res an d Win d ows to Mig ra tin g Bird s
Kemper, 1964; Aldrich et al., 1966; Verheijen, 1981). limited validity for waterfowl and shorebirds, there is much
Precipitation and cloud cover therefore clearly do not sup- overlap among flyways, and most species use more than one
press migration altogether. In fact, many studies indicate that flyway during migration. The term flyway is occasionally ap-
some birds migrate even in heavy overcast conditions, with plied to other groups of birds, including songbirds. However,
little or no detectable disorientation, since most of these at least in continental areas, the application of such an idea is
migrants fly either below or above the cloud cover (Able, misleading, since songbird migration overland occurs along a
1982; Richardson, 1990, and references therein). However, broad front with little evidence of concentration along partic-
those individuals flying within the cloud are often less well ular routes (J. Richardson, personal communication). During
oriented, particularly when unfavourable weather conditions spring and fall migration, birds migrate to and from geo-
last several days (Able, 1982). In general, “overcast is graphically diverse locations, and thus the visual perception
unfavourable for migration, no doubt partly because it of “highways of birds” is probably neither a useful nor a valid
reduces the number of cues available for orientation” concept. The idea of a flyway for land birds is only appropri-
(Richardson, 1990). ate in special geographic situations, such as along the narrow
The higher incidence of birds killed and injured at human- parts of Central America and Mexico.
Songbirds have been consistently indentified as a group of species flying at relatively low levels.
This makes them particularly vulnerable to mortality at human-built structures.
built structures in unfavourable This is not to say that all locations are
weather conditions probably results equally hazardous for migrating
from the combination of two factors: birds. Structures located at key points
(1) the reduced number of navigational along migratory routes may represent
cues available; and (2) the lower alti- a greater hazard than those in other
WWF / Edgar T. Jones
tude of individuals flying below the locations. For example, cities or struc-
cloud cover. Both factors appear to tures located along the shores of the
make them more vulnerable to fatal Great Lakes and along the Florida and
disorientation and collision with Louisiana coasts, where birds congre-
sources of artificial light. The largest The wood thrush is one of the ten most frequently gate before or after crossing a large
kills appear to occur when birds take killed species in Toronto’s downtown core. expanse of water, constitute a particu-
off in favourable weather conditions larly dangerous threat (e.g. Dunn and
but later encounter stormy weather, which forces them down Nol, 1980, and references therein). Toronto, located on the
to the ground or to lower altitudes (e.g. Herbert, 1970). northern shore of Lake Ontario, is presumably a hazard to
While weather is an important influence on the overall num- birds setting out over the lake in fall and reaching land after
bers of fatalities at human-built structures, mortality occurs to crossing the lake in spring (this study). In Chicago, located
some degree under all weather conditions, necessitating the on the southern shore of Lake Michigan, mass bird mortality
adoption of preventative measures implemented consistently during migration is also a serious problem (Willard, per-
throughout the migration seasons. sonal communication). While certain locations thus repre-
A popular but perhaps misunderstood notion holds that sent more critical migration danger zones, bird migration is
bird migration occurs in a concentrated manner along specific a continent-wide and world-wide phenomenon, and all hu-
routes, called “flyways.” The concept of the migratory flyway man-erected structures pose a potential threat to birds. All
was introduced by F. C. Lincoln in the 1930s, and used forms of urban development should therefore take this issue
mainly with reference to waterfowl (e.g. Lincoln, 1935; Ens et into consideration.
al., 1994). While the idea of flyways may indeed have someFla p – Toron to ca se s t udy 9
FLAP – Toronto case study
Various interested individuals have been collecting dead or Toronto. This district is an area of numerous tall office build-
injured migrating birds at the base of downtown Toronto ings, many of which are faced entirely with glass. The bound-
buildings at least as early as the 1960s, and some 40 of aries of the area searched by FLAP are Front Street to the south,
Toronto’s buildings are reported to be responsible for bird Yonge Street to the east, Richmond Street to the north, and
deaths (Whelan, 1976). FLAP, the Fatal Light Awareness John Street to the west (see Figure 2), an area of approximately
Program, is a volunteer organization founded in April 1993 by 0.7 square kilometres and comprising approximately 40 sky-
a group of individuals concerned about the large numbers of scrapers and numerous small buildings (see Figure 3). A central
migrating birds killed or injured by collisions with city build- core area consisting of buildings known as the Toronto-
ings in the downtown core of Toronto during spring and fall Dominion Centre, Royal Bank Plaza, Commerce Court, BCE
migration. The group began collecting, identifying and Place and First Canadian Place, is checked regularly, with more
recording their findings in 1993, and rescuing, rehabilitating distant buildings checked less frequently when collisions in the
and releasing as many birds as possible. The purpose of this core have been few. Collectors search only the most easily acces-
case study is to illustrate the relative magnitude of the prob- sible sides of buildings, since some sides of some buildings are
lem of bird mortality during migration in a large urban centre. difficult to reach. (Above-ground ledges are thought to harbour
FLAP, the Fatal Light Awareness Program, is a volunteer organization founded in
April 1993 by a group of individuals concerned about the large numbers of migrating birds
killed or injured by collisions with city buildings in the downtown core of Toronto.
injured or dead birds, but these are not
Migratory bird collisions normally searched.)
in Toronto Volunteers begin their search in
the early hours of the morning, usually
It is important to point out that the between 3:00 a.m. and 9:30 a.m., but
mandate of FLAP volunteers is primar- searching sometimes begins as early as
Ted Almond
ily to capture uninjured birds trapped 11:00 p.m. if the weather is ominous,
in the city centre and transport them and on these nights collection may con-
to be released in a more natural set- Rescued birds that are uninjured or have recovered are tinue into late morning or early after-
ting. A secondary goal is to increase released in natural areas far from buildings. noon. The time spent collecting varies
the chance of survival for injured birds widely, usually from 30 minutes to
by transporting them to wildlife rehabilitation centres. An ad- three hours. Volunteer availability determines whether or not
ditional FLAP goal is to increase public awareness about the collection takes place on any given day, and thus collection is
problem of lit buildings during the migration season and to not possible every day. Volunteers record information concern-
encourage building tenants and owners to turn off lights at ing species and location on paper or with the use of a hand-held
night. Given their mandate for rescue, FLAP’s information on tape recorder. Birds are captured by hand or with the aid of a
the total numbers of birds and species composition was there- hand-held net. Volunteers occasionally administer
fore not collected as part of a scientific study, and collection Dexamethasone to injured birds to reduce brain swelling.
did not employ a strict scientific protocol using consistent Uninjured birds are individually housed in paper bags and re-
time of day, duration, effort, and collection routes. leased away from the city, injured birds are taken to wildlife re-
During the migration season (in spring, from early April to habilitation centres, and dead birds are donated to scientific in-
early June; in autumn, from mid-August to mid-November), a stitutions (M. Mesure, personal communication). As outlined
group of volunteers from FLAP search the downtown core of above, collection methods employed by FLAP volunteers are in10 T h e Ha za rd s of L ig h ted Stru ctu res an d Win d ows to Mig ra tin g Bird s
Figure 2
Area monitored by the Fatal Light Awareness Program in Toronto’s downtown core
RICHMOND ST.
22B 22A 21 20 19 36
ADELAIDE ST.
JOHN ST.
25
BAY ST.
23 37
9
PEARL ST. 26 24
8B 7B
10B 10A 8A 7A
18
KING ST.
UNIV 6B
SIMCOE ST.
34C 27 11 2 1E 1B
YONGE ST.
ERSI
34B 6A
TY A
1A 1C
VE.
34A 28 12 13 1D 17
N
3
WELLINGTON ST.
YORK ST.
14 1F
15 4A 5B
30 29
33 TOWER HALL 38
32 16 35 4B 5A
FRONT ST.
39 31
Buildings:
1A TORONTO – DOMINION TOWER 5A CANADA TRUST 16 METROPOLITAN PLACE 27 100 UNIVERSITY AVE
1B TORONTO – DOMINION BANK 5B BAY WELLINGTON 17 SUN ALLIANCE BUILDING 28 70 UNIVERSITY AVE
1C ERNST & YOUNG 6A CIBC TOWER 18 4 KING STREET WEST 29 40 UNIVERSITY AVE
1D COMMERCIAL UNION 6B OLD CIBC BANK 19 BELL CANADA 30 145 WELLINGTON STREET WEST
1E ROYAL TRUST 7A OLD SCOTIA BANK 20 RICHMOND ADELAIDE CENTRE 31 CITIBANK PLACE
1F AETNA 7B SCOTIA PLAZA 21 130 ADELAIDE STREET WEST 32 WORKERS' COMPENSATION BOARD
2 STANDARD LIFE CENTRE 8A BANK OF MONTREAL 22A NATIONAL BANK BUILDING 33 CBC CENTRE
3 220 BAY STREET 8B EXCHANGE TOWER 22B GUARDIAN OF CANADA TOWER 34A UNITEL
4A ROYAL BANK PLAZA NORTH 9 105 ADELAIDE STREET WEST 23 141 ADELAIDE STREET WEST 34B METRO HALL
4B ROYAL BANK PLAZA SOUTH 10A SUN LIFE CENTRE 24 155 UNIVERSITY AVE 34C SUN LIFE TRUST
10B MERRILL LYNCH CANADA TOWER 25 170 UNIVERSITY AVE 35 ROYAL YORK
11 145 KING STREET WEST 26 UNION BANK OF SWITZERLAND 36 YONGE RICHMOND CENTRE
12 55 UNIVERSITY AVE 37 1 FINANCIAL PLACE
13 HONG KONG BANK OF CANADA 38 33 YONGE STREET
14 33 UNIVERSITY AVE 39 CN TOWER
15 DELOITTE & TOUCHEFla p – Toron to ca se s t udy 11
Figure 3
A bird’s eye view of Toronto’s downtown core
This figure has been provided by the City of Toronto – Planning and Development, Architecture and Urban Design Division.
Looking north from the Toronto waterfront, this oblique view of the downtown
skyline shows the maze of buildings which may confront migrating birds.12 T h e Ha za rd s of L ig h ted Stru ctu res an d Win d ows to Mig ra tin g Bird s
no way standardized or consistent. The numbers given there- move most of the evidence of mass bird kills. The counting of
fore provide a rough estimate only, since FLAP does not have gulls in various sectors of the city during migration seasons
the human resources to fully search the entire area and all sides may in fact be a future method by which FLAP could assess
of buildings. The nature of the collection precludes any com- the geographical extent of bird mortality within Toronto (E.
parison between individual buildings or the effects of architec- Dunn, personal communication). In addition to gulls (the
tural design. However, the data collected at least provide a main predators in the Toronto study), predation by raccoons,
minimum estimate of the degree of mortality incurred and the feral cats, and rats also occurs to a lesser extent.
types of bird species affected at night by Toronto’s tall lighted
buildings during the migration season. 1993-1995 data
Predation also suggests that the number of birds recorded
by FLAP indeed represents a minimum. By dawn, gulls (espe- Table 1 illustrates the total number of deaths and the total
cially ring-billed gulls, Larus delawarensis) are scavenging number of birds collected (including those killed, injured,
Toronto’s downtown core. The search area must therefore be caught and sighted), thus giving approximate minimum and
examined before dawn in order to minimize competition with maximum numbers of birds affected by the lights of tall
these marauding gulls for access to the dead and injured structures in Toronto during nocturnal migration in spring
Volunteers from FLAP begin their search for injured birds in the early hours
of the morning, usually between 3:00 a.m. and 9:30 a.m.
Birds are captured by hand or with the aid of a hand-held net.
birds. FLAP’s President, Michael and fall. The significant increase in
Mesure, describes the gulls as appear- numbers during autumn in compari-
ing to follow particular scavenging son with spring presumably reflects
routes around Toronto buildings, ap- the increased number of juvenile birds
parently a behaviour learned in re- in the population following the breed-
sponse to the discovery of a reliable ing season, similar to the findings of
Ted Almond
food source during migration. Klem other authors (e.g. Klem, 1989).
(1981) stated that avian predators are Factors such as the use of different mi-
unlikely to be capable of learning to About one-half of all birds rescued by FLAP gration routes in spring and fall, and
use windows as tools to capture their can be released away from buildings. seasonal differences in the speed of
prey, since the predators themselves migration may also be involved (e.g.
can collide with the windows around which they hunt. Avise and Crawford, 1981). The level of mortality that would
However, gulls observed by FLAP members not only prey on occur without FLAP’s intervention would be somewhat
the dead birds, but apparently have learned to scare injured or higher than the figure reported here, since approximately 25
disoriented birds towards windows, apparently causing colli- percent of the injured birds die or are euthanized at wildlife
sions that stun or kill the individual, allowing its easy re- rehabilitation centres. Many of the injured birds that survive
trieval. Mesure has also observed that an increased number of and are later released would not do so without human inter-
gulls appears to be present on nights of particularly heavy mi- vention. In addition, the actual survival rate of birds released
gration. While FLAP volunteers reduce the number of birds following successful rehabilitation is unknown, since these in-
taken by predatory gulls, the gulls may capture the majority dividuals are not banded. The possibility exists that some in-
of birds, acting as an efficient “clean-up crew,” and thus re- dividuals may be left with permanent brain damage due toFla p – Toron to ca se s t udy 13
Table 1: Numbers of birds found near tall Toronto buildings during migration (1993-95)1
Spring Fall Annual Totals
April – May August – November
Year deaths total2 deaths total2 deaths total2
1993 301 666 305 639 606 1305
1994 350 972 578 1296 928 2268
1995 250 907 414 974 664 1881
Average 300 848 432 970 733 1818
Total 901 2545 1297 2909 2198 5454
1Data collected in Toronto by FLAP members. Number of collection days: 101, 124, 116 for 1993, 1994, and 1995 respectively.
2Total number of birds recorded as dead, injured, captured, escaped and sighted.
Table 2: Ten most frequent species found near tall Toronto buildings during migration (1993-1995)1
Spring Fall Overall
Rank of Species Individuals2 % of total Species Individuals2 % of total Species Individuals2 % of total
Abundance (2545)3 (2909)3 (5454)3
1 White-throated sparrow 707 27.8 White-throated sparrow 425 14.6 White-throated sparrow 1132 20.8
2 Ovenbird 504 19.8 Ovenbird 399 13.7 Ovenbird 903 16.6
3 Brown creeper 181 7.1 Common yellowthroat 265 9.1 Common yellowthroat 378 6.9
4 Common yellowthroat 113 4.4 Magnolia warbler 166 5.7 Brown creeper 237 4.3
5 Hermit thrush 97 3.8 Hermit thrush 133 4.6 Hermit thrush 230 4.2
6 Dark-eyed junko 88 3.5 Black-throated blue warbler 90 3.1 Magnolia warbler 203 3.7
7 Wood thrush 52 2.0 Black-and-white warbler 90 3.1 Black-throated blue warbler 132 2.4
8 Magnolia warbler 37 1.4 American redstart 68 2.3 Dark-eyed junco 128 2.3
9 Yellow-bellied sapsucker 37 1.4 Brown creeper 56 1.9 Black and white warbler 124 2.3
10 Black-and-white warbler 34 1.3 Song sparrow 49 1.7 American redstart 85 1.6
1Data collected in Toronto by FLAP members. Number of collection days: 101, 124, 116 for 1993, 1994, and 1995 respectively.
2Total number of birds recorded as dead, injured, captured, escaped and sighted.
3Percent of total number of individuals found, including unidentified birds.14 T h e Ha za rd s of L ig h ted Stru ctu res an d Win d ows to Mig ra tin g Bird s
the impact of collision, which may interfere with a variety of data. Similarly, common yellowthroats (Geothlypis trichas)
crucial skills or behaviours, among them the ability to navi- comprise 14 percent of the FLAP data but only three percent
gate successfully during migration. of the TOC data. Conversely, yellow-rumped warblers
Table 2 depicts the 10 most abundant species collected. Of (Dendroica coronata) comprise 12 percent of the TOC sample,
the 100 species recorded by FLAP, several species stand out as and only 0.4 percent of the FLAP data. The TOC species
being highly abundant. White-throated sparrows (Zonotrichia composition data is affected by visibility, since some species
albicollis) and ovenbirds (Seirus aurocapillus) are the most nu- are more conspicuous than others, and thus comparison be-
merous species in spring, comprising 28 percent and 20 per- tween TOC and FLAP data is a relatively crude one.
cent of the total, respectively. White-throated sparrows and However, the observed trends suggest that the propensity
ovenbirds are also the two most common species in fall, com- for certain species to be over-represented in collision deaths
prising 15 percent and 14 percent, respectively. These two is not simply a factor of their relative abundance in the com-
species frequently rank the highest in other reports of bird position of migration traffic. Rather, their nocturnal attrac-
mortality at human-built structures (Klem, 1989; D.E. tion to lighted buildings would appear to be due to some
Willard, unpublished data). species-specific behaviour that makes them more vulnerable
FLAP’s data on species composition were also compared than other species to light entrapment.
to data compiled by the Toronto Ornithological Club (TOC) Similar to other reports of migration mortality at human-
during 1993-95 (Fairfield, 1993, 1994, 1995). The TOC built structures, certain sub-families of birds are also more
collected data from several observers who made daily visual prevalent than others (see Table 3). The largest proportion of
and auditory counts of migrating birds at 11 study areas in species overall belong to the warbler (Parulinae) sub-family
Metropolitan Toronto. For the May 1 to June 5 period, the (41 percent). Next most common are sparrows (Emberizinae),
species composition of the two studies differed markedly. which comprise 32 percent of the total overall. Thrushes
Ovenbirds, for example, comprise 64 percent of the warblers (Turdinae) and brown creepers (Certhiidae: Certhia americana)
in the FLAP data, but only six percent of those in the TOC are also highly represented. The apparent proclivity of certain
Table 3: Ranking of abundance of birds found near tall Toronto buildings during migration (1993-1995),
categorized by sub-family1
Spring Fall Overall
Rank of Sub-family Individuals2 % of total Sub-family Individuals2 % of total Sub-family Individuals2 % of total
Abundance (2545)3 (2909)3 (5454)3
1 Sparrow 1065 41.8 Warbler 1438 49.4 Warbler 2249 41
(Emberizinae) (Parulinae) (Parulinae)
2 Warbler 811 31.9 Sparrow 697 24 Sparrow 1762 32
(Parulinae) (Emberizinae) (Emberizinae)
3 Other 317 12.5 Other 541 18.6 Other 858 16
4 Brown creeper 181 7.1 Thrush 173 5.9 Thrush 346 6.3
(family Certhiidae) (Turdinae) (Turdinae)
5 Thrush 173 6.8 Brown creeper 56 1.9 Brown creeper 237 4.3
(Turdinae) (family Certhiidae) (family Certhiidae)
1 Data collected in Toronto by FLAP members. Number of collection days: 101, 124, 116 for 1993, 1994, and 1995 respectively.
2 Total number of birds recorded as dead, injured, captured, escaped and sighted.
3 Percent of total number of individuals.Fla p – Toron to ca se s t udy 15
species and sub-families to be more vulnerable than others to during both migration seasons since 1982, the average num-
fatal light entrapment is corroborated by many other studies ber of birds killed annually is 1,478, and the total number
(Appendix 1) and the potential causes and implications of this killed over the past 14 years is 20,697 (D.E. Willard, unpub-
phenomenon will be discussed later in this report. lished data). Cities located on the Great Lakes, such as
The FLAP data for downtown Toronto may be summarized Toronto and Chicago, may have higher collision mortality
as follows: the total number of species recorded for all years rates than cities further inland, since migrating birds (young
and seasons combined is 100 (see Appendix 2). The average birds in particular) are known to aggregate along coasts (e.g.
annual total of birds killed or injured by artificial light is Dunn and Nol, 1980, and references therein).
1,818. The average annual number of deaths from 1993 to Migrant mortality of varying degrees of severity probably
1995 is 732, with 300 deaths resulting in spring and 432 in occurs in every major city throughout North America and
fall. Due to the many additional threats (predation, the day- wherever bird migration and urban centres coincide world-
time hazards of windows for those that survive the night, and wide. The presence of urban areas along the routes of migrat-
the difficulty of finding food in a built-up area), the actual ing birds in flight can be imagined in the following way: If
number of deaths in central Toronto prior to FLAP’s interven- the east-west width of all Canadian and American cities over
tion was likely to be much higher, perhaps closer to 1,000 per 100,000 in population is projected onto one line (i.e. a single
year. This figure is almost certainly an underestimate, since imaginary “horizon” from a bird’s-eye view), then the aggre-
bird collections at only two buildings in downtown Toronto gate width of these large urban areas is equivalent to 41 per-
have caused the death of 157 birds during fall migration cent of the total east-west width of North America measured
alone (Ranford and Mason, 1967). from its most easterly and westerly points. In this projection,
Representing only a small section of the potential danger cities of the same longitude overlap one another; a calculation
zone in Toronto for migrating birds, these numbers are dis- of all such urban widths is equivalent to 84 percent of the to-
turbing. Light entrapment represents a significant and real tal width of North America. Between Chicago and Boston
threat for migrating birds, and for songbirds in particular. (i.e. most of eastern North America), urban areas block 70
This degree of mortality is not an isolated occurrence. In fact, percent of the horizon and their combined total width is
at just one lake-side building in Chicago checked every day equivalent to 215 percent of the Chicago-Boston horizon.
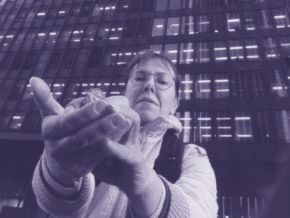
Alan Cairns / The Toronto Sun
Alan Cairns / The Toronto Sun
Rescue work begins before dawn and may continue through the morning rush-hour. Office workers,
largely unaware of the threat of buildings to migrating birds, hold the key to their survival.16 T h e Ha za rd s of L ig h ted Stru ctu res an d Win d ows to Mig ra tin g Bird s
The broader picture
While a complete analysis of the existing data is beyond the 1,042 references to avian mortality at human-built structures,
scope of this study, a partial compilation of data amassed by with many of these references also referring to multiple inci-
Avery et al. (1980), a number of recently published works, and dents. More than 15 years later, documentation of the prob-
several unpublished studies, provide some useful insight into lem continues (e.g. Willard, unpublished data; Klem, 1990;
the past and present severity of the problem (see Appendix 1). Dunn, 1993), but a comprehensive bibliographic update has
FLAP’s Toronto case study represents merely one example not been produced. It is important to consider that formal
of a problem which occurs throughout Canada and the world. documentation of avian mortality at human-built structures
The problem of avian mortality at human-built structures is a represents only the tip of the iceberg. The vast majority of
long-standing one, with documentation of incidents occurring kills remains undocumented and presumably largely unno-
as early as the 1880s (Cooke, 1888; Kumlien, 1888). Weir ticed. Avian mortality at human-built structures is thus a
(1976) documented 471 reports of bird kills at human-built large but often covert problem. Wherever there are human-
obstacles, including lighthouses, ceilometers, chimneys, cool- built structures, migrating birds are potentially at risk.
ing towers, communication towers, buildings, gantries, Considerable information exists on bird losses at human-
bridges, trains, telephone lines and power lines. The origins of built structures, however most of this information consists of
Weir’s references included North America, the Caribbean, sporadic reports of kills rather than organized and coordinated
Europe, Malaysia, and the Pacific Ocean. Many of the 471 ref- monitoring. There is a dire need for a comprehensive and co-
erences were reports documenting multiple incidents. ordinated effort at national and international levels.
The annotated bibliography produced for the United Nevertheless, useful information can still be gleaned from the
States Fish and Wildlife Service (Avery et al., 1980) lists myriad of existing bird collision reports.
Kills of more than one hundred ovenbirds in one night have been
documented in multiple reports, and if this degree of mortality prevails across the
continent, such losses may have a significant impact on population sizes.
Alan Cairns / The Toronto Sun
Volunteer rescues an ovenbird, the species that collides
most often with buildings in North America.S ig n ifica n ce of th e p ro bl e m 17
Significance of the problem
While it is difficult to determine an exact numerical figure crude order of magnitude estimate, approximately one in
for the proportion of overall migration mortality incurred by 1,000 birds that fly over Toronto’s downtown district in au-
human-built structures, it is important to consider that many tumn are killed due to collision. Migration traffic data are un-
songbirds, the group of species that experience the heaviest available for spring, and thus a corresponding estimate of the
mortality at human-built structures, are undergoing serious proportion of spring migrants killed is not possible.
population declines (e.g. Robbins et al., 1989). Therefore, any Banks (1979) estimates that approximately 1.25 million
type of anthropogenic mortality which contributes to their birds are killed in North America each year in collisions with
population declines is cause for concern. Mortality at human- tall structures. He bases this estimate on the assumption that
built structures may in fact play a larger role in the diminish- approximately half of the 1,010 television transmission towers
ing numbers of songbirds than previously recognized. Kills of in the United States (in 1975) incur a mortality rate of 2,500
more than one hundred ovenbirds in one night have been per year (based on averages of three independent studies on
documented in multiple reports (cited in Avery et al., 1980), TV tower mortality). This estimate is therefore based on the
and if this degree of mortality prevails across the continent, impact of television towers alone, and does not include other
such losses may have a significant impact on population sizes. tall structures such as cooling towers, radio towers, and tall of-
A very crude estimate of the proportion of birds killed by fice buildings. Weir (1976) gives the number of TV towers in
structures in central Toronto versus overall numbers migrating Canada in December 1975 as 189, and using the same as-
overhead can be made by comparing the number of those sumptions and method of calculation as Banks, an estimated
known to be killed and injured with known mean migration 236,250 birds were killed at Canadian TV towers in 1975.
traffic rates for the Toronto area (Richardson, 1982). This Klem (1989) has estimated that the number of birds killed
method of estimation has many sources of uncertainty, but at by day-time window collisions at low-level structures (such as
Many songbirds, the group of species that experience the heaviest mortality at
human-built structures, are undergoing serious population declines.
least provides an order of magnitude estimate of the signifi- individual residences) ranges from approximately 100 million
cance of this source of mortality. Assuming an average migra- to close to one billion per year in the United States alone.
tion traffic rate (MTR) for the whole autumn migration season This estimate is based on year-round kills, and thus includes
of 1,500 birds per kilometre of migration front per hour, aver- the mortality of resident species as well as those involved in
aged over a 90-night migration period, with an average of migration. Klem’s annual window-kill mortality estimate has
eight hours of migration per night, an estimated 1,500 x 90 x been supported by a similar, independent estimate (Dunn,
8, or approximately one million migrants fly across a one kilo- 1993). Thus, while lighted structures result in large numbers
metre east-west front over the course of fall migration (W.J. of avian injured or dead birds, windows may represent an
Richardson, personal communication). Multiplying this one even greater problem for migrants.
kilometre front of birds by 40 km – the approximate east-west Until widespread and standardized reporting of bird kills
breadth of Metropolitan Toronto – gives us a total of approxi- is implemented, estimating continent-wide mortality in-
mately 40 million birds passing over Toronto each autumn. curred by structural hazards is unavoidably speculative. In the
FLAP covers an area approximately 0.5 kilometres wide (from case of lighted structures, estimates of collision mortality are
east to west), and thus an estimated 500,000 birds fly over likely to represent minimums, since documentation of kills is
this area each fall, of which approximately 500 are killed due scant. As Avery et al. (1980) points out, the number of kills
to collision with lighted buildings. This estimate assumes that reported in the literature is probably more closely related to
migrating birds are evenly distributed over the Toronto air the waxing and waning of public interest in the phenomenon
space, and that there is no focussing effect over the downtown rather than the frequency of its actual occurrence. In urban ar-
district. Thus, acknowledging once again that this gives a very eas, concern over bad publicity may result in many officeYou can also read