Status and change in native forest birds on New Zealand's mainland, 1969-1979 to 1999-2004 - Parliamentary Commissioner for the ...
←
→
Page content transcription
If your browser does not render page correctly, please read the page content below
Status and change in native forest birds on
New Zealand’s mainland, 1969–1979 to 1999–2004

Status and change in native forest birds on New Zealand’s
mainland, 1969–1979 to 1999–2004

Susan Walker, Adrian Monks, John Innes

Landcare Research

Prepared for:

Parliamentary Commissioner for the Environment

PO Box 10-241
Wellington 6143
New Zealand

May 2017

Landcare Research, 764 Cumberland Street, Private Bag 1930, Dunedin 9054, New Zealand,
Ph +64 3 470 7200, Fax +64 3 470 7201, www.landcareresearch.co.nz
Reviewed by:                                   Approved for release by:

Andrew Gormley                                 Gary Houliston
Researcher                                     Portfolio Leader – Enhancing Biodiversity
Landcare Research                              Landcare Research

Landcare Research Contract Report:             LC2786

Disclaimer
This report has been prepared by Landcare Research for the Parliamentary Commissioner for the Environment.
If used by other parties, no warranty or representation is given as to its accuracy and no liability is accepted for
loss or damage arising directly or indirectly from reliance on the information in it.

© Parliamentary Commissioner for the Environment 2017
This report has been prepared by Landcare Research New Zealand Limited for the Parliamentary Commissioner
for the Environment and Landcare Research has agreed that the Parliamentary Commissioner for the
Environment owns the copyright in the report. It may not be reproduced or copied, in whole or in part, in any
form or by any means without the written permission of the Parliamentary Commissioner for the Environment.
Contents

Summary ..................................................................................................................................... v

1       Introduction ....................................................................................................................... 1

2       Background ........................................................................................................................ 3

3       Objectives .......................................................................................................................... 4

4       Glossary of technical terms used ...................................................................................... 4

5       Data ................................................................................................................................... 5
        5.1      Standardised forest bird occupancy data set ................................................................ 5
        5.2      Native forest bird taxa ................................................................................................ 6
        5.3      Environmental characteristics of the grid squares......................................................... 7

6       Analyses ........................................................................................................................... 11
        6.1      Summaries of status and change in occupancy ........................................................... 11
        6.2      Percentage of indigenous forest range occupied ........................................................ 11
        6.3      Effects of indigenous forest cover.............................................................................. 12
        6.4      Effects of temperature on occupancy probabilities ..................................................... 13
        6.5      Effects of temperature in ‘deep forests’ ..................................................................... 14
        6.6      Cold forests: thermal refuges from predation? ........................................................... 15

7       Results ............................................................................................................................. 15
        7.1      Status and change in occupancy ................................................................................ 15
        7.2      Percentage of indigenous forest range occupied ........................................................ 18
        7.3      Effects of indigenous forest cover.............................................................................. 19
        7.4      Effects of temperature on occupancy probabilities ..................................................... 26
        7.5      Effects of temperature in deep forests ....................................................................... 30
        7.6      Cold forests: thermal refuges from predation? ........................................................... 36

8       Discussion ........................................................................................................................ 40
        8.1      Continuation of forest bird declines........................................................................... 40
        8.2      Primary cause of native forest bird declines ............................................................... 40
        8.3      Modern effects of past deforestation......................................................................... 41
        8.4      Cold forests: shrinking thermal refuge ....................................................................... 43
        8.5      Island differences ..................................................................................................... 44

Landcare Research                                                                                                                      Page iii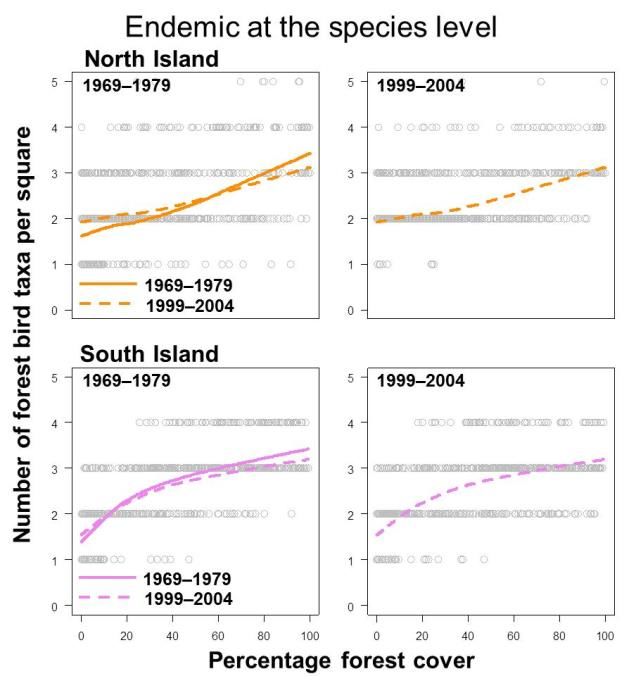
Status and change in native forest birds on New Zealand’s mainland, 1969–1979 to 1999–2004

          8.6     Changes in forest bird range occupancy after 2004..................................................... 45
          8.7     Overall patterns and variations among places and bird taxa ........................................ 46

9         Conclusions ...................................................................................................................... 47

10        Acknowledgements ......................................................................................................... 48

11        References ....................................................................................................................... 48

Appendix 1 Native forest bird taxa ........................................................................................... 55

Appendix 2 Status and change in native forest bird taxa ......................................................... 56

Appendix 3 Percentage of forest ranges occupied by native forest bird taxa ......................... 57

Appendix 4 Estimated area of forest range occupied by native forest bird taxa ..................... 58

Appendix 5 Native forest bird local richness and percentage forest cover ............................. 59

Appendix 6 Parameter estimates from linear mixed effects models ....................................... 60

Appendix 7 Conditional autoregressive (CAR) models ............................................................. 63

Page iv                                                                                                                Landcare Research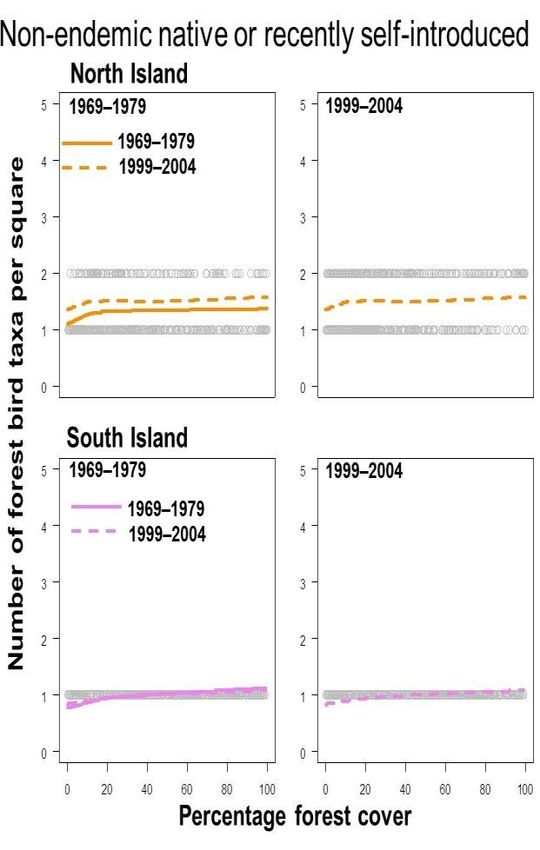
Summary
Project and client
In this report we describe patterns of status and change in 22 taxa of New Zealand’s native
forest birds in two measurement periods (1969–1979 and 1999–2004) for the Parliamentary
Commissioner for the Environment.
This work extends a report on 64 taxa of native land birds (Walker & Monks 2017), which
describes the development of a standardised national data set of bird occupancy
probabilities from two national atlases of bird distribution, and summarises status and
change across the native avifauna. Walker and Monks (2017) concluded that two (of six)
groups of birds were in greatest need of conservation effort: endemic forest and alpine
birds, and endemic wading birds, terns or gulls that breed in the inland eastern South Island.
This report focuses on the 22 taxa of native forest birds found on the New Zealand
mainland.
Objectives
To investigate how scarcity of indigenous forest cover has affected native forest birds.
To ask whether colder forests have provided native forest birds thermal refuge from
predation.
To determine how the effects of indigenous forest cover loss and temperature vary
across levels of endemism and among native forest bird species.
Methods
We used standardised estimates of probabilities of occupancy for 22 native forest bird taxa
in each of 2,155 10 × 10 km grid squares in two measurement periods (1969–1979 and
1999–2004). We analysed patterns of local richness and occupancy in relation to birds’
taxonomic levels of endemism, and the percentage of land under indigenous forest and
mean annual temperature within grid squares.
Results
Data from the two national atlases show major declines in the ranges occupied by many
native forest birds across the New Zealand mainland generally, and in indigenous forests,
between the 1970s and the early 2000s. These changes show clear and systematic patterns
that are related to endemism level, forest cover and temperature.
Endemic bird taxa underwent the greatest relative range declines, especially (but not only)
‘deep endemics’ (i.e. taxa that are endemic at the level of subfamily, family or order). The
largest range declines were in the remaining large indigenous forest tracts, to which many
endemic taxa were largely confined by the 1970s.
Landcare Research Page v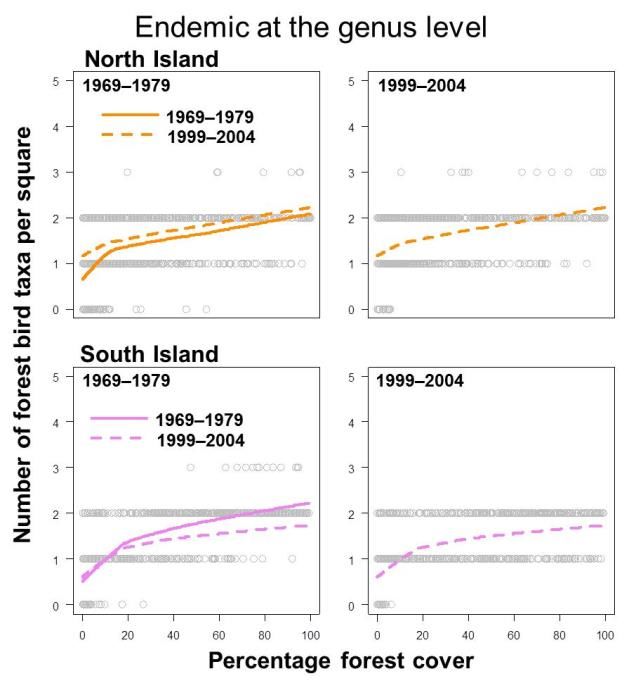
Status and change in native forest birds on New Zealand’s mainland, 1969–1979 to 1999–2004

Across the grid squares covered by our data the median percentage of forest range
occupied by deep endemic bird taxa decreased from 15.5 to 5.3% between measurement
periods in the North Island, and from 22.7 to 15.7% in the South Island. Whitehead (the
North Island endemic Mohoua albicilla) was the only deep endemic species to show a
convincing range increase.

The largest relative range declines between measurement periods were in blue duck, weka,
rifleman, kākā and long-tailed cuckoo on both islands, and in North Island brown kiwi, North
Island kōkako and North Island robin. There were also notable range declines in parakeet
species in the North Island, and in kiwi, kererū, tūī, tomtit and morepork in the South Island.

There were net increases in range in most forest bird taxa that have arrived more recently in
New Zealand (grey warbler, fantail, shining cuckoo and silvereye).

Low indigenous forest cover reduced occupancy probabilities of most native forest birds. Its
negative effects were greater on deep endemic taxa.

Probabilities of occupancy in native forest birds, especially deep endemics, were
significantly lower in forests that experience higher mean annual temperatures. New
Zealand’s colder forests, many of which are dominated by species of beech or rimu, are now
its most important reservoirs of endemic forest bird populations.

Warmer-forested squares on both islands, but especially the North Island, supported few
deep endemic forest birds by 1969–1979. Decreases in range occupancy between
measurement periods were greater in warmer forests, where there were still remnant bird
populations left to lose. These effects do not appear to be driven by higher levels of human
disturbance and deforestation or fragmentation in warmer forests.

Although endemic forest bird taxa became increasingly confined to colder forests between
measurement periods, their local probabilities of occupancy also decreased in colder forests
over the same period.

Conclusions

Between 1969–1979 and 1999–2004 there was widespread and systematic of loss of
endemic forest birds from New Zealand’s forests. This trend is likely to have continued since
2004.

Our results are consistent with predation by introduced mammals being the primary cause
of recent decline and limitation in New Zealand’s native forest birds. There may be other
contributing and interacting causes, but evidence for them is weak.

Forest scarcity may have more important negative consequences for endemic forest bird
conservation than has been recognised. A number of taxa appear intolerant of deforestation
as well as predation, especially those that are endemic at higher taxonomic levels. Our
results caution against expectations that they would be able to sustain viable populations in
deforested and partially forested landscapes if mammal predators were absent.

Page vi                                                                                      Landcare Research
Status and change in native forest birds on New Zealand’s mainland, 1969–1979 to 1999–2004

Assuming that mammalian predators can be reduced to and sustained at the required
threshold minima, restoration of viable endemic forest bird populations through predator
management is more likely to be successful in large, continuous tracts of forest.

Loss of endemic forest birds from New Zealand’s forests before 1969–1979 and between
measurement periods varied with mean annual temperature. Cold forests (those with mean
annual temperatures less than about 10⁰C) have become the most important strongholds of
a number of endemic forest birds that have declined faster in warmer forests. The cause is
likely to be higher and/or more continuous predation pressure where temperatures are
warmer. However, the refuge that cold forests have provided for endemic forest bird
species has also diminished, also (probably) as a consequence of ongoing predation.

Many of New Zealand’s colder forests are in the South Island and are dominated by beech
or rimu trees, which periodically exhibit synchronised heavy seeding. Our results explain
why mast seeding events and consequent predator irruptions in these remaining cold-forest
strongholds have become such critical threats to the persistence of forest bird species.

Loss of endemic forest birds is likely to be exacerbated by climate warming, by reducing the
extent of cold forests where predation pressure is relatively low in most years, and by
favouring cold-limited predators generally across forests. It may also increase the frequency
of mast seeding events.

The opportunity to retain large viable populations of predator-vulnerable forest birds on the
mainland is retreating. Large-scale predator control by aerial 1080 on public land is currently
the only practical and cost-effective way to retain these populations.

Landcare Research                                                                            Page vii
1      Introduction
Throughout most of the evolutionary history of New Zealand’s birds, forest has been the
predominant land cover (Lee et al. 2016). As a consequence, most terrestrial native bird
species that are classified within orders, families, genera and species that occur nowhere
else in the world are birds that breed and feed primarily in forest habitats. Forest birds
collectively represent New Zealand’s largest contribution to global avian biodiversity.

Many native forest bird species became extinct following human settlement of New Zealand
(Worthy & Holdaway 2002; Robertson et al. 2013), and most extant species are either in
decline or threatened with extinction (Innes et al. 2010; Robertson et al. 2013). A number of
taxa survive today only where predators are intensively managed at very low levels, such as
on offshore or nearshore islands or in mainland sanctuaries (Towns 2011; Burns et al. 2012;
Innes et al. 2012, Innes, Burns et al. 2015).

Predation by introduced mammals is understood to be the primary cause of recent declines
in native forest birds (Innes et al. 2010), and protecting forest birds from predation has been
a major focus of New Zealand’s conservation efforts. Since the 1970s populations of several
threatened forest birds and other species have been secured from extinction on offshore
islands by a combination of predator eradication and translocation (Towns & Ballantine
1993; Towns & Broom 2003; Bellingham et al. 2010; Towns 2011; Miskelly & Powlesland
2013)1. However, the principal challenge for forest bird conservation today remains to
secure vulnerable species from decline in their natural habitats on the New Zealand
mainland2.

1
  Forest birds translocated to islands include North Island brown kiwi (Apteryx mantelli), little spotted kiwi
(A. owenii), North Island weka (Gallirallus australis greyi), kākāpō (Strigops habroptilus), red-crowned and
yellow-crowned parakeet/kākāriki (Cyanoramphus novaezelandiae and C. auriceps), whitehead (Mohoua
albicilla), mōhua (M. ochrocephala), North Island robin (Petroica longipes), South Island robin (P. australis),
hihi (Notiomystis cincta, North Island and South Island saddleback (Philesturnus carunculatus rufusater and P.
c. carunculatus), and North Island kōkako (Callaeas wilsoni).
2
  There are several reasons for this. The supply of offshore islands suitable for pest eradication and restoration
is being exhausted: few islands now remain that are nature reserves large enough to be worthwhile and
distant enough from the mainland that predator reinvasion is unlikely, and that have not already been subject
to pest mammal eradication (Innes et al. 2012). Some threatened species (e.g. whio/blue duck) cannot be
translocated to and maintained on islands, which offer a different suite of environments from those on the
mainland. Limitations to dispersal to and from offshore islands, and small founder populations, mean that
island populations may require careful intervention to maintain genetic diversity (Jamieson 2015). As a result,
maintaining large in situ populations of indigenous bird species on the mainland is the bes t way to achieve
persistence and continued evolution, and this outcome coincides with New Zealanders’ desire to see and
experience native biota in their natural habitats (DOC & MfE 2000; DOC 2016).

Landcare Research                                                                                          Page 1
Status and change in native forest birds on New Zealand’s mainland, 1969–1979 to 1999–2004

Management and research over the last three decades have considerably advanced New
Zealand’s capability to sustain forest birds through predator control (Brown et al. 2015)3.
They have enabled, for example, large-scale, temporally targeted aerial 1080 operations to
protect mainland bird (and other) species populations from the consequences of beech-
mast events in recent years (‘Battle for our Birds’; Elliott & Kemp 2016); associated research
could further improve the effectiveness, cost-effectiveness and hence potential scale of this
management (Brown et al. 2015; Elliott & Kemp 2016). In addition, over the last two
decades experience from island conservation combined with predator-proof fencing
technology has allowed conservation of native forest species in community-initiated fenced
mainland sanctuaries in both partly and mostly deforested landscapes (Burns et al. 2012;
Innes et al. 2012).

Despite growing conservation capability and expertise, it has been clear that many of New
Zealand’s vulnerable native forest bird species have continued to decline on the mainland in
recent decades (Innes et al. 2010; Robertson et al. 2013). In an associated report (Walker &
Monks 2017), we quantified changes in forest bird occupancy between 1969–1979 and
1999–2004 using standardised, spatially explicit, national-scale data derived from the
Ornithological Society of New Zealand’s (OSNZ’s) two national atlases of bird distribution.

Our results in a companion report (Walker & Monks 2017) showed that in addition to
predation, factors associated with dense human occupation had negative effects on native
forest bird species, especially deep endemics (i.e. taxa endemic to New Zealand at the levels
of order, family or genus). In this report we ask how, and how much, scarcity of indigenous
forest habitat affects the occupancy distributions of forest birds.

New Zealand’s indigenous forest cover has been greatly reduced, from over 80% of the land
area of North, South and Stewart Islands at the time of first human settlement, to
approximately 24% cover by the 1970s (Newsome 1987) and 23.8% today (LCRIT 2015). The
effects of indigenous forest loss on native forest bird species and communities have been
little studied compared to the effects of predation (but see Diamond 1984; Stevens 2006;
Barnagaud et al. 2014; Ruffell & Didham 2017).

Innes et al. (2010) suggested that scarcity of indigenous forest cover was the primary
limiting factor for most forest birds in New Zealand’s deforested landscapes. Recently,
Ruffell and Didham (2017) showed positive effects of indigenous forest and shrubland
cover4 on the abundances of some common forest birds near Auckland, which suggested

3
  Key initiatives in mainland multi -species predator control include those undertaken for North Island kōkako
(from 1989; Innes et al. 1999), mainland islands (from 1995; Saunders & Norton 2001; Gillies et al. 2003), kiwi
sanctuaries (from 2000; Robertson & de Monchy 2012), Operation Ark (from 2004; Elliott & Suggate 2007);
and long-term predator control programmes in sites such as the Eglinton, Hawdon and Landsborough valleys
and the Catlins (O’Donnell & Phillipson 1996; O’Donnell & Hoare 2012; Hoare et al. 2013; GE Elliott,
Department of Conservation, unpublished data), and large management experiments in the Tararua Range,
the Marlborough Sounds and South Westland (from 2010; GE Elliott, Department of Conservation,
unpublished data).
4
    ‘Indigenous forest’, ‘broadleaf indigenous hardwoods’, and ‘mānuka and kānuka’.

Page 2                                                                                        Landcare Research
Status and change in native forest birds on New Zealand’s mainland, 1969–1979 to 1999–2004 that abundance declined rapidly below 5‒10% forest cover for grey warbler and tūī. Both studies noted that growing interest in native forest bird conservation in deforested landscapes demands a better understanding of minimum forest habitat and area requirements. We investigate here how local richness and occupancy probabilities of forest birds vary with available forest habitat and with birds’ taxonomic level of endemism at a national scale, and consider the implications for forest bird conservation. We then investigate how forest bird occupancies are affected by mean annual temperature – an environmental factor that is likely to be closely associated with the abundance of some of their key predators. Ship rat (Rattus rattus) and Australian brushtail possum (Trichosurus vulpecula) are important forest-bird predators that are generally more abundant at lower elevations, where mean annual temperatures are generally higher (Studholme 2000; Christie et al. 2009, 2017; Kemp & Elliott, unpublished data; Fraser et al. 2004; Porphyre et al. 2013). If birds in warmer forests are under higher and more continuous pressure from predation, bird species that are more susceptible to predation are likely to have been lost earlier from warmer forests. Therefore we predicted that colder forests would be the principal refuges (‘thermal refuges’) for populations of predator-vulnerable forest birds. Evidence that vulnerable forest birds are becoming progressively confined to New Zealand’s colder forests would have implications for forest bird conservation. Because most of New Zealand’s colder forests are dominated by beech or rimu trees, this would explain and reinforce the importance of predator control in response to beech and rimu mast seeding events to protect predator-vulnerable forest birds (Elliott & Kemp 2016), whether or not mast events increase in frequency in the future (Kelly et al. 2013; Monks et al. 2016). It would also suggest that climate warming will exacerbate predation on forest birds in New Zealand forests by raising the elevation at which cold temperature limits bird predators (thus reducing the extent of the ‘cold forests’ zone below the treeline) and by favouring populations of cold-limited bird predators generally. 2 Background In an associated report (Walker & Monks 2017) we describe our development of a standardised set of data for New Zealand’s land birds from OSNZ’s two national atlases of bird distribution. The data set allows robust comparisons of the median probabilities of occupancy (i.e. use of or presence at a site) of 64 native bird taxa across New Zealand between 1969–1979 and 1999–2004. Using those data, we concluded that mainland range decreases between measurement periods were greatest (i) in wading birds, terns or gulls that breed mainly in the inland eastern South Island, and (ii) in forest and alpine birds, especially those endemic at high taxonomic levels (deep endemics). We concluded that predation was likely to be the primary cause of recent declines in forest and alpine birds, because there was little habitat change in remote natural areas where the declines were greatest. However, we found that factors associated with dense human occupation had additional negative effects on native forest bird species. Landcare Research Page 3
Status and change in native forest birds on New Zealand’s mainland, 1969–1979 to 1999–2004
In this report we use the same data set as developed in Walker & Monks (2017) to further
investigate spatial patterns of forest bird occupancy and identify potential drivers of change
and limitations on recovery.
3 Objectives
To investigate how scarcity of indigenous forest cover has affected native forest birds.
To ask whether colder forests have provided native forest birds thermal refuge from
predation.
To determine how the effects of indigenous forest cover loss and temperature vary
across levels of endemism and among native forest bird species.
4 Glossary of technical terms used
Deep endemic: a bird taxon that is endemic at the order, family or subfamily level (see
Taxonomic level of endemism).
Detection probability: the probability that a taxon will be detected at a site, if it is present.
Detection probabilities are usually less than 1, so not accounting for detection probabilities
will usually lead to occupancy probabilities being underestimated.
Endemic: a taxon is endemic if it is unique to a defined geographic location; in this case,
New Zealand. Non-endemic native and recently introduced taxa are also found elsewhere in
the world.
Geographic range occupancy (or range occupancy): the proportion of a given geographic
range that is occupied by a bird taxon, calculated as the average of local occupancy
probabilities across that range. The difference in average occupancy probability between
measurement periods represents the net change in the proportion of the geographic range
occupied.
Grid square or square: a square on the national grid. In this report we use a grid of
10,000 m (10 × 10 km) squares defined in the metric New Zealand Map Grid (NZMG)
coordinate system.
Local occupancy probability: the probability that a taxon is present in a particular grid
square.
Local richness: the number of taxa likely to occupy a square, calculated as the sum of
occupancy probabilities across taxa in that square. The most likely ‘real’ number of taxa is
the sum rounded to the nearest integer.
Log range occupancy ratio (LROR): a measure that expresses changes in range occupancy
relative to the previous measure. It is calculated as the natural log of the ratio of the
proportion of geographic range occupied in 1999–2004 to the proportion of geographic
Page 4 Landcare ResearchStatus and change in native forest birds on New Zealand’s mainland, 1969–1979 to 1999–2004 range occupied in 1969–1979. Large negative LRORs indicate large decreases relative to occupancy in 1969–1979, and large positive LRORs indicate large relative increases . Measurement period: the period of field survey for a national atlas of bird distribution compiled by the Ornithological Society of New Zealand (OSNZ; Bull et al. 1985; Robertson et al. 2007). Field surveys for the first atlas (the ‘first measurement period’) ran from September 1969 to December 1979 and for the second atlas (the ‘second measurement period’) from December 1999 to November 2004. Occupancy: presence at a site. Occupancy model: a model that combines estimates of probabilities of detection and occupancy at a site to estimate the probability that a taxon is actually present. Occupancy probability (or probability of occupancy): the probability that a taxon uses, or is present at, a site. Occupancy probability is expressed as a value between 0.0 and 1.0. Taxon (plural taxa): a species or a combination of species, subspecies, forms or varieties for which we fitted an occupancy model. For example, in this report the taxon ‘kiwi’ in the North Island refers to all recognised forms of Apteryx mantellii (‘North Island kiwi taxa’) and in the South Island it refers to A. rowi, A. haastii and all recognised forms of Apteryx australis (‘South Island kiwi taxa’) together. Taxonomic level of endemism (endemism level): the taxonomic level at which a taxon is endemic. High to low endemism levels in this report are represented by order, family, subfamily, genus and species taxonomic levels. Order level of endemism means that the bird’s order does not occur outside New Zealand. This is the case for kiwi, which belong to the endemic order Apterygiformes. In family-level endemics the family does not occur outside New Zealand. For example, rifleman and rock wren are family-level endemics because the New Zealand wren family (Acanthisittidae) does not occur outside New Zealand. High taxonomic levels of endemism indicate that the lineage of a species has probably been in New Zealand over a long geological time period, whereas non-endemic taxa are likely to have arrived more recently in geological time. We refer to taxa that are endemic at the order, family or subfamily levels as ‘deep endemics’. 5 Data 5.1 Standardised forest bird occupancy data set Our occupancy estimates for native forest bird taxa are derived from data in two national atlases of bird distribution compiled by the OSNZ (Bull et al. 1985; Robertson et al. 2007). Field surveys for the atlases were undertaken from September 1969 to December 1979 (1969–1979) and from December 1999 to November 2004 (1999–2004). We refer to these survey periods as the first and second ‘measurement periods’. We produced a standardised data set of median probabilities of occupancy for each of 22 indigenous forest bird taxa, at the centre of each of 2,155, 10 × 10 km grid squares, in each Landcare Research Page 5
Status and change in native forest birds on New Zealand’s mainland, 1969–1979 to 1999–2004

measurement period. The occupancy modelling process used is described in detail in an
associated report (Walker & Monks 2017). The variability in the probabilities used to
calculate the medians was not preserved and considered in subsequent analyses; for
example, through bootstrapping. Although this is not impossible, it is very computationally
intensive, and we have not been able to do it for the present analyses. As described in
section 6.3, we were primarily concerned to fit models taking into account spatial
autocorrelation – the fact that squares adjacent to each other are less independent than
those further apart – which has the potential to bias parameter estimates. Taking spatial
autocorrelation into account is itself a very computationally intensive process, which would
prevent bootstrapping.

As a result, uncertainty in our square-wise estimates of occupancy is not represented in our
analyses. Incorporating this uncertainty into our models could alter estimates of the
confidence intervals on the parameters of our models and therefore the inferred
‘significance’ or otherwise of effects.

The common grid of 2,155 squares excludes all locations not sampled in one or both atlases,
and excludes all squares covering more than 75% water (coasts and large inland lakes). Each
grid square was assigned to either the ‘North Island’ or the ‘South Island’. Nearshore islands
were assigned to the nearer of the two major islands, so that Stewart Island squares are
included in our definition of ‘South Island’. There are 1,083 North Island squares and 1,072
South Island squares, which cover 88% (99,510 km2) of the land in the North Island and 66%
(99,630 km2) of the land in the South Island and Stewart Island combined.

5.2      Native forest bird taxa

We follow Innes et al. (2010) in defining native forest birds as those that breed and feed
primarily in forest habitats. We differ from Innes et al. (2010) by including kea (Nestor
notabilis) as a forest bird5. The 22 forest bird taxa (Appendix 1) include all extant native
forest bird species that we were able to fit occupancy models for. Some of New Zealand’s
extant indigenous forest bird species were recorded too rarely in the atlases for their
occupancy to be estimated successfully. We omitted the following extant species or
subspecies from our study: little-spotted kiwi (Apteryx oweni, in the order Apterygiformes),
kākāpō (Strigops habroptilus, in the family Strigopidae), hihi/stitchbird (Notiomystis cincta,
in the endemic family Notiomystidae; Driskell et al. 2007); and North Island and South Island
saddleback (tīeke, Philesturnus carunculatus rufusater and P. carunculatus carunculatus,
both in the endemic family Callaeidae). We also excluded the North and South island bush
wrens (Xenicus longipes stokesii and X. longipes longipes, in the family Acanthisittidae;
Ericson et al. 2002) that inhabited forest and were recorded in the first atlas (Bull et al.
1985), but are now considered to be globally extinct (Robertson et al. 2013). We excluded

5
  O’Donnell et al. (2017) say it is a ‘popular misconception’ that kea use only alpine habitat. Kea feed and breed
in forest (although not exclusively; Jackson 1963; O’Donnell & Dilks 1986; Heather & Robertson 1996) and are
‘sequential foraging specialists, commonly found in coastal and montane forests and moving among numerous
seasonally available food sources ’ (O’Donnell et al. 2017; Kemp et al. in prep.).

Page 6                                                                                         Landcare Research
Status and change in native forest birds on New Zealand’s mainland, 1969–1979 to 1999–2004

South Island kōkako (Callaeas cinerea), of which there has been only one accepted sighting
since 1967 (in 2007; Miskelly et al. 2013). All the above taxa were recorded in fewer than 10
mainland squares in one or both atlases, and all are endemic to New Zealand at the order or
family level.

We had to combine the records of three species of parakeets/kākāriki (yellow-crowned, red-
crowned and orange-fronted) into a single taxon, and all forms of weka (Gallirallus australis)
into a single taxon, because a substantial proportion of atlas records were of unidentified
species. Different ‘kinds’ of South Island kiwi (Innes, Eppink et al. 2015) were not
distinguished in the first atlas of bird distribution for New Zealand (Bull et al. 1985), so we
treat all South Island kiwi (other than little spotted kiwi, Apteryx owenii, which was
excluded) as a single taxon, which combines all subspecies of tokoeka (Apteryx australis; i.e.
Haast, Fiordland and Rakiura tokoeka), rowi (Apteryx rowi) and great-spotted kiwi (Apteryx
haastii). We also treat South Island and Stewart Island robin (Petroica australis) subspecies
as a single South Island taxon.

Our occupancy models for North Island kōkako and whitehead were fitted from and
interpolated to squares only on the North Island. Our models for brown creeper, kea and
mohua were fitted from and interpolated only to South Island squares. For all other taxa we
fitted national models, which combined any recognised North Island, South Island and/or
Stewart Island species (in the case of robins Petroica longipes and P. australis), subspecies,
forms or varieties.

We grouped the 22 bird taxa according to their taxonomic level of endemism (Appendix 1),
and applied these as a proxy for the length of time that a lineage has been isolated in New
Zealand (Table 1). We refer to taxa endemic at levels 5, 6 and 7 (subfamily level and higher)
collectively as ‘deep endemics’.

Table 1 The seven taxonomic levels of endemism recognised in this report, showing the higher-level division
into endemic or non-endemic, and the number of forest bird taxa that are assigned to each category

Endemism level                              Endemic or non-endemic            Number of forest bird taxa
1. Recently self-introduced native                 Non-endemic                        1 (silvereye)
2. Non-endemic native                              Non-endemic                               2
3. Endemic at the species level                      Endemic                                 9
4. Endemic at the genus level                        Endemic                                 3
5. Endemic at the subfamily level                    Endemic                      1 (blue duck/whio)
6. Endemic at the family level                       Endemic                                 7
7. Endemic at the order level                        Endemic                        1 (kiwi species)

5.3    Environmental characteristics of the grid squares

We calculated the percentage indigenous forest cover, median mean annual temperature,
and road density across the land in each grid square from publicly available GIS surfaces
(Figure 1). Percentage indigenous forest cover is the percentage of land in the square that is

Landcare Research                                                                                          Page 7
Status and change in native forest birds on New Zealand’s mainland, 1969–1979 to 1999–2004

classified as indigenous forest in the Land Cover Database (LCDB2, which is based on
satellite imagery acquired during the summer 2001/02 measurement period; LCRIT 2015).

We use the estimate of percentage indigenous forest cover in summer 2001/02 in all of our
analyses, for two reasons. First, overall change in the area of indigenous forest cover across
New Zealand since the 1970s has not been great. Comparisons of estimates from the early
1980s (Newsome 1987) with the LCDB (LCRIT 2015) suggest a decrease from about 25.0% of
New Zealand’s land cover to 24.9% in 2002. A change of 0.1% may be within the margin of
measurement error, and does not provide strong evidence that there has been an overall
decrease in forest cover. Second, although it is likely that indigenous forest cover has
decreased markedly in some squares since the data were collected for the first atlas, there
is only one GIS layer available that describes the national distribution of indigenous forest
cover in the early 1980s (Newsome 1987). This layer is not sufficiently accurate, in our
opinion, to allow robust estimates of indigenous forest cover (and therefore change
between the early 1980s and 2001/02) at the level of individual grid squares.

Mean annual temperature was calculated as the median of mean annual temperature
estimated in the centre of each 100 m pixel of land in the square. It is derived from the
mean annual temperature data layer underlying the LENZ data set of Leathwick et al. (2003),
which is derived from temperature records between 1950 and 1980.

Road density was calculated as the length of all roads contained in the LINZ 25 m road
centrelines data set (in km), divided by land area in the square (in km2).

Page 8                                                                                       Landcare Research
Status and change in native forest birds on New Zealand’s mainland, 1969–1979 to 1999–2004

Figure 1 Environmental characteristics of the grid squares used in this report.

For the analysis we transformed these variables so that they spanned similar scales and
centred them on zero. We subtracted 50% from indigenous forest cover and scaled by
dividing by 100. Mean annual temperature was centred and scaled by dividing by the

Landcare Research                                                                            Page 9
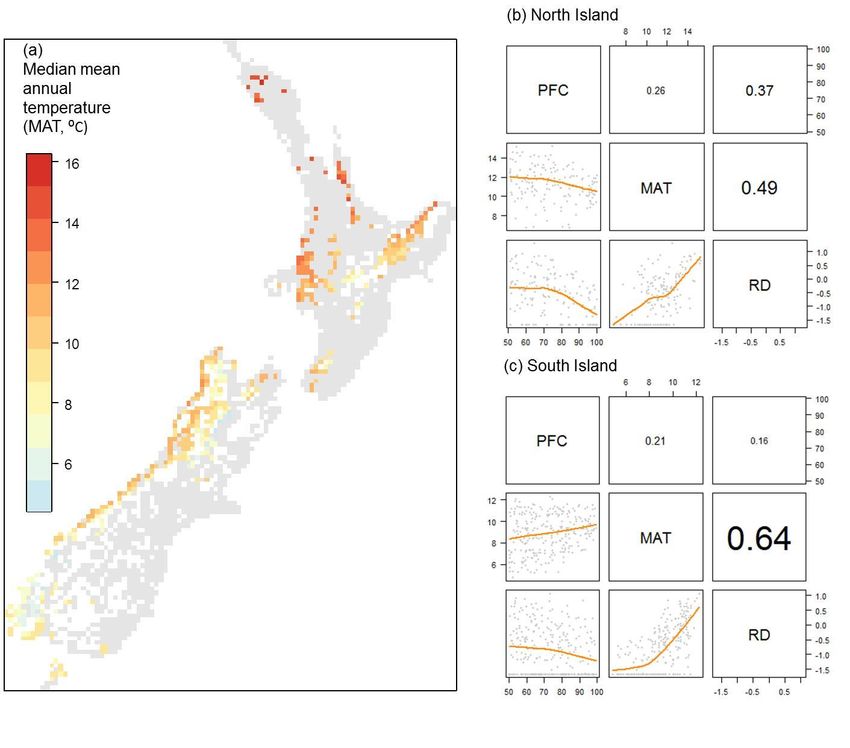
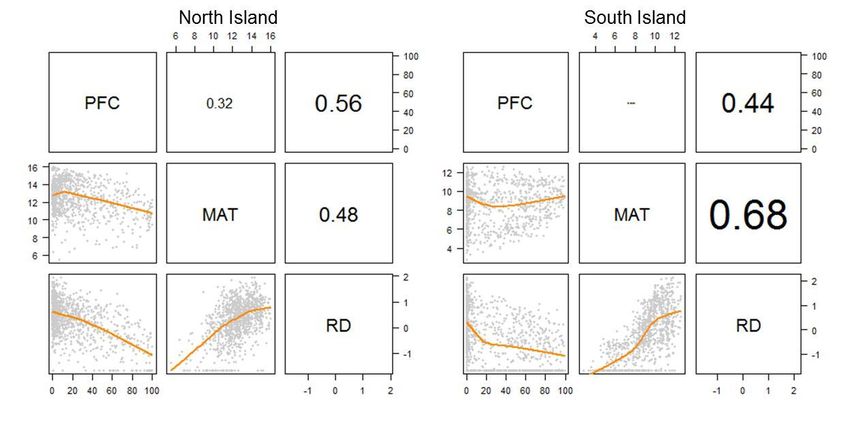
Status and change in native forest birds on New Zealand’s mainland, 1969–1979 to 1999–2004

standard deviation. The distribution of road density was highly non-linear. We transformed
it by first taking the square root, and then centring and scaling by dividing by the standard
deviation.

Temperature (represented by mean annual temperature) was expected to have an
important positive effect on the abundance of key predators of native birds (especially ship
rats and possums) in areas such as remaining forests that are less transformed by humans.
We note that alternative temperature parameters, such as minimum annual temperature or
winter temperature, may be more limiting to these predators than low mean annual
temperature. However, these alternatives are generally correlated with mean annual
temperature. We used road density as a proxy for the degree of human transformation of
the landscape by human occupation.

We plotted paired scatter plots and coefficients of correlation to examine relationships
between the square-level characteristics on each island. These show that RD (road density)
and MAT (mean annual temperature) are strongly positively correlated on both islands
(warmer areas are more densely settled, especially in the South Island, r = 0.68) (Figure 2).

Figure 2 Relationships between characteristics of the 2,155 grid squares in the North and South Islands. The
characteristics compared are labelled on the diagonal : PFC is percentage indigenous forest cover, shown on
the original scale; MAT is median mean annual temperature in degrees Celsius; and RD is the scaled and
centred square root of road density. In each set, plots below the diagonal show grid squares as points on
scatter plots and their relationships, depicted using local regression curves, as orange lines. Upper plots show
the associated coefficients of correlation (r) between pairs of characteristics, and larger text indicates stronger
correlation.

Warmer and more densely settled areas also had less forest (negative correlations between
PFC and both RD and MAT. This means that the effects of temperature, indigenous forest
cover and road density are somewhat confounded, and we need to take care to address this
in our interpretation.

Page 10                                                                                         Landcare Research
Status and change in native forest birds on New Zealand’s mainland, 1969–1979 to 1999–2004
6 Analyses
6.1 Summaries of status and change in occupancy
We summarise status in the 1999–2004 measurement period by plotting the average,
interquartile range (i.e. the middle 50% of estimates) and 95% limits of median probabilities
of occupancy for each bird taxon across the squares on each island. The average of median
local occupancy probabilities across squares is an estimate of the proportion of the
geographic range occupied by an individual bird taxon6.
We summarise changes in range occupancy between measurement periods using log range
occupancy ratios (LRORs – equivalent to log response ratios; Hedges et al. 1999). LRORs are
calculated as the natural log of the ratio of the proportion of geographic range occupied in
1999–2004 to the proportion of geographic range occupied in 1969–1979. Large negative
LRORs indicate large range contractions relative to 1969–1979, and large positive LRORs
indicate large relative range increases. Range contraction is an important signal of likely
population decline (Caughley & Gunn 1996).
6.2 Percentage of indigenous forest range occupied
To estimate the percentage of indigenous forest range occupied by each forest bird taxon
we:
multiplied its median probability of occupancy in each square by the area of
indigenous forest in that square
summed these estimates across squares on each island, and then
divided the sum by the total area of forest in squares on that island.
As explained in section 5.3, we assume – due to lack of dependable indigenous forest cover
data for 1969–1979 – that the same area of indigenous forest remained in both
measurement periods (i.e. we assume there was no forest cover change in any grid square
between measurement periods). The total area of indigenous forest covered by the 2,155
squares in 2001/02 is approximately 73% of the total mapped area of indigenous forest in
New Zealand at that time.
6
Calculating geographic range occupied empirically requires drawing either zeros or ones at random from a
binomial distribution with probability equal to the occupancy probability, and calculating the proportion of the
draws that are ones. However, if this process is repeated enough times, the estimate of proportion of range
occupied is identical to the average occupancy probability across the squares of interest.
Landcare Research Page 11Status and change in native forest birds on New Zealand’s mainland, 1969–1979 to 1999–2004
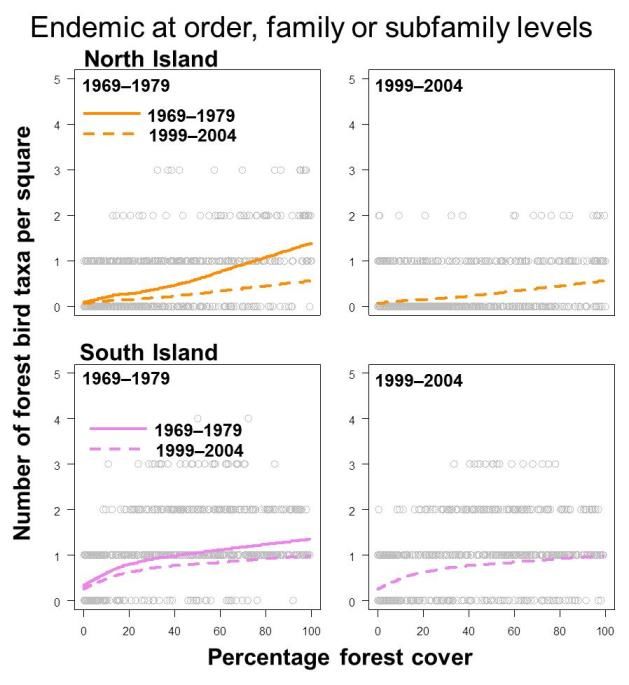
6.3 Effects of indigenous forest cover
6.3.1 Trends in local forest bird richness with indigenous cover
We estimated the number of forest bird taxa most likely to occupy each grid square in each
measurement period (local forest bird richness) by summing local median occupancy
probabilities across the relevant taxa. We plotted these estimates of local forest bird
richness (in total, and at different levels of endemism) against percentage indigenous forest
cover (a proxy for the proportion of land available to birds as forest habitat; section 5.3),
and used local regression to depict the mean trends. These trends were compared visually
only, and not by fitting models.
Summing occupancy probabilities (each between 0.0 and 1.0) across taxa results in non-
integer estimates of the most likely number of forest bird taxa per square. However, only a
whole number of species can possibly occupy a square in reality. We fitted our local
regression curves to the raw (non-integer) estimates, but follow our convention in Walker &
Monks 2017 and plot local richness estimates for squares after rounding to the nearest
integer, showing the most likely ‘real’ outcome.
6.3.2 Trends in probabilities of occupancy with indigenous cover
We fitted and plotted locally weighted regression curves of the median occupancy
probability of individual taxa on percentage indigenous forest cover for each taxon, island
and measurement period. As with local richness trends (section 6.3.1), these are presented
for visual comparison only.
We then supplemented these purely descriptive approaches (sections 6.3.1 and 6.3.2) with
models that test whether percentage indigenous forest cover, time (measurement period)
and endemism level ‘significantly’ affected median occupancy probabilities of native forest
birds, and how they interact. These models were fitted as linear mixed effects (lme) models
using the R package lme47.
Median occupancy probability was modelled as the logit (natural log of x/(1–x)) of the
probability(x). Taxon and family were included as random effects to account for non-
independence of repeated measures on the same taxon and among taxa in the same bird
family. Measurement period was a two-level factor predictor variable, and we treated
7
Our lme models don’t take into account that squares adjacent to each other are less independent than those
further apart (‘spatial autocorrelation’), and models fitted without accounting for spatial autocorrelation can
yield unreliable parameter estimates. To be confident that lme model results were robust, we therefore also
attempted to fit all models as conditional autoregressive (CAR) mixed models using a Bayesian approach and
the software Stan interfaced through the R package RStan v. 2.14.1. We describe this process and compare its
outputs to those from our linear mixed effects (lme) models in Appendix 7.
Page 12 Landcare ResearchStatus and change in native forest birds on New Zealand’s mainland, 1969–1979 to 1999–2004
levels of endemism as a centred continuous predictor variable with equally spaced8 integer
values of −3 (recently self-introduced) to 3 (endemic at the taxonomic level of order).
Responses of occupancy probability to these predictors were fitted as linear terms.
Our models of 64 native land birds in Walker & Monks (2017) showed (1) that deep endemic
birds had lower median occupancy probabilities than non-endemic taxa, and showed bigger
decreases in occupancy probabilities between measurement periods ; and (2) that factors
associated with human occupation (represented by an index of road density) have inhibiting
effects on forest birds, with greater effects on deep endemics. For our subset of native 22
forest bird taxa, we expected that the main predictors of occupancy and occupancy change
would be endemism level and loss of indigenous forest cover (associated with human
transformation of the landscape).
We fitted a model (Model F1) for each island with a full three-way interaction of
measurement period, endemism level and percentage indigenous forest cover as predictors,
and plotted their effects. We expected that:
median probabilities of occupancy would increase with percentage indigenous
forest cover (which represents available primary habitat)
if forest loss is more harmful to birds from lineages that have evolved longer on
a New Zealand land mass with few non-forest environments until the
Pleistocene (Lee et al. 2016), the effects of indigenous forest cover and
endemism level on occupancy would interact
recent (i.e. 1969–1979 to 1999–2004) decreases in forest bird occupancy
probabilities would have been greater in squares with more indigenous forest
cover, because occupancy probabilities were low in deforested squares by 1969–
1979 (i.e. there were fewer left to lose)
the greater decreases in occupancy probabilities in deep endemics (compared to
non-endemic taxa) would occur mainly in places with more indigenous forest
cover, because we expected that by 1969–1979 deep endemics would have
been more thoroughly extirpated from deforested places than non-endemic
taxa.
6.4 Effects of temperature on occupancy probabilities
Ship rats and possums are important predators of native forest birds and are known to be
more abundant in warmer environments. If forest bird populations are under greater and/or
more continuous pressure from predation in warmer environments, predation-susceptible
species will have been lost more rapidly, and earlier, from warmer squares than colder
8
We use endemism level as a proxy for the length of time that a taxon’s lineage has evolved in New Zealand.
Equal spacing of endemism levels seems appropriate because there is an approximately linear relationship
between equally spaced levels and estimated dates of phylogenetic divergence of these taxa from their
nearest non-native relatives (S Walker, A Monks, BJM Potter and J Innes, unpublished data).
Landcare Research Page 13Status and change in native forest birds on New Zealand’s mainland, 1969–1979 to 1999–2004
squares. If forest habitat is also important for forest birds, we would expect cold forested
squares to be the principal refuges (‘thermal refuges’) of populations of predator-vulnerable
forest birds.
To test these expectations, we fitted lme models of native forest bird median occupancy
probabilities for each island, with a full four-way interaction of measurement period,
endemism level, indigenous forest cover and temperature (Model F2). Each model also
included a term for road density, and the interaction between endemism and road density,
because we anticipated (based on results in Walker & Monks 2017) that squares with more
roads at any given indigenous forest cover and temperature could have lower occupancy
probabilities of deep endemic birds and higher occupancy probabilities of non-endemics.
We plotted the effects of these variables, with the following expectations.
Native forest birds would have lower median occupancy probabilities in warmer
squares than in colder squares (where we expect greater and more continuous
pressure from predation).
The adverse effects of warmer temperature would be greater on deep endemics,
which evolved longer on a New Zealand land mass without predatory mammals.
Negative effects of temperature would be more evident at higher levels of forest
cover, because warmer temperatures can only adversely affect native forest birds that
depend on forest habitat where they survive.
Negative effects of temperature in squares with high forest cover would be greater on
deep endemic birds, which are likely to be more sensitive to predation than non-
endemic taxa.
We did not expect that local occupancy probabilities of forest birds would necessarily have
declined more between measurement periods in warmer squares. This was because we
anticipated that warmer squares might have already lost most of their vulnerable birds prior
to 1969–1979, leaving few left to lose.
6.5 Effects of temperature in ‘deep forests’
Warmer sites in New Zealand are generally more densely inhabited and disturbed by
humans (see Figure 2). As far as possible we wanted to isolate the effects of temperature
from those of human disturbance, which could potentially also affect occupancy.
We therefore next analysed data only from those squares with ≥50% indigenous forest
cover, which we call ‘deep forests’. The samples are relatively small: 162 North Island
squares (15% of the 1,082 in our full data set) and 277 South Island squares (26% of 1,073).
Nevertheless, because these squares are the least disturbed by humans, evidence for
temperature effects here would give us greater confidence that factors other than greater
human disturbance are responsible.
We fitted models of native forest bird occupancy in deep forests with a three-way
interaction of measurement period, endemism level and temperature. We included road
Page 14 Landcare ResearchStatus and change in native forest birds on New Zealand’s mainland, 1969–1979 to 1999–2004 density and indigenous forest cover as fixed effects because even these deep forest squares experience certain amounts of human disturbance, and we expected levels of both human disturbance and indigenous forest cover to have additional effects on native forest bird occupancy. Species and family were again random effects in these models. Lastly, we show how median probabilities of occupancy in individual native forest bird taxa varied across the temperature gradients in remaining deep forests. We did this by fitting and plotting local regression curves of occupancy probabilities on median mean annual temperature in deep forests on both islands, in each measurement period. 6.6 Cold forests: thermal refuges from predation? Although we expected that predation pressures in cold forests would be lower than in warm forests much of the time, colder forests are not free from predators. In addition, many colder forests are beech or rimu-dominated and periodically experience large predator irruptions associated with mast seeding events (Ruscoe et al. 2004; Harper 2005; Brown et al. 2015; Elliott & Kemp 2016). We used fitted effects from our deep forest models (Model F3) to assess whether the thermal refuge provided for native forest bird populations by cold forests had diminished over time. We defined a thermal refuge effect as the difference in occupancy probability between a cold site and a warm site, all else (i.e. endemism level and indigenous forest cover) being equal. We used our deep forest models (fitted as described in section 6.5) to predict occupancy probabilities in warm sites and cold sites on each island for birds at each level of endemism in each measurement period. We then subtracted estimates of occupancy probabilities in warm sites from estimates in cold sites and compared these differences (i.e. thermal refuge effects) between 1969–1979 and 1999–2004. We needed to calculate thermal refuge effects over realistic intervals of temperature on each island. On each island we use a 4.5⁰C interval of mean annual temperature (MAT): 9.1 to 13.6⁰C in the North Island and 6.6 to 11.3⁰C in the South Island. These ranges approximately encompass the central 90% of median MAT values in deep forest squares on each island. 7 Results 7.1 Status and change in occupancy We fitted occupancy models for 22 native forest bird taxa (Walker & Monks 2017), of which 19 occur in the North Island and 20 in the South Island. These taxa are listed in Appendix 1, along with their scientific names and highest taxonomic levels of endemism. Figure 3 summarises their status in 1999–2004, and changes in range occupancy between measurement periods (as log ratios of range occupancy, LRORs) on each island. In each plot we arrange taxa in order of decreasing level of endemism, and in order of increasing range Landcare Research Page 15
Status and change in native forest birds on New Zealand’s mainland, 1969–1979 to 1999–2004

occupancy within endemism levels. Appendix 2 summarises the occupancy status of taxa in
each measurement period and tabulates their LRORs.

Figure 3a and Appendix 2 show that the most range restricted of native forest bird taxa on
both islands in 1999–2004 were endemic at the order, family and subfamily levels, or at the
species level (weka, blue duck, kiwi species, kākā and long-tailed cuckoo on both islands,
North Island kōkako, parakeet species and rifleman in the North Island, and mohua in the
South Island). Two species-level endemics (grey warbler and fantail) and the self-introduced
silvereye occupied the largest geographic ranges on both islands.

Range occupancies differed greatly between the North and South Island in some taxa: for
example rifleman, bellbird and tomtit occupied considerably larger ranges in the South
Island than the North Island, while kererū, tūī, grey warbler, fantail, morepork, shining
cuckoo and silvereye occupied larger ranges in the North Island (Figure 3a, Appendix 2).

The log ratio of range occupancy (LROR) is a relative rather than absolute measure of
change in a species range. The most negative log range occupancy ratios show that the
largest relative range declines between measurement periods occurred in blue duck, weka,
rifleman, kākā and long-tailed cuckoo on both islands, and in North Island brown kiwi, North
Island kōkako and North Island robin in the North Island (Figure 3b, Appendix 2). LRORs also
show notable range declines in parakeet species in the North Island, and in kererū,
morepork, tūī, tomtit and kiwi taxa in the South Island.

LRORs were positive for parakeet/kākāriki species in the South Island, for whitehead, kererū
and tūī in the North Island, and for bellbird, grey warbler, fantail, shining cuckoo and
silvereye on both islands.

When interpreting LRORs it is important to note that we do not display confidence limits,
which may be considerable in some taxa. Furthermore, although LRORs give us better
resolution of relative changes in taxa that are comparatively rare, estimates for rarer taxa
should be regarded with particular caution. This is because they will be more strongly
influenced by chance variations in the location of sampling effort between the two atlases,
and by records in one or two grid cells, than more widespread taxa.

For example, although the LROR for mohua in the South Island was positive (Figure 3b,
Appendix 2), the net increase in range and the positive LROR largely reflect records, in the
late 1990s, of a newly discovered population on Mt Stokes in Marlborough. This population
subsequently became extinct (Gaze 2003). The LROR is faithful to data in the atlases, but the
large relative increase that it shows in mohua range is unlikely to have actually occurred.

Page 16                                                                                      Landcare Research
You can also read