Reporting on the state of the New Zealand marine environment: recommendations for ocean indicators as part of the Atmospheric and Ocean Climate ...
←
→
Page content transcription
If your browser does not render page correctly, please read the page content below
Reporting on the state of the New Zealand marine
environment: recommendations for ocean indicators
as part of the Atmospheric and Ocean Climate
Change Tier 1 Statistic
New Zealand Aquatic Environment and Biodiversity Report No. 151

        M.H. Pinkerton
        R. Bell
        S.M. Chiswell
        K. Currie
        A.B. Mullan
        G. Rickard
        C. Stevens
        P. Sutton

ISBN - 978-0-908334-01-8 (online)
ISSN -1179-6480 (online)

April 2015
Requests for further copies should be directed to:

Publications Logistics Officer
Ministry for Primary Industries
PO Box 2526
WELLINGTON 6140

Email: brand@mpi.govt.nz
Telephone: 0800 00 83 33
Facsimile: 04-894 0300

This publication is also available on the Ministry for Primary Industries websites at:
http://www.mpi.govt.nz/news-resources/publications.aspx
http://fs.fish.govt.nz go to Document library/Research reports

© Crown Copyright - Ministry for Primary Industries
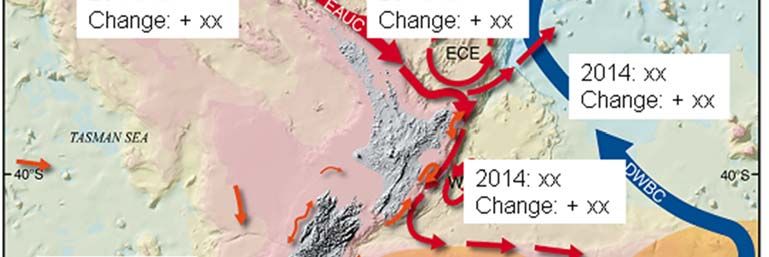
TABLE OF CONTENTS

1         INTRODUCTION                                                  3

2       NEW ZEALAND ENVIRONMENTAL REPORTING                             4
    2.1   Purpose of indicators                                         4
    2.2     Framework for environmental reporting in New Zealand        4
    2.3     Tier 1 statistics                                           5
       2.3.1     What are Tier 1 statistics?                            5
       2.3.2     Environmental Tier 1 statistics                        5
       2.3.3     Principles for Tier 1 statistics                       5
       2.3.4     Key criteria for indicators within Tier 1 statistic    9
       2.3.5     Funding for environmental Tier 1 statistics           11
    2.4     National Environmental Reporting                           12
    2.5     Environment domain plan                                    12
       2.5.1    Climate change topic area                              13
       2.5.2    Coastal and marine environment topic area              13
       2.5.3    Available data identified in the EDP                   14
    2.6     Other indicators and environmental reporting               15
      2.6.1      Marine Environmental Monitoring Programme (MEMP)      15
      2.6.2      MPI deepwater ecosystem indicators                    15

3         OCEAN TIER 1 STATISTIC: RECOMMENDATIONS                      16
    3.1     Sea level                                                  16
       3.1.1     Scientific background                                 16
       3.1.2     Base datasets                                         17
       3.1.3     Candidate indicators                                  18
       3.1.4     Assessment against Tier 1 principles and protocols    20
       3.1.5     Recommended indicator(s) for Ocean Tier 1 statistic   20
       3.1.6     Future steps                                          21
    3.2     Sea surface temperature                                    23
       3.2.1    Scientific background                                  23
       3.2.2    Base datasets                                          23
       3.2.3    Candidate indicators                                   26
       3.2.4    Assessment against Tier 1 principles and protocols     27
       3.2.5    Recommended indicator(s) for Ocean Tier 1 statistic    31
       3.2.6    Future steps                                           35
    3.3     Ocean circulation / water masses                           35
       3.3.1    Scientific background                                  35
       3.3.2    Base datasets                                          36
       3.3.3    Candidate indicators                                   37
       3.3.4    Assessment against Tier 1 principles and protocols     38
       3.3.5    Recommended indicator(s) for Ocean Tier 1 statistic    39
       3.3.6    Future steps                                           39
    3.4     Ocean Primary Productivity                                 41
      3.4.1      Scientific background                                 41
      3.4.2      Base datasets                                         41
      3.4.3      Candidate indicators                                  43
      3.4.4      Assessment against Tier 1 principles and protocols    43
      3.4.5      Recommended indicator(s) for Ocean Tier 1 statistic   46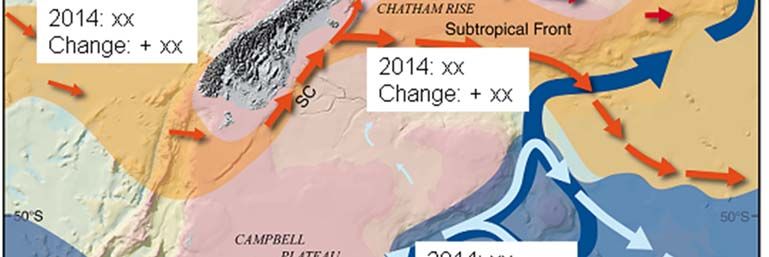
3.4.6    Future steps                                           48
    3.5     Coastal Storm Events                                       48
       3.5.1    Scientific background                                  48
       3.5.2    Base datasets                                          49
       3.5.3    Candidate indicators                                   50
       3.5.4    Assessment against Tier 1 principles and protocols     52
       3.5.5    Recommended indicator(s) for Ocean Tier 1 statistic    54
       3.5.6    Future steps                                           56
    3.6     Open ocean extreme wave events                             57
       3.6.1    Scientific background                                  57
       3.6.2    Base datasets                                          57
       3.6.3    Candidate indicators                                   58
       3.6.4    Assessment against Tier 1 principles and protocols     59
       3.6.5    Recommended indicator(s) for Ocean Tier 1 statistics   59
       3.6.6    Future steps                                           60
    3.7     Ocean Acidity                                              61
       3.7.1    Scientific background                                  61
       3.7.2    Base datasets                                          61
       3.7.3    Candidate indicators                                   61
       3.7.4    Assessment against Tier 1 principles and protocols     62
       3.7.5    Recommended indicator(s) for Ocean Tier 1 statistic    64
       3.7.6    Future steps                                           66
    3.8     Climate Indices                                            66
       3.8.1    Scientific background                                  66
       3.8.2    Base datasets                                          66
       3.8.3    Candidate indicators                                   66
       3.8.4    Assessment against Tier 1 principles and protocols     69
       3.8.5    Recommended indicator(s) for Ocean Tier 1 statistic    71
       3.8.6    Future steps                                           75
    3.9     Coastal water quality                                      76
      3.9.1    Scientific background                                   76
      3.9.2    Base datasets                                           76
      3.9.3    Candidate indicators                                    76
      3.9.4    Assessment against Tier 1 principles and protocols      76
      3.9.5    Recommended indicator(s) for Ocean Tier 1 statistic     78
      3.9.6    Future steps                                            79

4      CONCLUSIONS                                                     79

5      ACKNOWLEDGEMENTS                                                80

6      REFERENCES                                                      80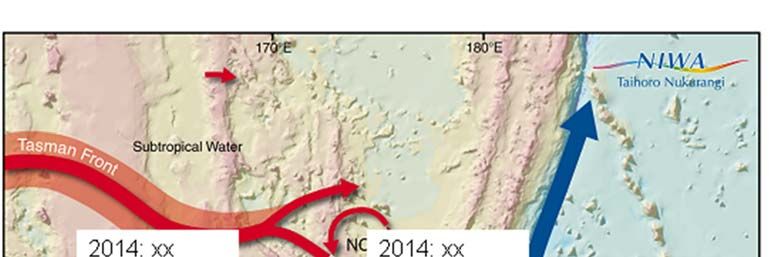
EXECUTIVE SUMMARY
Pinkerton, M.H.; Bell, R.; Chiswell, S.M.; Currie, K.; Mullan, A.B.; Rickard, G.; Stevens, C.;
Sutton, P. (2015).
Reporting on the state of the New Zealand marine environment: recommendations for ocean
indicators as part of the Atmospheric and Ocean Climate Change Tier 1 Statistic.
New Zealand Aquatic Environment and Biodiversity Report No. 151. 85 p.
This study has considered a wide variety of data that are relevant to reporting on trends, cycles and
variability in the New Zealand marine environment including oceanic and coastal seawater as well as
estuaries. Of particular interest are observations that may be linked to climate variability and long term
climate change. The purpose of the study was to identify a set of indicators which together would form
a new Tier 1 statistic on ocean climate change. The recommended indicators are given in the table below
with a preliminary ranking of whether the indicator is: (1) of broad interest, including to policy makers,
the business community, other stakeholders and the general public; (2) based on reliable data and robust
analysis; (3) can be communicated effectively and can be understood (though it is not necessary to
prove a causal link between climate change and the indicator for it to be useful as a Tier 1 statistic); (4)
is likely to be available for the medium to long term (more than 10 years hence). Note that this ranking
is based on expert opinion and is indicative only.
Recommended components for Ocean Tier 1 statistic. The recommended indicators are presented in decreasing order
of how likely they are to be useful as part of the Ocean Tier 1 statistic. However, different people and organisations
may have different criteria for “usefulness” so this order is indicative only.
Rank Indicator Brief description
1 Relative mean sea Sea level derived from coastal tide gauges round the New Zealand coast.
level This could be compared with the average sea level over the period for
which consistent data exist.
2 Sea-surface Sea surface temperature (SST) measured at 11 coastal sites across New
temperature (coastal) Zealand. This could be compared with the average coastal SST over the
period for which consistent data exist.
3 Ocean phytoplankton Concentration of chlorophyll-a, the ubiquitous phytoplankton pigment, as a
biomass proxy for the biomass of phytoplankton and hence potential ocean
productivity. This could be compared with the average chl-a concentrations
over the period for which consistent data exist.
4 Sea-surface Temperature of the surface ocean of the New Zealand EEZ from satellite
temperature (satellite) measurements. This could be compared with the average sea surface
temperature over the period for which consistent data exist.
5 Ocean acidity (Munida The pH of seawater at the Munida time series site (offshore of Dunedin) as
pH) an index of ocean acidity. This could be compared with the average pH over
the period for which consistent data exist.
6 Coastal extreme wave Area-by-area quantification of the number of large wave events in New
index Zealand coastal region in the previous year. This could be compared with
the average number of such events over the period for which consistent data
exist.
1
7= Open ocean extreme Area-by-area quantification of the number of large wave events in the
wave index previous year. This could be compared with the average number of such
events over the period for which consistent data exist.
1
7= Ocean storm index Number of deep low centres (cyclones) in four quadrants covering the New
(cyclone counts) Zealand region. This could be compared with the average frequency of such
events over the period for which consistent data exist.
Ministry for Primary Industries Ocean Climate Change indicators 1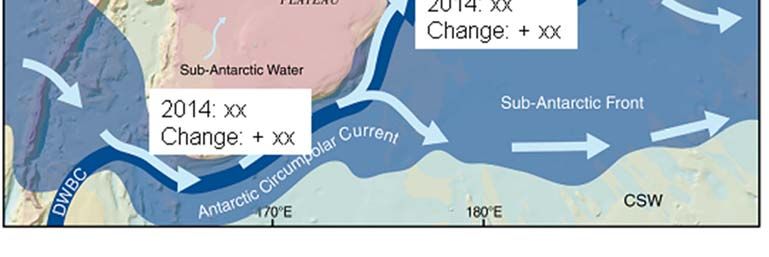
Rank Indicator Brief description
8 Water Changes to sea surface height measurements from satellite altimeters and
masses/circulation inferred ocean circulation patterns.
9 Airflow index Two circulation indices, derived from pressure gradients, which show how
west-east and south-north airflow in the New Zealand region compared to
the long-term average. This could be compared with the average pressure
gradients over the period for which consistent data exist.
10 Coastal water quality Incidence of harmful or toxic algae detected from regulatory monitoring of
(harmful algae) shellfish harvesting and aquaculture. This could be compared with the
average incidence of harmful algal bloom events over the period for which
consistent data exist.
1
Either only one of these indicators should be selected or they will be combined into a single indicator
of extreme offshore weather events.
2 Ocean Climate Change Indicators Ministry for Primary Industries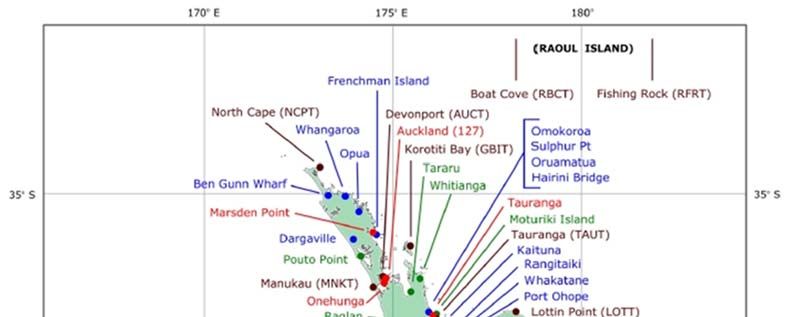
1 INTRODUCTION As in other parts of the world, indicators are used in New Zealand to measure and disseminate information on changes in the environment. One important part of this is reporting on changes to the marine environment. For the purposes of this report, the domain of the marine environment is defined as the region extending from the mean high water mark to the edge of the New Zealand Exclusive Economic Zone (EEZ). Estuaries1 are included in the marine domain. This project (Ministry for Primary Industries, MPI project ZBD2012-02) is concerned with the development of the new Ocean Tier 1 statistic. Tier 1 statistics are the key official statistics used by the New Zealand government to underpin governance and communicate New Zealand performance domestically and internationally (Statistics New Zealand, 2007). “Performance” in this context depends on the type of activity or process that the Tier 1 statistic is reporting on. For environmental statistics, “performance” means the extent to which levels of natural capital and biodiversity are preserved to ensure that meeting the needs of the present does not compromise the ability of future generations to meet their own needs (Statistics New Zealand, 2008). The Ocean Tier 1 statistic will form part of the “Atmosphere and Ocean Climate Change” Tier 1 statistic. Specific objectives Specific Objective 1 The Contractor will perform a preliminary investigation and identify candidate datasets for examination against Tier 1 criteria, taking into account progress towards environmental reporting through the Environmental Domain Plan (Marine). Completed February 2014 Specific Objective 2 The Contractor will host a collaborative and consultative workshop to introduce and discuss each potential ocean indicator for its usefulness as a Tier 1 statistic. Key activities include: i. Prepare summary of variables for collaborative workshop;; ii. Determine workshop participants and schedule suitable workshop date; and iii. Host / collaborate on hosting workshop. Workshop held on Tuesday 11th March 2014 at NIWA, Wellington Specific Objective 3 The Contractor will perform a detailed examination and production of selected datasets against Tier 1 criteria, including completing any additional investigations suggested from the workshop in specific objective 2. Draft final report provided to MPI on 10th July 2014 Specific Objective 4 The Contractor will present a final workshop and introduce the indicators from objective 3. Key activities include: i. Prepare summary of variables for collaborative workshop; ii. Determine workshop participants and schedule suitable workshop date; and iii. Host / collaborate on hosting workshop. Final workshop held Friday 5th September 2014 at NIWA, Wellington 1 An estuary is defined as: "A partially enclosed coastal body of water that is either permanently or periodically open to the sea in which the aquatic ecosystem is affected by the physical and chemical characteristics of both runoff from the land and inflow from the sea" [Estuary Environment Classification, http://www.niwa.co.nz/coasts- and-oceans/nz-coast/learn-about-coastal-environments/estuary-types] Ministry for Primary Industries Ocean Climate Change indicators 3
2 NEW ZEALAND ENVIRONMENTAL REPORTING
2.1 Purpose of indicators
In the New Zealand context, decisions about managing natural resources, and the development of
environmental policy depend on reliable, evidence-based information on the state of the environment.
New Zealanders in general, including the public and businesses, need information they can trust on the
environment to participate in an informed debate about how we balance environmental goals with other
social, cultural and economic aspirations (MfE, 2014a).
A wide range of threats and pressures on the New Zealand marine environment have been identified
(Ministry for the Environment 2007, MacDiarmid et al. 2012a, b). Such threats include climate
variability and change (and associated effects such as ocean acidification impacts, Caldeira & Wickett
2003, Willis et al., 2007), fishing impacts, land-based effects (such as sediment runoff and pollution),
and risks associated with offshore engineering, shipping, and exploration and extraction of minerals
and petrochemicals (MacDiarmid et al. 2012a, b).
Marine indicators can be used to help monitor changes to the marine environment in relation to the
combined effects arising from threats such as those outlined above (OECD 1993, 1998, 2003; Garcia
& Staples 2000). It is clear that there is not one “best” set of indicators because the utility of the indicator
depends on the intended purpose. For example, indicators can also be classified by type using the
European Environment Agency’s typology (European Environment Agency, 2003). This typology
distinguishes four types of indicator, each of which addresses a different question and provides different
information.
• Descriptive indicators: What is happening in the environment and to people? These
indicators describe key environmental issues and their impact on people, and show changes
over time.
• Performance indicators: Is a policy or management approach making a difference? These
indicators compare actual conditions against a set of reference conditions (for example,
progress towards targets, goals, or environmental objectives).
• Efficiency indicators: Are we improving? These indicators relate environmental pressures
to people’s activities, and to the efficiency of products and processes. Activities are
measured in terms of the resources they use and the emissions and waste they generate.
• Total welfare indicators: Are we better off? These indicators are one measure of social,
economic, and environmental well-being. In this way, they are indicators of sustainability.
This report aims to identify information relevant to reporting on the state of New Zealand’s ocean
domain, including in relation to climate variability and change – i.e. a set of descriptive indicators
focussed on the environment rather than its impact on people.
2.2 Framework for environmental reporting in New Zealand
New Zealand environmental reporting has included two State of the Environment Reports, co-ordinated
by the Ministry for the Environment (MfE, 1997, 2007). Marine environmental reporting in New
Zealand is under review at the time of writing, and in the future is likely to have two main strands: (1)
environmental Tier 1 statistics co-ordinated by Statistics New Zealand (“Statistics NZ” henceforth) and
updated as appropriate (probably annually) (Section 2.3); (2) a 3-year cycle of reporting on five
environmental domains (one domain report published every six months) co-ordinated by MfE with
Statistics NZ) as mandated under the Environmental Reporting Bill (introduced to Parliament 20
February 2014) (Section 2.4). There is also substantial work underway on marine indicators for
particular management purposes (Section 2.6); for example, the development of indicators to help
manage New Zealand’s deepwater fisheries (Tuck et al., 2009, 2014).
4 Ocean Climate Change Indicators Ministry for Primary Industries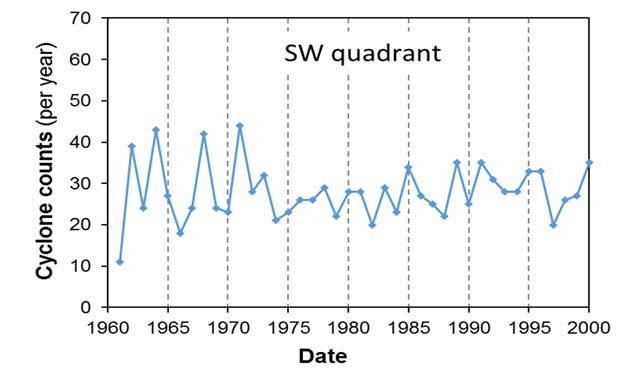
2.3 Tier 1 statistics
2.3.1 What are Tier 1 statistics?
Information given here on Tier 1 statistics is largely taken from online information provided by
Statistics NZ as of April 2014 (www.Statistics.govt.nz). Tier 1 statistics are the highest level of
statistical reporting in a country (Statistics NZ, 2007, 2008). Tier 1 statistics are the key official statistics
used by the New Zealand government to underpin governance and to communicate New Zealand’s
performance domestically and internationally. Thus, Tier 1 statistics:
• are essential to central government decision-making;
• are of high public interest;
• meet public expectations of impartiality and statistical quality;
• require long-term continuity of the data and are enduring (i.e. the set of Tier 1 statistics
should not change frequently); and
• provide international comparability in a global environment.
Designating a portfolio of Tier 1 statistics:
• ensures that we focus on the most important statistics for New Zealand;
• enables the prioritisation and rationalisation of statistical investment and effort across the
Official Statistics System, to ensure that a set of the most important statistics are produced; and
• ensures that Tier 1 statistics are of the highest quality and can be relied on as authoritative,
relevant and trustworthy.
Tier 1 statistics are managed as part of the Official Statistics System (OSS), led by the Government
Statistician and overseen by the OSS Chief Executives Steering Group and the Ministerial Advisory
Committee on Official Statistics. The investment in Tier 1 statistics is managed through the Government
Statistician’s annual purchase advice and normal Budget processes.
2.3.2 Environmental Tier 1 statistics
In October 2012 the New Zealand Government signed off on a set of new Tier 1 Statistics to be
developed under the Natural Resources Sector. This new set (Statistics NZ, 2012) includes the Tier 1
statistic “Atmosphere and Ocean Climate Change” (present project), “Coastal and Recreational Coastal
Water Quality”, “Ecological Integrity and Diversity” and “Marine Biodiversity”.
A Tier 1 statistic can be either a single statistic or a specified set of statistics. The Tier 1 Ocean statistic
will be the latter, i.e. it will include a small number of different indicators in the order of 4 – 8 separate
indicators. These indicators taken together will provide a picture of environmental change in New
Zealand’s marine environment. Future candidates for Ocean Tier 1 statistics (or separate indicators
within a Tier 1 statistic) can also be proposed where the statistical measurement framework is still under
development and is expected to be finalised in the next five years.
2.3.3 Principles for Tier 1 statistics
Detailed principles and protocols for the development of Tier 1 statistics are given by Statistics NZ
(Statistics NZ, 2007) and summarised in Table 1 and Table 2 Principles 7 (Protecting respondent
information) and 8 (Minimising respondent load) are not relevant to the current project as no data
considered in the present report are from respondent surveys.
Ministry for Primary Industries Ocean Climate Change indicators 5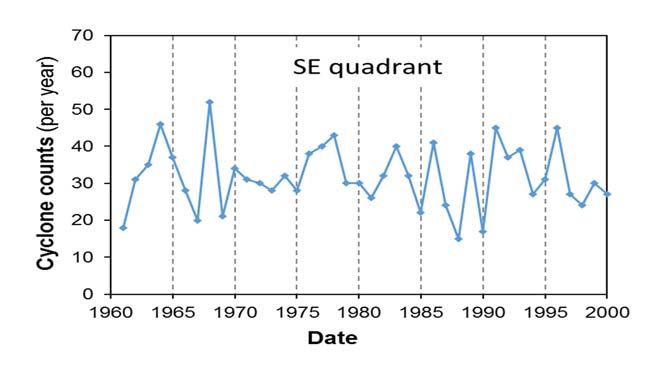
Table 1: Principles for Tier 1 statistics. Note that this is a two page summary of Statistics NZ (2007), which is a 71 page
document, so that some text has been shortened, especially when of less relevance to environmental reporting.
# Principle Key elements of principles
1 Relevance Meet the needs of government, business and the community (within available
resources).
Have clear objectives (identify the information needs that they address).
Periodically reviewed/assessed to ensure their relevance and to justify continued
data collection.
2 Integrity Follows international best practice (re data collection, confidentiality, privacy, and
release).
Selection of data sources, methods and procedures is based on best scientific
practice (taking into account cost implications to government and providers).
Decisions surrounding the prioritisation of statistical needs are transparent.
Impartial - analysis/compilation, reporting, and release of data is free from external
influences.
Data are presented in a manner that is easy to understand.
Data sources are credited/acknowledged.
3 Quality Professional competence underpins all official statistics activity.
Culture of continuous improvement and statistical best practice and evaluation.
Processes and methods used to produce official statistics, including measures of
quality such as estimated measurement errors, are fully documented and are
available for users to understand the data and judge the quality.
Reliable and relevant data are collected from the most appropriate source.
Data revisions to ongoing statistical series follow a regular, well-established and
transparent schedule. If a significant error is found in the data, the corrected data
are made publicly available as soon as possible after the identification of the error.
4 Coherence Common statistical frames, definitions and classifications are used to provide
consistency over time and between datasets. National and international frameworks
and classifications are used wherever possible.
Automated processes/methods are used where practical to minimise bias in data.
All new surveys and administrative databases incorporate relevant standards into
the planning and implementation phase. Existing surveys and administrative
databases are progressively updated to meet the standards at the time of their next
major revision or upgrade.
Statistics users and producers collaborate in setting national statistical standards.
Standards and classifications are documented carefully and in a form that can be
readily accessed and used.
Classifications must be systematic and should classify observations consistently,
using agreed criteria. Classification groups must be unambiguous, exhaustive and
mutually exclusive.
5 Accessibility Tier 1 statistics producers will ensure equality of access.
Statistics are presented in a clear and understandable manner and are widely
disseminated.
Release of Tier 1 statistics is by the chief executive of the producing agency,
notified more than 6 months in advance. The timing of a release is not influenced
by its content or set to create an advantage to any particular group or individual.
Because of potential for financial, political or other gain, strict security is
maintained during preparation of, and prior to, the release of key results.
As much detail as is reliable and practicable is made available, subject to legal and
confidentiality constraints. This includes information about the quality of the data
and other relevant metadata.
Statistics intended for the broader public are easy to read and do not mislead.
Statistical commentary, tables and graphs intended for general use are compiled
with a view to their general interest value, impartiality and cost-effectiveness.
Official statistics producers listen to and respond openly to all enquiries and make
records open to scrutiny on request (subject to constraints).
6 Ocean Climate Change Indicators Ministry for Primary IndustriesTable 1 (continued). Principles for producers of Tier 1 statistics (based on Statistics NZ, 2007).
6 Efficiency Surveys and processing systems are to the greatest possible extent designed with
sufficient flexibility to accommodate changes in user needs.
Appropriate opportunities to reduce costs are actively sought. These include:
economies of scale; data integration; methodologies and systems developments that
use generic, automated processes; better exploitation of existing surveys; shared use
of data, particularly administrative data; improved survey methods; use of sampling
techniques.
7 Protecting Privacy refers to the ability of a person to control the availability of information
respondent about themselves. Confidentiality refers to the protection of individuals’ and
information organisations’ information. Security refers to how the publishing agency stores and
controls access to the data it holds.
Legislative and ethical obligations governing the collection of data, confidentiality,
privacy and release are rigorously followed.
Data provided by respondents is only used for statistical purposes.
Respondents are informed of the main intended uses and access limitations
applying to the information they provide.
Respondent’s anonymity is always strictly preserved unless there is explicit
agreement to the contrary. Access to micro-data is subject to strict confidentiality
agreements.
Everyone involved in the production of official statistics is aware of their obligation
to protect provider confidentiality. Access to identifiable unit records of
information supplied by respondents is restricted to appropriate staff.
Unless legal permission is provided to allow identification of information in data
collected for administrative purposes, the same confidentiality and privacy
standards will apply to statistics derived from administrative sources as apply to
data collected for statistical purposes.
8 Minimising The need to collect data is assessed. Existing data sources, including administrative
respondent data, are assessed before undertaking new collections.
load The ‘best-supplier’ principle is applied i.e., collect data from the most appropriate
source after considering respondent load.
To enable respondents to understand their obligations to supply information, the
need for the survey is clearly presented to them.
A continuous effort is made to develop techniques that reduce the burden on
information providers.
All new or substantially revised surveys with a sample size of more than 2,500 are
managed through the Government Statistician.
Summary respondent-load information for Statistics NZ’s surveys is included in the
department’s annual report to Parliament.
9 Maximising Data are treated as an enduring national resource, with their value increasing
existing data through widespread and long-term use. Statistical systems are designed to
sources maximise the potential to add value through data integration and comparison.
Active data integration projects are publicly notified via government agency
websites and annual reports.
Data integration projects comply with the Privacy Act and the regulations and
policies that govern the data-supplying agencies.
Statistical coordination is enhanced through various forums, including the Advisory
Committee on Official Statistics (ACOS), the Official Statistics System Committee,
and involvement with professional statistical associations.
Statistical material likely to be of historical interest is archived, subject to security,
confidentiality and statutory obligations.
Unit record datasets for all Tier 1 surveys, and Statistics NZ’s holdings of Tier 1
administrative datasets and integrated statistical datasets, (including historical data
and metadata) are deposited with the Data Archive for research and historical
purposes.
Ministry for Primary Industries Ocean Climate Change indicators 7Table 1 (continued). Principles for producers of Tier 1 statistics (based on Statistics NZ, 2007).
10 International Bilateral and multilateral cooperation contributes to the improvement of official
participation statistics systems in all countries.
International concepts, classifications and methods are used wherever possible to
make meaningful comparison of data between countries.
Opportunities to share statistical knowledge and build relationships with other
professional statisticians are facilitated through international
conferences/workshops, secondments and provision of technical assistance.
Obligations to supply statistical data to international agencies are met.
8 Ocean Climate Change Indicators Ministry for Primary IndustriesTable 2: Protocols for producers of Tier 1 statistics (based on Statistics NZ, 2007). Grey shaded cells indicate protocols
of lower relevance to environmental Tier 1 statistics.
Protocol Element Element title Comment
1. Quality (Q) Q1 Professionalism
Q2 Good management practice
Q3 Continuous improvement
Q4 Relevance
Q5 Accuracy
Q6 Timeliness Fixed periodical updates
Q7 Consistency
Q8 Interpretability Causality not necessarily required
2. Frameworks, FSC1 Common frameworks
standards and FSC 2 Standard practice
classifications FSC 3 National/international comparability
(FSC) FSC 4 Promoting common standards
3. Respondent RM1 Respondent load These protocols were written to
management RM2 Collection value apply to surveys of respondents,
(RM) RM3 Using administrative data which are not generally the main
RM4 Data sources sources of environmental data.
RM5 Reducing load
RM6 Data collection methods
RM7 Effective communication
RM8 Participation by Maori
4. Confidentiality CPS1 Legal and ethical obligations
privacy and CPS2 Awareness of obligations
security (CPS) CPS3 Use for statistical purposes
CPS4 Managing privacy concerns
CPS5 Preserving confidentiality
CPS6 Security
CPS7 Administrative data
5. Release RP1 Accessibility
practices (RP) RP2 Presentation and dissemination
RP3 Release of Tier statistics
RP4 Pre-release security
RP5 Unbiased reporting
RP6 Unambiguous presentation
RP7 Errors in published data
RP8 Revisions
6. Management, MDP1 Data retention policy
documentation MDP2 Data custodians
and preservation MDP3 Contextual documentation
of statistical MDP4 Protection of statistical resources
records (MDP) MDP5 Historic preservation
2.3.4 Key criteria for indicators within Tier 1 statistic
The principal aim of Ocean Tier 1 indicators is to provide information on the extent to which the marine
environment is changing, where change includes trends, cycles and shorter-term variability. The value
of these indicators is not necessarily dependent on the establishment of causality, i.e. quantifying change
in the marine environment is valuable irrespective of whether the reason for the change is known
(European Environment Agency, 2003; Cury & Christensen, 2005). Furthermore, the Ocean Tier 1
statistic is not linked to specific management actions. If any changes are observed in the descriptive or
Ministry for Primary Industries Ocean Climate Change indicators 9headline indicators, more specific indictors and analysis would generally be needed to infer causality
and determine what the appropriate management action should be (Rice 2000; Link 2005; Rice &
Rivard 2007).
Public policy indicators are generally required to be interpretable in terms of informing us if ‘things are
getting better’ or ‘things are getting worse’ (Patterson, 2002). This requirement would imply some
reference point or benchmarking system, such as policy targets, comparisons with other countries,
environmental standards, and departures from a base year. For the Ocean Tier 1 statistic under
development, this is not necessarily the case. Measuring and reporting change in the marine
environment is valid even if we cannot say whether the change is “good” or “bad”. In some cases (e.g.
sea level rise, increasing ocean acidity, warming ocean), people may agree the change is “bad” (for
them personally or for the environment or society in general) but for other indicator changes (e.g.
change in ocean circulation, changes in primary productivity) it may be harder to agree on the
desirability of the change.
A number of previous studies (e.g. Opschoor & Reijnders, 1991; Gallopín, 1997; Patterson, 2002) have
identified the desirable characteristics of useful public policy indicators. Based on these, Statistics NZ
(2007, Table 1) and discussions at the Tier 1 Statistics workshop on 11 March 2014, the key selection
criteria for indicators that will form part of the Ocean Tier 1 statistic are:
1. Importance: including interest, relevance and whether the information can be understood
by decision-makers or the public (“comprehensibility”);
2. Quality; and
3. Longevity.
Importance is decided by whether a statistic meets one or more of the following criteria:
• The statistic satisfies broad public interest in the state of the environment.
• The statistic provides information that is useful for informing significant private and business
decisions.
• The statistics are of high value in informing debate and decisions on issues of national
importance and monitoring the outcomes of those decisions.
• The statistics are required for administration of legislation, operating important government
funding and allocation models, or meeting government’s international commitments.
These needs could include identifying potential environmental risk factors so that businesses, local and
central government and the public can be better prepared, whether it be for private or government
decision-making; for example, conservation measures, placement of MPAs, or flood risks. The ongoing
importance or relevance of the Tier 1 list is managed through the scheduled five-yearly review.
Quality requires that the statistic meets the following criteria:
• The statistic satisfies public expectations of authoritative and trustworthy information about
their country.
• Information can be relied on as part of significant private and business decisions.
• The information is of appropriate quality for informing debate, decisions and monitoring of
issues of national importance.
• Statistics are underpinned by a credible measurement framework and statistical analysis
procedure. The statistics follow best international scientific and statistical practice, and are of
comparable quality with similar data elsewhere in the world.
This is especially important for environmental statistics because our knowledge of natural systems is
known to be imperfect, but the issue is whether the knowledge is “fit for purpose” (Statistics NZ, 2010).
The quality of Tier 1 statistics is managed through the application of the Principles and Protocols for
Producers of Tier 1 Statistics.
Longevity requires that it is reasonably expected that the statistic will continue to be collected for the
medium term (next 5–20 years). The New Zealand government indicated the importance of being able
10 Ocean Climate Change Indicators Ministry for Primary Industriesto backdate selected indicators several years in order to establish trends (Patterson, 2002). The selected
indicators should be suitable for long-term, repeated measurements. Care is needed to ensure that
whatever variables are selected, there is a consistent historical time-series and a good prospect that these
time-series will be maintained into the future. There should be an expectation that this will be the case
even though longevity of data collection may not be able to be guaranteed because of changing priorities
for research funding in New Zealand and overseas. The importance of maintaining time-series of
environmental indicators is likely to be part of the 5-yearly review of Tier 1 indicators.
Presentation: Although not part of the selection criteria, the presentation of the Tier 1 Statistic is
crucial. This includes presenting the information in an appropriate and accessible way. For example, if
there are strong spatial variations in the property of interest, a graphical image, map or animation of the
indicator may be easier for people to understand than showing a number of graphs. Also required are
two levels of information about the methods used to produce the Tier 1 statistics: (1) a technical, detailed
and comprehensive description of the methods, appropriate for peer review and to enable international
comparison; and (2) a non-technical description of the methodology. Finally, a section of non-technical
text is required. This should state why the statistic has been selected and what the statistic means.
Establishing why the change has happened (causality) and what management action may be required if
a change is observed is not required.
We also note that different users of indicators require different things (Patterson, 2002). Policy-makers
prefer data that are related to policy objectives, evaluation criteria, and target and threshold values;
information for policy makers should be condensed to a few “bits” (units of information) per message
(Braat, 1991). In contrast, the public is assumed to prefer unambiguous messages, free of redundancy,
in a single unit of information but potentially with a wider scope (Patterson, 2002). For example, “the
sea in the last year was warmer than normal” is a single unit of information, whereas “the sea last year
was warmer in the summer but colder in the winter” is two units of information. For Tier 1 indicators
with a wide prospective audience, some compromise in the focus and complexity would seem
inevitable. Also, the method of display (e.g. using maps or animations) may allow more information to
be conveyed without losing comprehensibility. Presenting data in map form may also allow different
groups of users to focus on different aspects of the information. For example, a map of the sea
temperature last year compared to average might allow one person to look at the overall change (across
the whole New Zealand ocean domain) and another person look at change just in a smaller area of
particular concern to them (e.g. where their aquaculture facility is located). If time-series data for a
particular area or application are required by a stakeholder, the indicator can act as a “signpost” to what
data are available and from where they may be sourced.
2.3.5 Funding for environmental Tier 1 statistics
Considering the funding for marine environmental monitoring is important because the cost of
providing indicators as part of a Tier 1 statistic is likely to be higher than the cost of using data for
scientific publications. This means that if environmental statistics are included in the Tier 1 statistic
reporting, this difference will need to be funded to ensure long-term viability of the statistics. In 2012,
Cabinet approved a new Tier 1 Statistics list, which includes some statistics that are not currently
funded. According to the Statistics NZ online resources2, the process for identifying funding sources
for Tier 1 statistics that cannot be covered by existing funding will be via the Government Statistician’s
annual purchase advice. The Government Statistician, in conjunction with the Official Statistics System
(OSS) Chief Executives Steering Group, provides annual OSS purchase advice to the Minister of
Finance. This purchase advice comments on all government’s statistical investments across the OSS to
ensure that spending is targeted toward priority areas (with Tier 1 statistics representing government’s
highest priority statistics). This advice does not alter Ministers' control of changes to investments
2
www.Statistics.govt.nz, accessed December 2014
Ministry for Primary Industries Ocean Climate Change indicators 11through the normal Budget decision-making; rather it supplements that decision-making and ensures
across-Government consideration of priorities for investment in statistics.
2.4 National Environmental Reporting
In addition to the national Tier 1 statistics described above, the New Zealand government has also set
about trying to improve environmental reporting across the country. The key elements of the
Environmental Reporting Bill (MfE, 2014b) introduced to Parliament in 20 February 20143 are to:
• establish an environmental reporting system that provides comprehensive information on five
environmental domains – air, climate and atmosphere, fresh water, marine and land, with
biodiversity and ecosystems as a theme across all domains;
• develop an environmental reporting framework to provide a coherent picture of New Zealand’s
environment, covering the state, changes in state, pressures and impacts for each domain;
• allow MfE and Statistics NZ to undertake regular environmental reporting, on a 3-yearly cycle;
and
• afford the opportunity for the Parliamentary Commissioner for the Environment to provide
expert commentary and independent opinion on the quality of the underlying data and
robustness of the analysis.
The National Environment Reporting framework will include three main types of information (MfE,
2014b):
• Pressure: Pressure indicators explain the human activities and natural factors that influence the
environment. These answer the ‘why?’ questions about the domain – why the domain is in the
condition it is in.
• State: State indicators describe the biophysical condition of the environment. These answer the
‘what?’ questions about the environment – what are the physical, chemical and biological
characteristics of that domain and how have they varied over time?
• Impact: Impact indicators explain what the state and changes in the state means by informing
the ‘so what?’ questions about the environment – what are the consequences of changes in the
state for New Zealand’s environment, economy and society?
One “environmental domain” (see Section 2.5) will be reported on every six months. Once every three
years, a synthesis of the five domains will be produced. The synthesis will have a focus on the overall
picture of the New Zealand environment, including interactions between each domain.
2.5 Environment domain plan
Statistics NZ, with MfE and the Department of Conservation (DOC), developed and published the
Environmental Domain Plan (EDP) which considered 10 topic areas and identified key enduring
questions relating to the environment for each of them (Statistics NZ et al., 2013):
1. atmosphere
2. climate change
3. coastal and marine environment
4. ecosystems and biodiversity
5. energy
6. freshwater
7. land
8. Māori environmental statistics
3
http://www.parliament.nz/en-nz/pb/legislation/bills/00DBHOH_BILL12994_1/environmental-reporting-bill
12 Ocean Climate Change Indicators Ministry for Primary Industries9. materials and waste
10. mineral resources.
Topic areas 2 and 3 (in bold) are directly relevant to the present project. The purpose of the EDP was
to develop a shared understanding of the strengths, gaps, overlaps, and deficiencies within New Zealand
environmental statistics. There were four steps to the EDP:
1. identify the enduring questions4 and the supplementary enduring questions5 for each topic
area;
2. compile a stocktake of official data currently available;
3. analyse the stocktake with respect to the questions; and
4. host and facilitate 10 topic area workshops to identify and prioritise initiatives to improve
environmental information.
Examination of the supplementary enduring questions showed that about 40% of the EDP initiatives
are aligned with an existing or proposed Tier 1 statistic (Statistics NZ et al., 2013).
2.5.1 Climate change topic area
Enduring questions
1. How is New Zealand's6 climate changing?
2. How are New Zealand’s greenhouse gas levels7 changing?
3. How are we adapting to the physical impact8 of climate change?
4. Which environments are most likely to be affected by climate change?
Supplementary enduring questions
A. Where and how are New Zealand’s climate and atmospheric composition changing?
B. Where and how are New Zealand’s anthropogenic greenhouse gas emissions, and removals,
changing?
C. What and where is the impact of climate change on Māori and Māori-owned assets?
D. Where and how are ecosystems, people, and New Zealand institutions most affected by changes
to climate and atmospheric composition, and how are they adapting?
E. What greenhouse gas mitigation technologies and practices are we adopting?
2.5.2 Coastal and marine environment topic area
Enduring question
1. How is the quality and use of our marine environment changing and what is the impact of
human activity, including resource use, on the marine environment?
Supplementary enduring questions
4
Enduring questions: ‘big picture’ questions – those you’d be likely still to be asking in 20 years.
5
Supplementary enduring questions: focus at a more detailed level within each topic.
6
Includes the Ross Dependency and the Chatham Islands.
7
Refers to emissions and sinks of climatically-active gases such as carbon dioxide.
8
Includes physical impact on sea temperature, sea-level, ocean currents, river flows, and winter snow cover.
Ministry for Primary Industries Ocean Climate Change indicators 13A. What are the spatial and temporal biophysical trends in the coastal and marine environment9
and how are these predicted to change in the future?
B. What is the current use of natural resources10 in the coastal and marine environment, what is
the intensity of this use, how is this use changing spatially and temporally, and how is it
predicted to change in the future?
C. What ecosystem services are currently provided by New Zealand's coastal and marine
environment and how are these predicted to change in the future?
D. What is the impact of human activity on the coastal and marine environment, including the
cumulative effects on its resilience, and how is this changing over time?
E. What is the current relationship between Māori and the coastal and marine environment, how
is this changing, and what is the impact of human activity, resource use, and climate change
on this relationship?
F. What is the conservation and environmental protection effort11 for the coastal and marine
environment?
2.5.3 Available data identified in the EDP
The EDP also identified how well official data informs supplementary enduring questions (Table 3) and
suggested the top-priority initiatives for addressing these information needs over the next five to eight
years (i.e. up to 2018 or 2021) (Table 4).
Table 3: How well official data informs supplementary enduring questions in the “Climate change” and
“Coastal and marine environment” domain plans (Statistics NZ et al., 2013).
Supplementary enduring question
A B C D E F
Climate High High Medium Medium Medium N/A
change
Coastal and Medium Low Low Low Low Low
marine
environment
9
“Coastal and marine environment” includes the areas usually covered by or containing sea water, including seas
and oceans, harbours, river estuaries, salt-water marshes and mangroves, and coasts and beaches – including
biological and physical elements such as water temperature, salinity, and the composition and spread of marine
species.
10
Natural resources include renewable and non-renewable resources in the coastal and marine environment such
as fish, mineral and gas reserves, and the resources supporting aquaculture.
11
Environmental protection effort includes remediating environmental damage, resource management,
expenditure, areas protected under regulation and legislation, damage avoidance, research, and minimising natural
hazards.
14 Ocean Climate Change Indicators Ministry for Primary IndustriesTable 4: Top-priority initiatives identified by the “Climate change” and “Coastal and marine environment”
topic area workshops (Statistics NZ et al., 2013).
Number Initiative name Complexity Helps inform
which
supplementary
enduring
question
Climate change
CC.A1.1 Gather information on national climate Moderate D
change adaptation responses
CC.i1.1 Assess the climate change impacts on Highly complex D
ecosystem services
CC.i1.2 Gather national infrastructure topography Moderate C, D
data – LIDAR for sea level change
projections
CC.A2.1 Develop a map of projected sea level rise Moderate C, D
around NZ’s coastline
CC.i1.3, Assess the impacts of climate change on Highly complex C
CC.i1.4 Māori
Coastal and marine environment
CM1 Identify baseline habitat state Highly complex A, B, D, E
CM2 Expand statistical governance over Highly complex All
coastal and marine data
CM3 Review existing datasets Moderate All
2.6 Other indicators and environmental reporting
2.6.1 Marine Environmental Monitoring Programme (MEMP)
The MPI Marine Environmental Monitoring Programme (MEMP) project (ZBD2010-42) began before
the EDP and Environmental Reporting Bill were underway in recognition that a key resource
management action for New Zealand would require the design, implementation and commitment to a
comprehensive long-term monitoring programme for our oceans, coasts and estuaries. The project was
initially a joint initiative between MPI and MfE. The first part of MEMP was to locate all existing and
past time-series of marine environmental data and place high level information about these data into an
online catalogue (Hewitt et al., 2014). This work has improved awareness and access to these datasets
and allowed them to be evaluated as to their fitness-for-purpose in the sense of providing reliable
information on environmental variability and change. Having identified and evaluated current datasets,
MEMP will contribute to the development of a monitoring programme that can encompass the existing
datasets and tie them into a more coherent nationwide network.
2.6.2 MPI deepwater ecosystem indicators
Internationally, reviews of ecosystem indicators have concluded that no single indicator addresses all
aspects of an ecosystem, and that a suite of indicators are required to monitor and summarise change in
ecosystems (Cury & Christensen, 2005; Rice & Rochet 2005). Such a suite of indicators should be
sensitive to change across the range of scales and processes. MPI projects ENV2006-04 and DEE2010-
05 produced recommendations on the development of environmental indicators for use in managing
New Zealand’s fisheries (Tuck et al. 2009; Tuck et al., 2014). Tuck et al. (2014) examined and identified
indicators across the following eight categories: (1) climate indices; (2) oceanographic indices; (3)
primary productivity indices; (4) food-web indicators; (5) fisheries and fisheries management
indicators; (6) indicators of the fish community (especially those from Tuck et al., 2009); (7) indicators
of benthic communities and habitats (sea-floor integrity); and (8) indicators of top predators, threatened
and endangered species.
Ministry for Primary Industries Ocean Climate Change indicators 153 OCEAN TIER 1 STATISTIC: RECOMMENDATIONS
3.1 Sea level
3.1.1 Scientific background
Knowledge on how mean sea-level (MSL) varies seasonally, annually and over periods of decades to
centuries is of high relevance to planning processes for coastal communities, local/central government,
infrastructure agencies, the insurance sector and the maritime sector. MSL serves as an anchor to
establishing appropriate elevations for coastal development and infrastructure design, and is the
reference point for monitoring or designing for extreme coastal water levels during hazard events e.g.,
storm-tide and wave overtopping and inundation, tsunami inundation, including exacerbation of these
types of events with projected sea-level rise due to climate change. With sea-level rise projections due
to climate change of up to 1 metre predicted by 2100 (and higher values cannot be entirely ruled out),
and associated coastal hazards, there will be increasing pressure on communities and infrastructure that
are currently less than several metres elevation above mean high water. This is important because, based
on the 2006 New Zealand Census, around 150 000 people reside in coastal plains no higher than 3 m
above mean high water.
Hence a robust measure of annual MSL and how it is tracking long-term with climate change is essential
to any form of coastal re-development, new “greenfields” developments or infrastructure projects.
Information on sea-level change would hence potentially have high economic relevance and be
important for central and local government. There is also likely to be high public interest in (and
understanding of) measures of sea-level change. Tracking sea-level nationally relative to ongoing and
previous global-average sea-level rise projections will also help inform what the more-likely range is
for projected sea-level change in New Zealand.
Sea-level has been measured from coastal tide gauges around New Zealand since the late 19th century,
primarily for maritime uses. Scientific studies of coastal and estuaries sea-level measurements started
with analysis of tides and how the tidal wave propagates around New Zealand. More latterly, there has
been a wide range of studies focusing on:
coastal hazards e.g., storm-tide inundation, perigean-spring (“king”) tides, wave run-up and
overtopping, seiching and tsunami inundation;
climate variability effects on sea-level, particularly the seasonal (annual) cycle, El Niño–
Southern Oscillation cycles (2–4 years), the longer 20–30 year Interdecadal Pacific Oscillation
(IPO) cycle and sea-level rise; and
future projections of mean sea-level, both globally and downscaled to the New Zealand region.
New Zealand has five sea-level gauge sites that are part of the Global Sea Level Observing System
(GLOSS) as listed in Table 5. GLOSS is an international research programme that aims to develop high
quality global and regional sea-level networks for application to climate, oceanographic and coastal
sea-level research. The programme became known as GLOSS as it provides data for deriving the 'Global
Level of the Sea Surface'. The main component of GLOSS is the 'Global Core Network' (GCN) of 290
sea-level stations around the world for long-term climate change and oceanographic sea-level
monitoring.
Table 5: New Zealand’s Global Sea Level Observing System (GLOSS) Core Network stations.
GLOSS ID Station
101 Wellington
127 Auckland
128 Waitangi (Chatham Island)
129 Bluff
134 Scott Base (Antarctica)
16 Ocean Climate Change Indicators Ministry for Primary IndustriesNew Zealand contributes sea-level data to the Permanent Service for Mean Sea Level (PSMSL)
database. PSMSL is the global data bank for long-term sea-level change information from tide gauges
and bottom pressure recorders. In terms of fulfilling New Zealand international commitments, while
there is no formal treaty or obligations on New Zealand to supply sea-level data to the PSMSL database,
there is a strong international expectation that New Zealand will do so given that New Zealand is one
of the few places in the Southern Pacific where sea-level has been and will continue to be measured
over long periods (decadally) with sufficient accuracy. This is also important in a global sense because
sea-level measurements in New Zealand allow the wider Pacific region to be represented in the global
dataset of sea-level change.
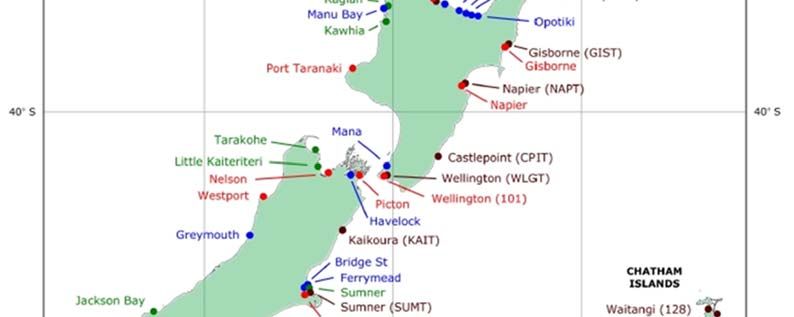
3.1.2 Base datasets12
At present, coastal/estuarine sea-levels (tides) are measured at nearly 70 gauge sites around New
Zealand including offshore islands and Antarctica (Figure 1). Sea-level data are measured for various
purposes supporting maritime activities, coastal inundation hazards, tsunami observations and
monitoring sea-level variability and trends. A variety of agencies are responsible for these sea-level
gauges, including Regional Councils, Port Authorities and research organisations, including New
Zealand universities. The lengths of historic records for most of these sites are quite short (e.g., most
would be no more than 10–15 years in length) apart from the Standard Ports (red sites in Figure 1), for
which Land Information New Zealand (LINZ) produce tide tables in the annual Nautical Almanac.
LINZ has a key role to play in the development of a MSL statistic, through:
(a) their funding and oversight of the GeoNet13 components associated with the tsunami sea-
level gauge and cGPS sensor networks;
(b) their role as custodian of sea-level data for New Zealand through the New Zealand
Hydrographic Authority, which is part of LINZ; and
(c) their role in setting local and national vertical MSL datum’s – which may require
adjustments as MSL changes.
12
“Base” datasets explain what actual measurements are available
13
GeoNet is the official source of geological hazard information for New Zealand. (http://www.geonet.org.nz/)
Ministry for Primary Industries Ocean Climate Change indicators 17Figure 1: Coastal, port and estuarine sea-level gauges in New Zealand in 2013. Major port sites (red), open coast sites
(green), tsunami monitoring sites (brown), and other sites (blue). [Source: National Report for New Zealand for GLOSS
(IOC) by Rowe & Bell (2013)]
3.1.3 Candidate indicators
Two sets of indicators could be produced:
Relative annual MSL for each location where sea-level is measured; and
New Zealand-wide average based on the annual MSL values from each coastal measurement
station.
Initially, only the first indicator is assessed as it can be made available quickly (within a year). The
second candidate indicator is likely to take a few years to make available. Important considerations
when defining an Ocean Tier 1 indicator for sea-level include: (1) which coastal measurement stations
to use; (2) whether to use absolute or relative (to the land) sea-level; and (3) the baseline period to which
the annual MSL is tied to in order to convert it into a meaningful anomaly or above a recognisable
datum.
18 Ocean Climate Change Indicators Ministry for Primary IndustriesYou can also read