SOLVING MARINE POLLUTION Successful models to reduce wastewater, agricultural runoff, and marine litter Olha Krushelnytska - World Bank Document
←
→
Page content transcription
If your browser does not render page correctly, please read the page content below

SOLVING
Public Disclosure Authorized

                               MARINE POLLUTION
                               Successful models to reduce wastewater,
Public Disclosure Authorized

                               agricultural runoff, and marine litter
                               Olha Krushelnytska
Public Disclosure Authorized
Public Disclosure Authorized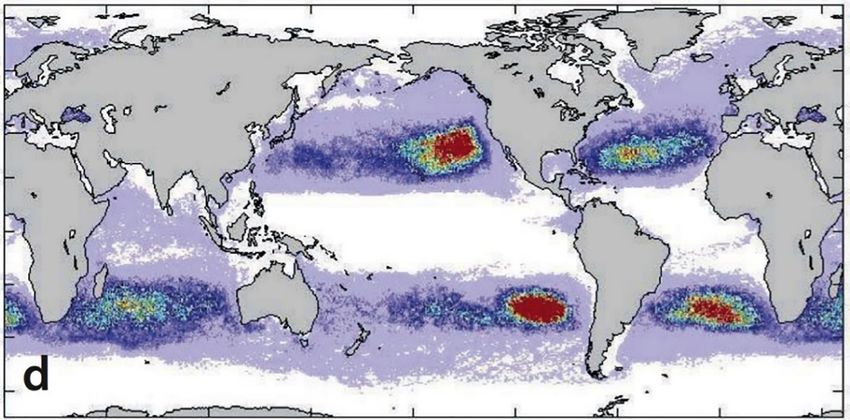
SOLVING MARINE POLLUTION
Successful models to reduce wastewater,
agricultural runoff, and marine litter
Olha Krushelnytska, September 2018

This report presents solution models for three types of marine pollution originating on land: wastewater, agricultural
runoff, and marine litter. It examines the status and impacts for each pollution type, and provides pollution management
case studies with cost-benefit analysis where available. The report provides a menu of pollution abatement options
to help countries and their development partners improve the health and productivity of coastal and ocean areas.

Annex 1 acknowledges contributors, and Annex 2 provides the legal and institutional context for this paper.

Status and Impacts
Wastewater

Wastewater, both treated and untreated, is widely                       On average, high-income countries treat about 70% of
recognized as a resource. As water demand is                            the wastewater they generate. This ratio drops to 38%
predicted to increase significantly over the coming                     in upper middle-income countries and to 28% in lower
decades, minimizing water loss, changing management                     middle-income countries. In low-income countries, only
approaches and enabling water reuse to become                           8% of industrial and municipal wastewater gets any kind
intrinsic part of long-term sustainable solutions. The                  of treatment (Sato et al. 2013) (see Figure 2). The use of
Food and Agriculture Organization of the United Nations                 treated wastewater varies. It goes primarily to industrial
(FAO) estimates annual global freshwater withdrawals                    and domestic sectors in the humid regions, such as
at 3,928 km3 (UN 2017). More than half of it is being                   the eastern part of North America, northern Europe,
released into the environment as wastewater (municipal                  and Japan. And in the arid and semiarid areas, such as
and industrial effluent and agricultural drainage), and                 western North America, Australia, and southern Europe,
less than half is being consumed, mainly by agriculture                 treated wastewater is used primarily for irrigation, which is
through evaporation in irrigated cropland (see Figure 1).               predicted to expand due to the climate change-induced
Over 80% of wastewater released to the environment is                   changes (Sato et al. 2013).
not adequately treated.

Figure 1. Freshwater consumption and wastewater production by major sectors (circa 2010)

                                16%             Industrial wastewater
38%                              3%             Industrial water consumption
                                 8%             Municipal wastewater
                                 3%             Municipal water consumption
                                                Agricultural drainage
                               32%              Agricultural water consumption

Source: Based on data from AQUASTAT (n.d.a.); Mateo-Sagasta et al. (2015); and Shiklomanov (1999). Contributed by Sara Marjani Zadeh
(FAO).

1   | Solving Marine Pollution
Figure 2. Ratio of treated wastewater to total wastewater

 Treated wastewater percentage
        < 20
        21 - 40
        41 - 60
        61 - 80
        > 80
        No data available

Map prepared by the Global Partnership for Oceans (GPO) Technical Secretariat; adapted from Sato et al. 2013.

Environmental and health impacts from insufficient                        and arsenic - have acute and chronic toxic effects on
wastewater treatment depend on the type of pollutants:                    species, accumulating and increasing in concentration
                                                                          along the food chain
• Decaying organic matter and debris - use up the                       • Bacteria, viruses, and disease-causing pathogens -
  dissolved oxygen so fish and other aquatic biota                        pollute beaches and contaminate shellfish populations
  cannot survive                                                        • Other substances, such as some pharmaceutical
• Excessive nutrients, such as phosphorus and nitrogen                    and personal care products, primarily entering the
  (including ammonia) - result in eutrophication, or                      environment in wastewater effluents - pose threats to
  overfertilization of receiving waters (freshwater or                    human health, aquatic life, and wildlife.
  marine), which can be toxic to aquatic organisms,
  promote excessive algae blooms, reduce available                      The economic impact of wastewater pollution is
  oxygen, harm spawning grounds, alter habitat (e.g.                    difficult to value. One way to do so is to establish its
  corals can be overgrown by seaweed if exposed to                      impact on ecosystem services and to determine the cost
  excesses nutrients), and lead to a decline in certain                 of replicating those services. The U.S. Environmental
  species                                                               Protection Agency (EPA) and the Centers for Disease
• Chlorine compounds and inorganic chloramines - toxic                  Control and Prevention estimated the hidden cost of
  to aquatic invertebrates, algae, and fish                             unreliable water delivery and wastewater treatment to
• Metals, such as mercury, lead, cadmium, chromium,                     surpass $2 trillion by 2040 in USA alone (Table 1).

                                                                                                           Solving Marine Pollution |   2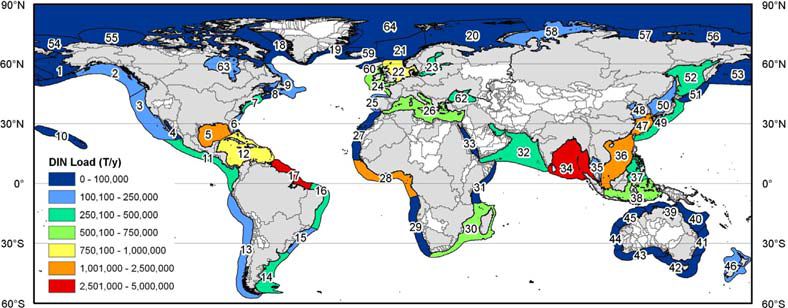
Table 1. Estimated costs due to unreliable water and wastewater infrastructure

              Sector                      Cumulative cost, 2011-2040 (billion 2010 USD)
            Households                                        $616
            Businesses                                       $1,634
              Total                                         $2,250
Sources: EPA

Agricultural Runoff
Agricultural activities are considered a primary                               The level of land-based Dissolved Inorganic Nitrogen
contributor to an increase in pollutant delivery to                            (DIN) export from watersheds to large marine ecosystems
marine ecosystems. Industrialized agriculture is one of                        (LMEs) varies globally across a large range of magnitudes
the largest sources of nitrogen (N) and phosphorus (P)                         (Lee et al. 2016). Fertilizer was the primary source of DIN
pollution in the form of animal manure, inefficient nutrient                   to LMEs in most of Europe and Asia, while manure was
application, bad irrigation practices, and soil erosion.                       the primary source in most of Central and South America.
The use of N-based fertilizers is predicted to double or                       The smallest loads are exported to many polar and
even triple within the next 50 years (Beman et al. 2005).                      Australian LMEs, while the largest loads are exported
Though agricultural runoff is highest among developed                          to northern tropical and subtropical LMEs. The LMEs
countries, marine nitrogen pollution is increasingly                           receiving the largest loads of land-based DIN are the
widespread because of agriculture intensification                              North Brazil Shelf, Bay of Bengal, Guinea Current, South
globally.                                                                      China Sea, East China Sea and Gulf of Mexico LMEs.

Figure 3. DIN load to LMEs. Watersheds discharging to LMEs are grey, watershed with zero coastal discharge are white

 90oN                                                                                                                               90oN

 60oN                                                                                                                               60oN

 30oN                                                                                                                               30oN

             DIN Load (T/y)

    0   o          0 - 100,000                                                                                                      0o
                   100,100 - 250,000
                   250,100 - 500,000
                   500,100 - 750,000
    o
 30 S                                                                                                                               30oS
                   750,100 - 1,000,000
                   1,001,100 -2,500,000
                   2,501,000 -5,000,000
 60oS                                                                                                                               60oS

Source: Lee etal. 2016

3       | Solving Marine Pollution
Nutrient use efficiency is a key indicator of nutrient N and P compounds to water (Sutton et al. 2013).
management. Oversupply or imbalance between
nutrients reduces the efficiency of nutrient use, while Analysis of the consumption of N-based and P-based
insufficient application of nutrients leads to depletion of fertilizers consistently show high concentration of given
organic matter, reducing soil quality and exacerbating chemicals in air, water, and soil in Latin America, Western
land degradation through erosion. The efficiency of Europe, the Middle East, and South-East Asia. In Africa,
nutrient use is very low on a global scale: over 80% of Latin America, and parts of Asia, there are still many
nitrogen (N) and 25–75% of phosphorus (P) consumed regions with too few nutrients (Figure 4). In considering
(and not temporarily stored in agricultural soils) are regional differences, it is clear there is a common need
lost to the environment. This wastes the energy used to improve nutrient use efficiency ‘to produce more food
to prepare the fertilizers and causes pollution through and energy with less pollution’. See Annex 3 for a quick
emissions of the greenhouse gases nitrous oxide (N2O) overview of the key issues and differences between
and ammonia (NH3) to the atmosphere. It also results in regions.
losses of nitrate (NO3-), phosphate (PO43), and organic
Figure 4. Fertilizer use and nitrogen losses to the environment
a. Estimated and projected use of fertilizers that contain nitrogen, phosphorus, and potassium compounds
b. Total estimated losses to the environment (air, water, and soil1 ) of nitrogen oxides (NOx) in emissions from combustion sources
and of reactive nitrogen (Nr) from agricultural activities for 2000 and 2050
a
1962
300
2006
2050
Annual fertilizer use (kg per ha)
250
200
150
100
50
0
Sub-Saharan Latin Near East / South Asia East Asia Developed World
Africa America North Africa Countries
b
70
NO� from combustion (2000)
Annual nitrogen losses (million tonnes)
60 Nr from agriculture (2000)
50 NO� from combustion (2050)
Nr from agriculture (2050)
40
30
20
10
0
Sub-Saharan Latin Near East / South Asia East Asia Developed
Africa America North Africa Countries
Source: Sutton et al. 2013.
1 Losses are represented mainly by ammonia (NH3) emissions from agricultural and livestock production systems, soil denitrification, and N leaching and runoff
Solving Marine Pollution | 4Livestock manure is one of the major contributors to • Ecosystems and biodiversity, including the loss of
nutrient pollution. The European Nitrogen Assessment species of high conservation value naturally adapted
estimated that 85% of nitrogen in EU harvest was used to to few nutrients; eutrophication from atmospheric N
feed livestock, while the average EU citizen consumed deposition is an insidious pressure that threatens the
70% more protein than needed for a healthy diet (Sato biodiversity of many “protected” natural ecosystems
et al. 2013). • Soil quality2, including overfertilization and too
much atmospheric N deposition acidify natural and
China is among the world’s largest producers and agricultural soils, while a shortage of N and P nutrients
consumers of beef, mutton and dairy, which generate leads to soil degradation, which can be exacerbated
large amounts of livestock manure. China also does by a shortage of micronutrients, leading to loss of
not have systematic nutrient management planning; fertility and erosion.
most manure generated by large operations is not
used as fertilizer, but instead is treated or released In addition, poorly-managed irrigation has one of the
without treatment. In comparison, the United States has worst impacts on water quality. It causes salt concentration
a zero-discharge system - for example, all manure and and erosion; transports nutrients, pesticides, and heavy
wastewater are applied to cropland, with essentially no metals downstream; and decreases the amount of water
manure nutrients or pathogens going directly to surface that flows naturally in streams and rivers.
waters. While treating manure is expensive, its use as
fertilizer can significantly benefit soil quality. If applied Economic cost of agricultural runoff is difficult to
properly, it can result in zero nutrient emissions into calculate, but it far outweighs the benefits of nitrogen
surrounding freshwater systems. application. Pollution from pesticides and fertilizers is
hard to measure and the source is often diffuse, making
Aquaculture is also a substantial contributor to nutrient it hard to determine. In 27 countries in the EU, the cost-
pollution through the release of excess nutrients into benefit analysis (Van Grinsven et al. 2013) in 2008
nearby water supplies. Due to overfeeding and less showed the annual benefit of nitrogen application of
than optimal feed regulation systems, and high organism €20-€80 billion/year with a cost of €35-230 billion/year.
density in the fish ponds, high levels of nitrate and In China and India, the cost of agricultural pollution is set
phosphate nutrients are created that can leak out into to rise as farmers race to increase food production, with
watersheds and begin the process of eutrophication. some regions probably already passing the pollution
However, not all aquaculture practices result in nutrient level that may cause significant health issues (OECD
runoff - mollusk farms and some seaweed farms can 2012). Loss of N-P-K from an average erosion of 20 tons
remove excess nutrients from a watershed and thus help per hectare per year represents an annual economic
prevent eutrophication. loss of $242 million in nutrients, as nutrient loss is
closely associated with rainfall-runoff events, and the
Environmental and health impacts from agricultural economics of nutrient control tend to be closely tied
runoff, particularly nitrogen pollution, stem from too to the costs of controlling runoff and erosion. The link
much or too little use of nutrients, highlighting the between erosion, increasing fertilizer application, and
complexity of nutrient interactions (Sutton et al. 2013): loss of soil productivity is very direct in many countries.
• Water quality, including coastal and freshwater dead
zones, hypoxia, fish kills, harmful algal blooms, nitrate-
contaminated aquifers, and impure drinking water,
resulting from both N and P eutrophication
2 One of the main factors contributing to decreasing soil quality is the lack of humus, organic matter and clay. Healthy soils with adequate levels of humus and
organic matter will have a higher retention capacity of N (so that leaching is minimized) and P
5 | Solving Marine PollutionMarine Litter
Marine litter is one of the most insidious forms of Pacific, North Atlantic, South Pacific, South Atlantic, and
ocean pollution, with most of it originating on land and Indian Ocean (Figure 5). Though the location of the gyres
about 80% of it being plastics. Packaging is plastics’ has been known for many years, quantification of the
largest use, representing 26% of the total volume (WEF, plastic problem - by number of pieces and weight - is an
MacArthur, McKinsey 2016). Plastics drifting in the ocean ongoing modelling effort.
are highly concentrated in five subtropical gyres: North
Figure 5. Simulation of evolution of drifter density (or marine debris) by 2018 after 10 years of advection by currents, as
determined from real drifter movements
80
60
40
20
0
-20
-40
-60
0 50 100 150 200 250 300 350 400
0.01 2 4 6 8 10
Note: Units represent relative change in drifter concentration. Source: IPRC Climate 2008.
Box 1 - Major sources of marine litter
Land-based • Fishing industry activities
• Ship-breaking yards
• Wastes from dumpsites on the coast • Natural storm-related events
or river banks
• Rivers and floodwaters Sea-based
• Industrial outfalls
• Discharge from stormwater drains • Shipping and fishing activities
• Untreated municipal sewerage • Offshore mining and extraction
• Littering of beaches and coastal • Legal and illegal dumping at sea
recreation areas • Abandoned, lost, discarded fishing
• Tourism and recreational use of the gear
coasts • Natural disasters
Solving Marine Pollution | 6Recent estimate of the amount of plastics drifting at and economic status to determine which countries
sea showed more than 5 trillion plastic particles, where contribute the greatest mass of plastic marine debris
smallest size is the most numerous (Eriksen et al. 2014). (Figure 6). It also pointed to the critical importance of the
This includes only the plastic floating on the surface. The waste management infrastructure improvements.
data collected for four size classes - small micro, large
micro, meso, and macro - in all five subtropical gyres and Recent studies looking at plastic pathways indicate
extensive coastal regions and enclosed seas, showed that 10 rivers basins are responsible for 90% of land-
that the two smallest microplastic size classes combined based leakages to the ocean (Lebreton et al., 2017,
account for over 90% of the global particle count, while and Schmidt et al., 2017). Both studies from Schmidt
macroplastics account for around 90% of the plastic and Lebreton show the Yangtze river basin as the main
pollution weight. contributor (Figure 7). The ranks for other polluted rivers
differ due to the entry data used in two studies: Lebreton
The study of marine litter sources estimates 275 used the global river plastics input model for estimation
million metric tons (MT) of plastic waste generated in whereas Schmidt’s made calculations as a product of
192 coastal countries in 2010, with 4.8-12.7 million MT mismanaged plastic waste generated per capita and
entering the ocean (Jambeck et al. 2015). The study population size in the catchment.
linked worldwide data on solid waste, population density,
Plastic waste produced and mismanaged
Figure 6. Plastic waste produced and mismanaged
Norway
Canada Denmark Sweden
United Finland Russian
EU 27 plus Kingdom Federation
Norway Netherlands
Germany
Ireland Poland
Belgium Ukraine North
France Croatia Korea
United States Italy Turkey Japan
Spain
Greece Syria Iran South
Portugal China
Cyprus Lebanon Korea
Tunisia Pakistan
Morocco Israel India Hong
Kuwait Taiwan
Mexico Cuba UAE Kong
Haiti Dominican Republic Algeria Libya
Puerto Rico Egypt Saudi Arabia Bangladesh
Guatemala Honduras
Trinidad Oman Myanmar Vietnam
El Salvador Nicaragua Nigeria Yemen Philippines
and Tobago Senegal
Venezuela Ghana Thailand
Costa Rica
Panama Guyana Malaysia
Colombia Somalia Sri Lanka
Cote d'Ivoire Singapore
Ecuador
Indonesia Papua New Guinea
Peru Brazil Angola
Mauritius
Chile Australia
Uruguay South Africa
Argentina
Coastal population Plastic waste production
Million people Thousand tonnes per day, 2010 New Zealand
Less than 1
1 to 2 37 Total plastic waste
2 to 10 produced
10
10 to 50 Source: Jambeck, J., R., et al., Plastic waste inputs from land
50 to 263 1 into the ocean, Science, 2015; Neumann B., et. al., Future
0,2 Portion of plastic Coastal Population Growth and Exposure to Sea-Level Rise and
Land locked country waste mismanaged Coastal Flooding - A Global Assessment. PLoS ONE, 2015.
Source: Jambeck et al. 2015.
7 | Solving Marine PollutionFigure 7. Top 10 river contributing to marine litter
Estimates by Lebreton et al, 2017 Estimates by Schmidt et al, 2017
Solo Mekong
Irrawady Niger
Pasig Amur
Amazon Zhujiang
Brantas Ganges, Brahmaputra
Cross Nile
Huangpu Hai He
Xi Huang He
Ganges Indus
Yangtze Yangtze
0 100 200 300 0 4,000 8,000 12,000 16,000
Mismanaged plastic waste, 1000 tons/year Mismanaged plastic waste, 1000 tons/year
The level of contribution to plastic marine litter by a The health impact of plastic pollution is a potential
country or locality depends on the number of factors disruption of key physiological processes, such as
(ORA 2010): cell division and immunity. This is caused by most of
the priority pollutants that are present in plastic debris.
• Geography: location of city and hydrology related to Some are ingredients of plastic are absorbed from the
rivers, type of development, relative proximity of key environment like ocean, where litter bonds with other
polluters, topography, and water flow synthetic polymers and gets accumulated in marine
• Environment: presence and location of native species, later appearing in our food. Some of these
vegetative filter strips, shape of receiving water body, polymers are carcinogens, like polychlorinated biphenyls
flow rate of receiving body, and rainfall patterns (PCBs) and dichlorodiphenyltrichloroethane (DDT)3
• Infrastructure: type of stormwater collection system (Rochman et al. 2013a). Micro-plastics are particularly
and the location of dams problematic because of their long residence times in
• Institutional capacity: efficiency of waste collection the ocean and their ingestion by marine organisms
and street cleaning services, extent of legislation and and birds (NOAA Marine Debris Program 2015; World
enforcement prohibiting littering, availability of proper Ocean Review 2010), resulting in increased morbidity
waste treatment and disposal facilities, and presence and mortality of marine life and infiltration of food
and type of industry webs. Attention should be given to abandoned, lost,
• Demographics: culture and degree of environmental or discarded fishing gear, which can continue to catch
concern, leading to proper use of waste disposal bins; and kill marine life for decades, known as “ghost fishing”.
and population density Roughly 70% (by weight) of macroplastics floating in the
• Economy: income level and waste composition, open ocean are fishing-related, though this also has to
with low-income communities generating larger do with the various densities of types of plastic (Eriksen
percentages of organic wastes versus high-income et al. 2014).
communities that generate larger percentages of
inorganic wastes such as plastics.
3 Pesticides and organic pollutants such as PCBs are consistently found on plastic waste at harmful concentrations 100 times those found in sediments and 1
million times those occurring in seawater. PCBs and DDT bioaccumulate and biomagnify, with a recent EPA-funded study showing severe glycogen depletion,
fatty vacuolation, cellular necrosis, and lesions in fish exposed to a mix of chemicals via plastic ingestion.
Solving Marine Pollution | 8The economic cost of marine litter is most researched in the tourism sector. The estimated annual lost tourism revenues in 2011 in Asia-Pacific region were 0.3% of gross domestic product, or $622 million (Jang et al. 2014), and $29-37 million in Geoje Island in South Korea. The coastal cleanup efforts can be costly, too: recent estimates by the West Coast Governor’s Alliance (California, Oregon, and Washington, with over 50 million people) have placed annual cleanup efforts of marine litter and mitigation along the U.S. West Coast at over $520 million. Indirect costs are less known; however, tourism and fishing industries are affected by opportunity costs related to the degradation of the marine environment and forgone trips to impaired beaches. In South Africa, a survey of visitors in 2000 indicated that the degree of beach pollution could result in a loss of 52% of revenue from tourism. Marine litter has a twofold impact on fisheries: by decreasing revenues through ghost-fishing and by increasing costs due to vessels repairs. Research focusing on the Shetland fishing fleet found that marine litter could cost a vessel up to £30,000 a year (Hall 2000). 9 | Solving Marine Pollution
Solutions
Wastewater

Wastewater can be reused to generate different                    One of the legal incentives for wastewater treatment
benefits, using different levels of treatment and its cost.       is the transfer of freshwater entitlements from farmers
In regions with water scarcity, investments in reclaimed          to municipalities, allowing wastewater to be used by
water reuse and water exchange arrangements are                   farmers in agriculture while freeing freshwater for
usually profitable in the long term. Treated wastewater           municipal uses. The farmers save the cost of water
is used in agriculture for irrigation, in industrial activities   pumping and fertilizing, and increase harvest yields
(which account for more than one-fifth of all water               and incomes. The transfer of freshwater entitlements
used), and in urban activities such as irrigation of parks,       depends on the farmers having secure rights to the
landscaping, and street cleaning. Another use if an               water that they can transfer - either in water markets
artificial groundwater recharge with treated wastewater.          (see example in the Solution Examples subsection) or
This does not only conserves groundwater resources,               in return for compensation. This makes legal rights and
but helps retard eutrophication of surface waters                 compensation for wastewater use central to the water
through physical and biological processes in the soil that        exchange solution, where the national legal system must
improve water quality. The recharge operations are not            permit transfer of these rights.
yet done on the large scale due to the lack of specific
criteria and guidelines governing the artificial recharge         One of the financial solutions is to recover the
of groundwater with recycled municipal wastewater.                operational costs of the wastewater treatment from
                                                                  the final beneficiaries. This will make wastewater
Treated wastewater is still not used very frequently              treatment process self-sustaining and efficient in the
as drinking water, except for space missions, the                 long run. In irrigation, the economic drivers for the use
Concordia Station in the Antarctic, and in some military          of reclaimed water are unclear: the pricing mechanisms
operations, and to a lesser extent by few countries that          are not transparent(Radcliffe 2003), with the high cost
suffer from water shortages. Several cities produce               of distribution, lack of awareness of end users, and
drinking water from their wastewater on a large scale:            the inefficiencies of sewage collection and treatment
Windhoek (Namibia), Singapore, and Orange County                  operations adding to the problem.
district in California (USA), with works underway in Lima
(Peru) and Kampala (Uganda).                                      Another financial incentive for wastewater treatment
                                                                  it a biogas capture from the treatment process. While
When it comes to water purification, both the “grey”              most sewage treatment facilities still simply flare the gas,
and the “green” treatment infrastructures can be used.            technologies in developed countries usually include
The “grey” or conventional infrastructure is often ageing,        biogas capture, providing a variety of benefits. Many
inappropriate or insufficient, thus creating opportunities        plants in the United States have offset capital costs
for “green”, or natural-based solutions (NBS) for water. NBS      completely through income and savings from using
embed perspectives of ecosystem services, enhanced                the captured biogas to generate heat and electricity.
resilience and livelihood considerations, usually offer           During a biogas and energy efficiency project, a sewage
multiple water-related benefits, and often help address           treatment plant in Washington State captured methane
water quantity, quality and risks simultaneously (UNESCO          gas from the treatment process and recycled it as fuel to
2018). When it comes to water purification, the water             run equipment at the plant, saving more than $228,000
treatment plant is the grey infrastructure solution, while        yearly in utility costs. And the largest wastewater treatment
re/afforestation, riparian buffers and wetlands restoration       facility, DC Water’s Blue Plains Advanced Wastewater
are green infrastructure solutions. See Annex 4 for more          Treatment Plant, extracts and reuses useful products like
examples of water NBS that could be used as alternatives          biosolids (recycling nitrogen and phosphorous back into
or in combination with the conventional water treatment           local soils) and energy (generating about 10 megawatts
systems.                                                          of electricity that is consumed by the plant).

                                                                                                  Solving Marine Pollution | 10
Some economic solutions are selective sales taxes
Colombia and India: Cost recovery through tariffs and
on “polluting items” such as agricultural chemicals or
differential sewage pricing
fuels, or a pay-as-you-pollute plan. The pay-as-you-
pollute method proved to be effective in Colombia,
where companies had to pay for each unit of pollution In Hyderabad, India, wastewater treatment cost recovery
(Blackman 2010). To make such a plan effective, however, is restricted to water supply, and the Hyderabad
the government must devote resources to collect data Metropolitan Water Supply & Sewerage Board has not
on nutrient runoff and fees from the companies. yet been successful in full cost recovery. During one
of the studies, only 30% of respondents were willing to
pay for wastewater to be treated to potable quality. This
Solution Examples indicates that the full cost recovery of sewerage services
and wastewater treatment is not possible. However,
Thailand hotels: Attractive loans for green a phased increase in the water tariffs accompanied
investments by simultaneous improvements in service delivery
mechanisms may be successful in the future. Also, like
water supply charges, the sewerage fees could be
World Wildlife Fund (WWF) Conservation Finance and
levied according to consumer income levels. Such a
its partners designed a $40 million subsidized credit
system exists in parts of Colombia, where urban areas
facility to reduce biodiversity impacts of hotels operating
are divided into zones based on socioeconomic criteria
on the Thai coastline. This credit facility was launched
and water rates are adjusted according to the zone
by Kasikorn Bank, the second largest commercial bank
(Mekala et al. 2009).
in Thailand. It offers discounted interest rates of up to
–1.5% of the minimum lending rate for hotels committed
to reducing their impacts on marine biodiversity and Caribbean Region: innovative solutions and
improving their environmental management. The facility financing mechanisms for water treatment
offers long-term loans to finance investments mainly
in wastewater treatment, solid waste management,
13 countries in the Wider Caribbean region benefitted
and water consumption management. To participate,
from the Caribbean Regional Fund for Wastewater
the hotels must adopt an Environmental Management
Management (CREW) project, funded by the GEF and co-
System and green certification.
implemented by IDB and UN Environment in 2011-2016.
Some of the achievements included Land-Based Sources
Manila, Philippines, sewage treatment: financial of Marine Pollution Protocol (LBS protocol) ratified by
incentives and private sector participation Jamaica and Costa Rica, over 37,000 people (8,400
households) getting access to improved wastewater
treatment, and 12 new wastewater treatment plants to
The GEF4/IBRD5 Manila Third Sewerage project provided
be completed. The following financial mechanisms were
sewerage services to 20% of the 12 million residents of the
established:
Metropolitan Manila Area (640 km), sanitation services to
57% of the population, reduced the biochemical oxygen
• In Belize and Guyana, National Wastewater Revolving
demand (BOD) load in Manila bay by 9,000 tonnes per
Funds worth $5m and $3m respectively will provide
year, and estimated reduction of 2,200t/year of N and
below-market interest rate loans for wastewater
340 t/year of P (figures as of 2014). To increase private
treatment projects.
sector investment, two key policy areas were identified
• In Jamaica, Credit Enhancement Facility worth $3m will
through extensive consultation - making septage
provide credit enhancement for local commercial bank
manage compulsory and increasing minimum standards
financing of wastewater projects. The government
for industrial pre-treatment - with policy drafted and
of Jamaica pledged an additional $12M, with total
adopted, and serving as a model for adoption by other
financing expected to grow substantially. 13 projects are
local governments. Use of market-based incentives for
planned involving either rehabilitation or construction
pollution reduction was achieved through expanding the
of wastewater facilities.
pollutants covered under the Environmental User Fee,
institutional strengthening, community participation, and
A second phase of CReW project was approved in 2017
the awareness raising.
with $14 million of financing, covering 18 countries in the
4 The Global Environment Facility
5 The International Bank for Reconstruction and Development
11 | Solving Marine Pollutionregion. Additional information can be found in Cost- depending on their size, location, scale, management,
Benefit Analysis section and Annex 4. and overall efficiency. Trading allows sources with
high abatement costs to purchase pollution discharge
reductions from sources with lower abatement costs.
Cartagena, Colombia: Private ownership and legal Entities with lower abatement costs can economically
framework lower their pollution discharges beyond regulated or
permitted levels, enabling them to sell their excess
Cartagena underwent an environmental and public reductions to entities with higher costs. Water quality
health crisis in the mid-1990s, caused by rapid population trading is most commonly applied to nutrients (such as
growth, unplanned urban development, and poor N and P), but it has also been applied to temperature,
wastewater management. In response, the government selenium, and sediment. In 2009, there were 26 active
adopted a new National Environmental Law in 1993, which water quality trading programs worldwide (WRI 2009), 21
created a framework for environmental management located in the United States, and the rest in Australia,
and autonomous regional environmental authorities. New Zealand, and Canada.
The key to the solution was liquidation of the municipal
wastewater utility and creation of a mixed-capital company
ACUCAR, owned by a Spanish private company 46%, US: Low-cost financing and reinvestments through
the Colombian state 50%, and the public 4%. ACUCAR the Revolving Fund
implemented the infrastructure development program,
which covered improving the water supply service; The Clean Water State Revolving Fund (CWSRF) program
improving drainage in high-value economic areas; in the United States is an independent and permanent
improving water circulation in the lagoon; and collecting, source of low-cost financing to fund a wide variety of
treating, and disposing Cartagena wastewater (Table 2). water quality infrastructure projects. Funds can be used
Now Cartagena’s Caribbean beaches are essentially for nonpoint-source pollution management, watershed
free of contamination from sewage, and Cartagena Bay protection and restoration, estuary management
water quality is significantly improved. projects, and traditional municipal wastewater treatment
projects. Funds for the CWSRF programs are provided
through federal government grants and state matching
Water quality trading in developed countries funds (20% of federal). As the loans are repaid, money
becomes available to be used again for new financing -
Water quality trading is a market-based instrument that is a true revolving fund. Building on a federal investment of
gaining popularity as a mechanism to meet water quality over $39 billion, the state CWSRFs have provided more
goals cost-effectively. It is premised on the fact that the than $111 billion to communities through 2015.
costs of reducing pollution differ among individual entities,
Table 2. Cartagena Water Infrastructure Development Program
Water supply Water supply Sewerage Sewerage Wastewater Revenues
Year
coverage customer coverage customers treated COP-milliion
1995 73% 92,573 61% 77,553 0% 25,592
2013 99.9% 233,412 90.3% 211,022 >90% 165,889
Solving Marine Pollution | 12Agricultural Runoff losses from corn and soybeans conventionally tilled
(Howarth and Ramakrishna 2005).
As the vulnerability to agricultural runoff and the cost • Practices to control nutrients runoff from sedimentation
of prevention vary, it is important to identify runoff include maintaining natural vegetation along canals,
hotspots and set policies on both local and regional rivers, and coastal wetlands to lessen soil erosion into
levels. Nitrogen and phosphorus input-output cycle can coastal or riparian areas.
be localized in the single field or have a transboundary • Reducing agricultural runoff (nonpoint source pollution)
nature due to air and water movement and the global from irrigation includes measuring actual crop needs,
increase in N2O concentrations. This requires solutions applying only the amount of water required, and using
that consider local and regional conditions while higher efficiency irrigation equipment.
addressing the necessary improvement in nutrient use • And, to reduce contamination from pesticides, farmers
efficiency at the global scale. can use integrated pest management techniques -
based on the specific soils, climate, pest history, and
Determining and reducing the amount of nutrients crop conditions of a field - which include using natural
in animal feed and crop fertilizers maximizes the pest barriers, reducing pesticide use, and minimizing
efficiency of their use and brings economic benefits. pesticide movement from the field.
The Millennium Ecosystem Assessment estimated that
the United States alone applies 20-30% more fertilizer Methods to reduce phosphorus runoff - which does
to crops than is necessary (Howarth and Ramakrishna not spread nearly as far as nitrogen and thus affects
2005). Animals are also often given far more nutrients immediate ecosystems of freshwater and coastal lagoons
than their bodies can absorb, leaving the rest to be - include tillage, planting along contours, and creating
expelled out as manure. Reduction in phosphorus in cow buffer zones. Constructed wetlands that “soak up” all
diets from 0.31% to 0.47% led to increased milk production types of nutrient runoff, and provide a complementary
(42.4 g/da to 79 g/day) and reduction in phosphorus nature-based solution to conventional wastewater
dissolved in runoff (from 79 g/ha to 7 g/ha). Strategies to treatments, are estimated to reduce between 11-49%
reduce the surplus nitrogen in animal production include of phosphorous and 26-78% of nitrogen, and 5-90% of
selecting and optimizing the feeds with appropriate N different pharmaceuticals (WWDR 2018; Zhen et al. 2011).
concentration and an ideal protein composition.
Technologies exist that can remove up to 95% of
Good agricultural practices that reduce N and P runoff phosphorus and up to 90% of nitrogen from sewage,
include planting perennial and winter crops, applying but they are quite expensive. The cost can be reduced
fertilizers at the right time, conducting tillage, reducing if the treatment plant is built to treat sewage for nitrogen
sedimentation, rational irrigation, and pesticides and phosphorus from the start. Furthermore, current
management: sewage plants can be adjusted and new ones built in
areas with a high population density, spreading the cost
• Planting perennial crops instead of annual ones in of the new technology over a large amount of people.
highly sensitive areas would retain nitrogen in the soil
and greatly reduce the loss of groundwater. Planting Financial mechanisms, similarly to those found in
winter crops would reduce the rate of nitrates leaching wastewater management, include taxes and water
into the ground, which generally occurs in the winter quality trading. Selective sales taxes on “polluting items”
and spring due to heavier rainfall. It can also provide raise revenue and can shift behavior away from polluting
an economic benefit from increased agricultural products. Nutrient trading is an environmental market
production and the added benefit of nitrogen fixation for a voluntary exchange between a buyer and a seller.
provided by the winter crop. What is being exchanged is a unit of environmental
• Fields with winter cover plowed under in the spring improvement, or nutrient credits. This market is driven
have 55% less water runoff and 50% less soil loss by regulatory compliance of a set volume of nutrients
annually than do fields with no winter cover. And soil allowable within water quality regulations for a given
losses from corn or soybeans no-tilled into a vigorous water body.
growth of rye or wheat can be 90-95% less than soil
13 | Solving Marine PollutionSolution Examples agricultural production in the EU. Using the CBA results,
a translocation of agricultural production in the EU from
northwest to east would create net social benefits in
Danube/Black Sea partnership: nitrogen and both regions. The CBA analysis for the EU could be a
phosphorus reduction in Romania good model for other regions.
Danube/Black Sea Strategic Partnership on Nutrient
Reduction was launched in 2001 with almost $100 million EU fertilizer controls: Voluntary and mandatory
in combined funding from the GEF, The World Bank, planning and monitoring
UNDP, UNEP, and other sources. The Investment Fund
for Nutrient Reduction was established with $70 million Voluntary and mandated controls in the EU for fertilizers
of GEF financing and $260 million of co-financing. It (FAO/ECE 1991), established in 1991, are still relevant and
provided country-level investments during 2001-2013 can be used for nutrient management:
for reducing nutrient pollution in the Black Sea and
accelerating investments in sectors such as municipal Mineral fertilizers
wastewater, agricultural run-off, and industrial pollution.
• Taxes on fertilizer
The funds for Calarasi region in the Southeast of Romania • Fertilizer plans
were used for technology innovation, capacity building, • Preventing the leaching of nutrients after the growing
and public awareness campaigns. These interventions season by increasing the area under autumn/winter
achieved results on multiple scales: improved local green cover and by sowing crops with elevated
water quality, leading to improved health and agricultural nitrogen
practices, and reduced nutrient run-off on the radiational • Promoting and subsidizing better application methods,
scale, thereby improving health of the Danube and the developing new, environmentally sound fertilizers, and
Black Sea. At the end of the project, the area of the promoting soil testing
region under improved nutrient management increased • Limiting the use of fertilizers in water extraction areas
from zero to nearly 34%. Importantly, the Romanian and nature protection areas
government in 2007 introduced nation-wide policies
that replicated the best practices demonstrated in the Organic fertilizers
Calarasi region. The success of the project, coupled
Romania’s commitments to meet the EU Nitrates Directive • Maximum number of animals per hectare based on
requirements, resulted in the loan support from the World the amount of manure that can be safely applied per
Bank, as well as $5.5 million GEF grant for Integrated hectare of land
Nutrient Pollution Control project for 2008-2017. In 2017, • Maximum quantities of manure that can be applied on
the Romanian government collaborated with the World the land is fixed, based on the N and P content of the
Bank to initiate another Nutrient Pollution Control project manure
for 2017-2022 to support the baseline created under the • Holdings wishing to keep more than a given number of
original GEF initiative. animals must obtain a license
• The periods during which manure can be applied to
EU policy for improving nitrogen use efficiency the land have been limited, and it must be worked into
the ground immediately afterwards
A cost-benefit analysis (CBA) of nitrogen use efficiency, • Establishment of regulations on minimum capacity for
conducted for 29 EU countries (Van Grinsven et al. 2013), manure storage facilities
showed large potential to increase nitrogen efficiencies • Fertilizer plans
and reduce runoff from manure and fertilizer use with • Taxes on surplus manure
limited effects on agricultural production. Implementation • Areas under autumn/winter green cover extended, and
of a policy targeting optimum N rates would initially green fallowing (uncultivated land) is being promoted
reduce the total cereal production. This, in turn, could • Maximum amounts established for spreading of
increase market prices of cereal and lead to a decrease sewage sludge on land based on heavy metal content
in demand or an increase of production in areas where • Change in composition of feed to reduce amount of
N input rates are lower. The EU Common Agricultural nutrients and heavy metals
Policy, with an annual budget of €70 billion, along with • Research and implementation of means of reducing
environmental directives, could provide the means, ammonia loss
conditions, and instruments for a spatial optimization of
Solving Marine Pollution | 14and anaerobic digestion technologies - with 92 training
Costa Rica, Colombia, and Nicaragua: pesticide
courses and workshops held at national, provincial,
reductions through best agricultural practices for
district to commune levels for about 9,000 participants.
pineapple and banana cultivation
The project developed country-specific replication
strategies to guide the process into the future. The
Three GEF/UNEP RepCar6 projects in the Caribbean project reduced impacts of livestock-induced pollution
(UNEP 2011a) towards applying best agricultural practices in fresh and marine surface waters and risks to human
in pineapple and banana farms gained the following health through an estimate reduction of 3,600 ton of
lessons in reducing the pesticide use: P, 6,200 ton of N, 41,100 ton of BOD was avoided from
discharges into the South China Sea.
• In banana cultivation, the achieved pesticides reduction
was 33% of nematicides and 100% of herbicides,
corresponding to 7.6% of all pesticides applied in Australia: reducing nutrient runoff through improved
bananas compared with conventional management sugarcane cultivation practices
practices. Although the cost-benefit analysis showed
negative balance in the short term due to the initial cost As part of a global partnership between the Coca-
of establishing the system, it is predicted to reverse Cola Company and the WWF to conserve freshwater
once the system becomes more stable over the years. resources, Project Catalyst in Australia engages farmers
• To mitigate the runoff of pesticides to water bodies, to improve sugarcane cultivation practices, while
vegetation cover was established in the drainage measuring impacts on freshwater and reef ecosystems.
channels and buffer areas. To complement the full The goal was to halve nutrient runoff to freshwater
recovery of the plantation, work was done toward catchments in five years, and to use acquired knowledge
improving soil and root health by reducing the use of sustainable farming for replication and scaling globally.
of synthetic fertilizers and applying calcium, non- Project commenced in 2009 with 19 cane farmers and
acidifying nitrogen sources, organic matter, and 4,800 ha of land and expanded more than four times.
organic substrates highly colonized by beneficial It has improved the water quality of 101,725 megaliters
microorganisms. (26 billion gallons) of runoff and provided the following
• In pineapple cultivation, the achieved pesticides annual load reductions to the Great Barrier Reef:
reduction was 70% of nematicides and 100% of particulate nitrogen - 72 tons; particulate phosphorous -
herbicides in the control group (35% on average 34 tons; dissolved inorganic nitrogen - 64 tons; filterable
over the entire cycle), 70% of fungicides, and 55% of reactive phosphorus - 13 tons; pesticide - 551 kg.
insecticides. This represented 40% of all pesticides
applied in pineapples. The cost-benefit analysis
showed a reduction in the costs of alternative pest
treatments due to the decrease in applications (both Chesapeake Bay, US: nutrient trading and nutrient
supplies and labor costs); these represented 66% runoff reduction
and 45% respectively of the costs of the conventional
treatments. During 2001-11, four Chesapeake Bay states - Maryland,
Pennsylvania, Virginia, and West Virginia - introduced
nutrient trading programs to provide wastewater
Thailand, China, Vietnam: livestock waste treatment plants with flexible options for meeting and
management technological solutions maintaining permitted nutrient load limits. Through these
programs, wastewater treatment plants may purchase
The GEF/IBRD Livestock Waste Management (LWM) in credits or offsets generated by other wastewater
East Asia project helped develop pollution mitigation treatment plants or farms that reduce the nutrients
technologies in China, Thailand, and Vietnam. It they release to impaired water bodies. States are also
improved pollution control practices and regulations; exploring options for construction and urban stormwater
altered the spatial distribution of livestock production programs to buy and sell credits and offsets.
facilities; raised awareness and promoted information
exchange on pollution threats and health problems from
livestock waste. A total of 58 LWM systems supported
by 10 proven LWM technological packages were
constructed - covering composting, aeration processes
6 REPCar = Reduciendo el Escurrimiento de Plaguicidas al Mar Caribe, or Reducing Pesticide Runoff to the Caribbean Sea
15 | Solving Marine PollutionMarine Litter Australia, and Japan classify plastics as solid waste,
treating them like food scraps or grass clippings –
Arguably, solid waste reduction (particularly plastics) despite their harmful effects, toxicity, and ability to absorb
is mainly a regulatory and policy issue.7 Meaning other pollutants. Heightened public awareness can
the solution lies in providing an enabling environment change behavior through increased public access to
for a new technology, investing in waste management rivers, streams, and beaches. Additionally, through public
infrastructure, and changing consumer behavior. An land and use management programs, governments can
example of such regulatory plastic reduction attempt buy conservation easements along the river/coast that
is the adoption of first-ever Europe-wide strategy on prohibit development and require new developments to
plastics in 2018.8 The strategy envisages recycling of control pollution stringently.
all plastic packaging by 2030, reducing consumption of
single-use plastics and restriction of the intentional use Economic incentives include: product take-back/buy-
of microplastics. Another example is the G20 action plan back programs10 for items such as electronics, tires,
on marine litter as of 2017, which aims to prevent and plastics bags, and packaging waste, providing access
substantially reduce marine litter by 2025. Reducing to low-cost, recyclable inputs for future operations for
the use of substances of concern and substituting them the manufacturer; environmentally preferred purchasing
with less harmful alternatives is the first step of the waste programs - voluntary or mandatory for government
hierarchy: prevention, which includes production and agencies and corporations, effectively stimulating
consumption. Marine litter solutions presented below demand for recycled content products; and product bans
are built into the plastics value chain: (1) production and taxes. Funds generated can support environmental
and consumption of plastics (upstream measures) programs, including recycling or other waste activities.
and (2) collection, recycling, conversion and disposal Plastic bags (LDPE) and styrofoam (polystyrene-PS) are
(downstream measures).9 the most common plastic products subjected to bans
and taxes.
(1) Production and consumption
Promoting better materials for packaging and single- Solution Examples
use applications, as well as innovative products for
multiple reuse and recycle can reduce about 30% Extended producer responsibility (EPR), packaging
of plastic packaging that would otherwise never be directives, and product redesign
reused or recycled (World Economic Forum and Ellen
MacArthur Foundation 2017). Policy mechanisms for • More than 35 countries worldwide and several
packaging solutions include packaging directives, Canadian provinces have adopted EPR policies on
product bans and taxes, and extended producer packaging waste and printed paper (SAIC 2012).11
responsibility, EPR (SAIC 2012). The latter aims to • The State of California began implementing the Rigid
decrease a total environmental impact of a product by Plastic Packaging Container Law in 1991. Manufacturers
making the manufacturer responsible for the entire life must meet one of five product requirements: (i) min of
cycle of the product and especially for the take-back, 25% post-consumer material generated in California;
recycling, and final disposal. (ii) weight reduced by 10%; (iii) refillable five times; (iv)
reusable five times; (v) 45% recycling rate.
Preventing waste can be also addressed via • In 2018, the number of companies working toward
discouraging unnecessary consumption through 100% reusable, reusable, recyclable or compostable
the classification measures, public awareness and packaging by 2025 or earlier has grown to 11 – Amcor,
economic incentives. Classifying the most harmful Ecover, Evian, L’Oréal, Mars, M&S, PepsiCo, The Coca-
plastics as hazardous would empower regulatory Cola Company, Unilever, Walmart, and Werner & Mertz
agencies to prevent accumulation of marine debris - together representing more than 6 million tonnes of
(Rochman et al. 2013). The United States, Europe, plastic packaging per year.
7 Many policy solutions in this section are drawn from Plastic Marine Litter and the Mitigation of Land-Based Sources report prepared by Ocean Recovery Alliance
under the GPO partnership and the PMEH program
8 European Commission press-release on the first-ever Europe-wide strategy on plastics, http://europa.eu/rapid/press-release_IP-18-5_en.htm
9 Private and investments solutions are largely drawn from the Sea of Opportunity report, 2017
10 Product Takeback presentation, at http://www.ce.berkeley.edu/~horvath/NATO_ARW/FILES/Klausner.pdf
11 EPR is a policy mechanism that shifts financial and/or physical responsibility of managing products at the end of their useful life away from local government and
onto product manufacturers.
Solving Marine Pollution | 16• WalMart introduced a scorecard in 2006 for suppliers to Missouri states prohibit local governments from banning
self-evaluate against their peers based on packaging plastics bags, justifying it as protecting businesses from
innovation, recycled content, product-to-package ratio, additional regulations.
and recovery value. WalMart has reduced waste in its
US operations by 80%+ and returned more than $231 Reusable coffee cups
million to its business in 2011.
• Aveda committed to use post-consumer recycled • In 2014, Hamburg, Germany, introduced refillable cups
content in all packaging. from biodegradable material that can be returned to
• LEGO committed in 2015 for the next 15 years to find any shop in the network for a refund. Customers can
more sustainable plastics both for packaging and to also buy the cup with their own fitted lid. In New York,
replace ABS as the single material used to make LEGO in 2014, students came up with a cup-sharing program
bricks.12 that allows members to drop off their empty mug in a
• Several organizations won the 2018 Ellen MacArthur collection bin near the subway or at another cafe. The
Foundation competition for new recyclable and cup’s lid acts as a membership card.
compostable packaging solutions: (i) the University • The UK opened two specialist plants for recycling
of Pittsburgh and Aronax Technologies Spain used coffee cups in 2013, followed by the establishment
nano-engineering to mimic the way nature uses of Simply Cups to help businesses segregate and
molecular building blocks to create a large variety of transport their cups to these plants. As a trial, Simply
materials; (ii) the VTT Technical Research Centre of Cups has been collecting cups from a few working
Finland created a compostable multi-layer material Costa, Pret A Manger and McDonald’s stores, with
from agricultural and forestry by-products, while the expansion planned into 2,000 stores. Having coffee
Fraunhofer Institute for Silicate Research developed a cup recycling points in town centers is another
fully compostable silicate and biopolymer coating for possible solution, piloted in Manchester with large
a range of food packaging; (iii) Full Cycle Bioplastics, bins for the collection of cups. Waitrose, Greggs, KFC
Elk Packaging and Associated Labels and Packaging and other coffee retailers have financially supported
created a compostable, high-performance material the campaign. Yet there still needs to be greater
from agricultural by-products and food waste to cooperation and investment from businesses to solve
pack products varying from granola bars to laundry this problem, especially bigger businesses.
detergent.
(2) Collection, recycling, conversion, and disposal
Plastic bag bans
There are three main issues around collection. First,
Governments all over the world have acted to ban optimizing collection and street sweeping includes
the sale of lightweight bags, charge customers for vehicle routing, frequency of collection and street
lightweight bags and/or generate taxes from the stores sweeping (based on litter loading and climate patterns),
who sell them. The Bangladesh government was the first use of appropriate technologies (vehicles, hand carts),
to do so in 2002, imposing a total ban on the bag. The and properly sized bins/bags. Second, supporting the
trend is growing and currently plastic bags are banned in informal waste sector involves offering training and
Rwanda, China, Taiwan, Macedonia Mexico City, Rwanda, micro-loans to help waste pickers, who are mostly women,
UK (Modbury), Yangon (Myanmar), China (restricted use), to establish SMEs. Enhancing recycling, repurposing
Bangladesh, Australia (12 towns, including Sydney)13 and (“upcycling”), and composting to better capture waste
most recently (August 2017) Kenya. Other places have at each stage of the value chain provides income for
discouraged use of plastic bags through financial means vulnerable populations in lower-income countries. Third,
rather than a ban. Italy, Belgium, and Ireland have taxed clean-up campaigns and litter collection education
plastic bags since before 2008. In Ireland, plastic bag can combine with increased convenience, such as
use dropped by 94% within weeks of the 2002 ban. In bin placement in strategic public places, single stream
Switzerland, Germany, and Holland, plastic bags come recycling and drop-off centers. Clean-up campaigns,
with a fee. In US, the bans were adopted in California, whose benefits are temporary, should occur in parallel to
coastal North Carolina, and the cities of Portland, Austin, waste prevention strategies.
Seattle and Chicago; while Michigan, Arizona and
12 Fisher, G., Lego says its plastic pieces will be made with sustainable material by 2030, in Quartz. 2015, http://
qz.com/437264/lego-says-its-plastic-pieces-will-be-madewith-sustainable-material-by-2030/
13 How Many Cities Have a Ban on Plastic Bags? Rachel Cemansky, http://people.howstuffworks.com/how-many-cities-have-a-ban-on-plastic-bags.htm roduct
Takeback presentation, at http://www.ce.berkeley.edu/~horvath/NATO_ARW/FILES/Klausner.pdf
17 | Solving Marine PollutionYou can also read