The Northland Diabetes Strategy - He Kaupapa Oranga mo te Mate Huka I Roto I Te Tai Tokerau
←
→
Page content transcription
If your browser does not render page correctly, please read the page content below
The Northland
Diabetes Strategy
   He Kaupapa Oranga mo te
Mate Huka I Roto I Te Tai Tokerau

              Successfully
              Taking
              Action for
              Northland
              Diabetes

    Adopted by the Board December 2006
Acknowledgements
The Diabetes Planning Group would like to acknowledge the following key stakeholders who
provided comment throughout its development and the peer reviewers who commented on the
final document.
Veronica and Te Rore Neho Mandy Bax
Tom Parore Chris Farrelly
Thea Symays Vicky Tyrrell
Ross Whimp Angela Thornton
Queenie Kauwhata Stephen Jackson
Vicky Corbett Dr Nick Chamberlain
Tracy Wortelboer Jenni Moore
Chris Frost Di Lawson
Dallas Alexander David Overton
Joe Wickcliffe and family Dr Nicole McGrath
Graheme Comer Fiona Ross
Nancy Yakkas Glenis Turner
Jean Gardener Mereana Waaka - Murch
Wendy Lunjevich Jeanette Wedding
Primecare practice nursing staff Daniella Tylkowski
Anne Braithwaite Joy Jansen
Sue Wordsworth Jim Callaghan
Wendy Buckley Ngaire Rae
Isabelle Cherrington Phillipa Butterini
Inia Eruera Dagmar Schmitt
Rhoena Davis Judy McCardy
Dr Alan Davis Chris Tipa
Liz Allen Rose Lightfoot
Richard Smith Catherine Turner
Eve De Goey Taane Thomas
Carol Evans Witi Ashby
Susan Harris Agnes Maddren
Arlene Baldwin Northland Pacific Island Trust
Jane Holden Diabetes Northland
Kim Clarkson Henrietta Sakey
The Strategy was peer reviewed by:
Dr Sandy Dawson, Chief Clinical Advisor, Clinical Services Improvement, Clinical Services
Directorate, Ministry of Health
Lyn Taylor, Primary Care Portfolio Manager, Hutt Valley DHB
Kate Smallman, Diabetes Projects Trust, Counties ManukauContents
1
TU UT Executive summary ................................................................................................................1
TU UT
2
TU UT Development of STAND .........................................................................................................4
TU UT
2.1 Northland context ..........................................................................................................4
TU UT TU UT
2.2 National context ............................................................................................................4
TU UT TU UT
3
TU UT Diabetes and its treatment .....................................................................................................6
TU UT
3.1 What is diabetes? .........................................................................................................6
TU UT TU UT
3.2 Life course approach to chronic care management ......................................................9
TU UT TU UT
3.3 Effective treatment ......................................................................................................10
TU UT TU UT
4
TU UT Prevalence and service provision ........................................................................................11
TU UT
4.1 New Zealand ...............................................................................................................11
TU UT TU UT
4.2 Northland ....................................................................................................................11
TU UT TU UT
5
TU UT Reducing inequalities ...........................................................................................................23
TU UT
5.1 Background .................................................................................................................23
TU UT TU UT
5.2 How can we reduce inequalities in diabetes? .............................................................24
TU UT TU UT
5.3 Tools to assist in reducing inequalities .......................................................................24
TU UT TU UT
5.4 He Korowai Oranga ....................................................................................................25
TU UT TU UT
6
TU UT Priorities for action ...............................................................................................................28
TU UT
6.1 Implementing HEHA and strengthening health promotion ..........................................28
TU UT TU UT
6.2 Children and diabetes .................................................................................................35
TU UT TU UT
6.3 A patient-centred clinical care pathway ......................................................................38
TU UT TU UT
6.4 Review existing services for those with diabetes ........................................................43
TU UT TU UT
6.5 Develop an effective coordinated workforce ...............................................................45
TU UT TU UT
6.6 Information systems that best support STAND ...........................................................51
TU UT TU UT
6.7 A district-wide coordinated approach ..........................................................................53
TU UT TU UT
7
TU UT Evaluation of stand and Performance measures .................................................................55
TU UT
7.1 Developing Key Performance Indicators (KPIs) .........................................................55
TU UT TU UT
7.2 Proposed Approach to KPIs .......................................................................................57
TU UT TU UT
TU Glossary .....................................................................................................................................60
UT
Figure 1.
TU UT The structure of He Korowai Oranga .........................................................................5
TU UT
Figure 2.
TU UT The progression of type 2 diabetes ............................................................................6
TU UT
Figure 3.
TU UT Changes in age-adjusted death rates in the USA for diabetes, stroke and
TU
cardiovascular disease ...............................................................................................8
UT
Figure 4.
TU UT TU Continuum of Wellbeing and Disease ........................................................................9 UT
Figure 5.
TU UT Estimated prevalence of (total number of people with) type 2 diabetes in
TU
Northland, 2005 ........................................................................................................12
UT
Figure 6.
TU UT Incidence (new cases) of Type 2 diabetes in Northland, 2005 ................................13
TU UT
Figure 7.
TU UT TU Mortality attributable to diabetes in Northland ..........................................................13 UT
Figure 8.
TU UT Northlanders with diabetes, by ethnicity, who are registered with PHOs, May
TU
2005 .........................................................................................................................14
UT
Figure 9.
TU UT Numbers of people with diabetes receiving Annual Free Checks by PHO
TU
area and deprivation level, 2004 calendar year .......................................................16 UT
Figure 10. Reductions in cardiovascular morbidity and mortality from one intervention ...........18
TU UT TU UT
Figure 11. Northlanders with diabetes, by ethnicity, who have received retinal screening
TU UT TU
within the past two years ..........................................................................................18
UT
Figure 12. Hospitalisations for diabetes, age standardised rate/100,000, 1996-2000 ..............20
TU UT TU UT
Figure 13. Hospitalisations for diabetes, age standardised rate/100,000 by ethnicity,
TU UT TU
1996-2000 ................................................................................................................20
UTFigure 14. Northland DHB patients with primary or secondary diagnosis of diabetes,
TU UT TU
financial years 2000-01 to 2004-05 estimated .........................................................21
UT
Figure 15. Admissions to hospital for people with diabetes, Northland 2001-2005 ..................21
TU UT TU UT
Figure 16. Growth in renal replacement therapy 2002-2005 among people with diabetes .......22
TU UT TU UT
Figure 17. Northland diabetes indicators 2003-2005 ................................................................22
TU UT TU UT
Figure 18. Reducing Inequalities Framework ............................................................................26
TU UT TU UT
Figure 19. Health Equity Assessment Tool ...............................................................................27
TU UT TU UT
Figure 20. Individual factors affecting health status ..................................................................27
TU UT TU UT
Figure 21. Secondary care referral protocol ..............................................................................40
TU UT TU UT
Figure 22. The diabetes care pathway ......................................................................................41
TU UT TU UT
Figure 23. Current service provision relating to diabetes in Northland .....................................47
TU UT TU UT
Figure 24. Outcome measures for STAND ...............................................................................56
TU UT TU UT
Figure 25. Key performance indicators for STAND ...................................................................57
TU UT TU UT
Figure 26. Proposed health outcome KPIs for STAND .............................................................58
TU UT TU UT
Figure 27. Proposed process outcome KPIs for STAND ..........................................................59
TU UT TU UT1 EXECUTIVE SUMMARY
Strategy development
STAND (Successfully Taking Action for Northland Diabetes), the Northland diabetes strategy,
has been developed by the Diabetes Planning Group to advise the Northland District Health
Board (DHB) on how to address the growing epidemic of diabetes in Northland. STAND has
been developed collaboratively with primary and secondary care providers, community
stakeholders and people with diabetes. Further work will be necessary to implement STAND
and monitor progress.
The overall aim of STAND is:
“To create an environment that stops people getting diabetes, slows its progression,
reduces its impact and improves the quality of life for those diagnosed with diabetes.”
Diabetes prevalence
An estimated 5,644 Northlanders have been diagnosed with either type 1 and type 2 diabetes.
Estimates of those undiagnosed range from a third to a half of this number. The impact of
diabetes on illness and mortality is significant, not just from the disease itself but from its
complications.
The prevalence of type 2 diabetes is increasing both in New Zealand and around the world.
With the number of people with diabetes in New Zealand predicted to double by 2011, the
burden of diabetes and its complications will rise significantly. Part of this increase derives
from demographic trends (population growth, an aging population, increasing proportions of
Maori, Pacific and Asian people). However 30% of the increase will be a consequence of
obesity which is becoming increasingly common.
Complications and costs
Apart from the direct cost of diabetes, the disease has a big impact on other areas of health
spending including:
heart attacks
strokes
lower limb amputations
eye disease
renal failure
maternity services, due to large, sick babies and difficulties in birthing
Diabetes cannot be viewed in isolation from cardiovascular disease because there is now clear
evidence that diabetes and pre-diabetes (impaired glucose tolerance and impaired fasting
glucose) are an underlying cause of up to 80% of coronary heart disease (CHD). A Northland
Cardiovascular Strategy is also being developed and will integrate with STAND to form a major
part of an overall Northland chronic disease strategy.
Preventing diabetes and minimising its impacts
STAND’s approach emphasises prevention, early detection and early intervention (using the
Leading for Outcomes Continuum of Wellbeing and Disease as a framework). Poor diet,
obesity, and reduced levels of exercise are major risk factors for diabetes, so efforts to improve
lifestyle behaviours in the general population are given priority. If precursor risk factors begin
to develop, early identification of them can enable damage to be reversed and health regained.
The Northland Diabetes Strategy Page 1 of 67Once the disease becomes established, regular monitoring and treatment regimens (which are
evidence based) should be agreed between health workers and people with diabetes and are
essential to maintaining health status and reducing the strain on health services.
Modelling shows that over the next 5 years, diabetes will account for 156 deaths from stroke
and heart attack if Northland patients with diabetes remain on their current treatments. By
ensuring all those at high risk are prescribed a statin (cholesterol-lowering drug), 20 deaths, 30
strokes and 20 heart attacks could be prevented.
Inequalities
Northland’s high level of deprivation and high Maori population, means it faces an enormous
challenge to control and prevent diabetes in its population. While Maori comprise about 30%
of the Northland population, 43% of people who have diabetes are Maori. Northland’s
avoidable hospitalisation rate for diabetes is nearly twice the national average and the Maori
rate of hospitalisation for diabetes is three times the Northland rate and five times the national
rate. Mortality rates for diabetes-related conditions are up to 8 times higher for Maori. Maori
present at a younger age than non-Maori for admission with diabetes and more Maori die of
diabetes than non-Maori. One of the key themes of STAND is to reduce inequalities for Maori
and other high needs populations. This means we should:
work within the framework of the Treaty of Waitangi to address issues for Maori; specifically
this means involving Maori at all levels and stages of health system planning and delivery
through processes that reflect the principles of partnership
equitably resource Kaupapa Maori programmes or any new or expanded initiatives
all workforce development initiatives aim to achieve a culturally responsive service, as
measured by the recipients
improve case detection and case management through incentives or other measures
improve uptake of retinal screening so that 80% of Maori receive screening at least bi-
annually
the Funder should continue to set and monitor ethnic-specific targets
carry out data improvement which enhances ethnicity information
continually strive to identify and address barriers to people accessing programmes and care
Priorities for action
STAND is built around 7 action areas. These, with their major recommendations are:
1 Implementing Healthy Eating Healthy Action and strengthening health promotion:
Develop a plan of action for implementation of Healthy Eating, Healthy Action
(HEHA) in Northland; the Diabetes Strategy Coordinator will need to work
alongside key stakeholders in the development and implementation of the plan
which should be negotiated among Northland providers to identify priorities,
responsibilities, linkages and timeframes.
Devise a plan of action for strengthening health promotion coordination and activity by
concentrating on the recommendations of the stocktake of Northland health promotion
providers undertaken in 2004 by three of the Northland PHOs.
2 Children and diabetes
Verbatim quotes have been
Develop a consistent, coordinated approach to inserted in boxes throughout
reducing the prevalence of factors which predispose the strategy, reflecting the
children to type 2 diabetes by concentrating on: prominence the group
considers should be given to
the prenatal environment the patient journey.
breastfeeding
The Northland Diabetes Strategy Page 2 of 67childhood obesity
intersectoral approaches
reducing inequalities
3 A patient-centred clinical care pathway
Further develop a patient-centred clinical care pathway for Northland.
Carry out regular audits of practice to monitor compliance with the pathway.
Carry out regular audits of the patient experience to monitor satisfaction with
changes to the pathway.
Continue to support enhanced primary care through primary prevention, diabetes
screening, annual free checks, and chronic care management.
Develop pathways specific to the needs of Maori.
Improve case detection and case management through incentives or other
measures for Maori.
Improve uptake of retinal screening so that 80% of Maori receive screening at least
biannually.
Continually identify and address barriers to people accessing programmes and
services in Northland.
4 Review existing services for those with diabetes
Carry out a review of all diabetes-related services throughout Northland.
Equitably resource kaupapa Maori programmes or any new or expanded initiatives.
Explore ways to enhance whanau, hapu, iwi, and community development.
5 Develop and support an effective coordinated workforce
Develop a workforce action plan that is aligned to the needs of people with diabetes in
Northland.
6 Information systems that best support STAND
Clarify the impact of the MoH national diabetes database (due to be available by the
end of 2005) before embarking on a diabetes information systems strategy for
Northland.
7 Develop a district-wide coordinated approach
Employ a Diabetes Strategy Coordinator within the Northland DHB’s Service
Development and Funding team who will work closely with the community in
partnership to implement STAND with recommendations to ensure that collaboration
and coordination occur. Ideally, this individual will have linkages with the community
and proven knowledge in health promotion.
For all priorities:
Work within the framework of the Treaty of Waitangi to address issues for Maori.
Specifically this means involving Maori at all levels and stages of health system
planning and delivery through processes that reflect the principles of partnership.
The Northland Diabetes Strategy Page 3 of 672 DEVELOPMENT OF STAND
2.1 Northland context
Diabetes has for several years been one of the major health needs identified in Northland
DHB’s annual plans. In September 2004 the Diabetes Planning Group was set up by the
General Manager Service Development and Funding to advise Northland DHB on how it
should approach diabetes.
The Diabetes Planning Group set up 5 focus groups which covered:
health promotion
primary care services “[Diagnosis] was a hell of
secondary care services a shock; you want to fight
against it. You need to
Maori and Pacific people’s needs
talk to someone for at
the views of patients and their families least half an hour [but] I
spent 3 minutes with my
The feedback received from these groups formed the basis of health care professional
the 7 priority action areas of STAND. at diagnosis. Information
came in dribs and drabs.”
STAND will be a significant component of the Northland
DHB’s District Strategic Plan, due for completion later in
2005. However, the work will not end there; once the strategy is finalised, there will remain the
tasks of implementing it and monitoring progress over the next few years.
2.2 National context
The approach taken in STAND has been guided by key documents and requirements which
exist at national level.
The New Zealand Health Strategy identifies 13 priority health objectives for implementation.
One of these is to reduce the incidence and impact of diabetes.
STAND reflects the commitment of the Northland DHB to recognising and implementing the
articles of The Treaty of Waitangi. This includes: 1 TP PT
Treaty based relationships, the terms of which are defined and developed in partnership
that the Treaty-based world view (that is, looking from both perspectives) needs to be
embraced as a development agenda so that Maori have a proper place and can function as
Maori in organisations within the sector
that there is an ability for Maori to operate from an independent position as a result of the
overarching Treaty relationship
that all people have a place and role in the community when the Maori position is secured
The Treaty provides a fundamental framework for reducing health inequalities in Northland
through putting into action the principles of partnership, participation and protection. It is
shown in:
setting targets for prioritising the funding of Maori health and disability initiatives
taking account of Northland's population profile and health needs analysis
building Maori provider capacity in service delivery
1
TP PT Report from Te Wero and its work to support the community and voluntary sector alongside the
Taskforce, 2003.
The Northland Diabetes Strategy Page 4 of 67improving upon quality issues
He Korowai Oranga and its action plan Whakatataka develop The Treaty of Waitangi into a
framework that enables its articles and principles to be applied to the health sector. Figure 1
summarises He Korowai Oranga’s approach. The 4 pathways are later used as analytical
tools in the reducing inequalities section of STAND.
Figure 1. The structure of He Korowai Oranga
Overall aim Whanau
Ora
Maori Crown
Directions aspirations aspirations
and and
contributions contributions
Key threads
Building on Reducing
Rangatiratanga
the gains inequalities
Whanau,
Pathways Effective Working
hapu, iwi, Maori
service across
community participation
delivery sectors
development
Outcome and performance measures
Resource allocation
Monitoring, research and evaluation
Treaty principles: partnership, participation, protection
The Ministry of Health’s (MoH’s) Leading for Outcomes (LFO) model has also been used in
the development of STAND. The Continuum of Wellbeing and Disease (Figure 4) takes a life
course approach, describing in stages a progression from health to development of disease
and potential death. It implies the desirability of healthier lifestyles to prevent chronic disease.
The LFO ‘river’ diagram (Figure 2) illustrates the progression of diabetes through the life
course.
The Northland Diabetes Strategy Page 5 of 673 DIABETES AND ITS TREATMENT
3.1 What is diabetes?
Diabetes mellitus is a complex condition in which the body is unable to control the amount of
glucose (sugar) in the blood, either because the hormone insulin does not work effectively or
there is an absence of insulin. Uncontrolled diabetes can lead to metabolic disturbances that
increase the risk of long term complications and affect a number of the body’s systems. Figure
2 shows the typical development of diabetes over the course of a lifetime.
Figure 2. The progression of type 2 diabetes
(Adapted from the Ministry of Health’s Leading for Outcomes material)
Factors such as socioeconomic
conditions, community,
environment, culture, work and
individual choice impact on
biological risks
Critical point at
which risk turns
Before into diabetes
concep- Ante-
tion natal Diabetes progression
Birth is inevitable but
is slowed with
changes in
behaviour
and medical
treatment
Risk of
diabetes
developing Diabetic
later in life
may be Biological risk Diabetes can be
Maternal Gestational raised in the of diabetes prevented if identified in
diabetes diabetes womb (eg obesity) early stages
Death
Risks develop as we grow and age
Source Lake River Sea
The majority of people who have diabetes either have type 1 or
“I had to ask my type 2 (the other main type is gestational diabetes which some
doctor to be referred women develop during pregnancy, though there are also other
to the nurses. All my causes). In New Zealand, around 10% of those diagnosed will
GP said was I’ve got have type 1 diabetes and 90% type 2 diabetes. Both type 1 and 2
to do something are on the increase.
about my blood
sugar, but what In type 1 diabetes, the pancreas produces insufficient insulin and
should I do? No-one usually presents with symptoms of extreme tiredness and thirst.
tells you about how Onset is usually rapid and can result in acute emergency
to lose weight.” admission. Uncontrolled hyperglycaemia or high blood sugar can
lead to ketoacidosis, a serious condition characterised by high
glucose levels, ketones in the urine, vomiting and drowsiness which
can cause multiple system failure and death. Type 1 diabetes may develop at any age and
can be the result of genetic factors. Its cause lies in viral infection and a breakdown in the
body’s autoimmune systems (not lifestyle).
The Northland Diabetes Strategy Page 6 of 67Type 2 diabetes has complex causes, including reduced sensitivity to circulating insulin, and is
usually related to excess weight gain. In other words, diabetes develops when the body can
still make some insulin, but not enough, or when the insulin that is produced does not work
properly (known as insulin resistance). It is treated by lifestyle modifications in the first
instance (exercise and a healthy diet) and due to the nature of the condition, many individuals
will need treatment with tablets or insulin at some stage during their life.
The onset of type 2 diabetes is usually much slower; patients may not display any symptoms
for many years, and seek help only when complications occur. Diabetes can have a major
impact on the physical, psychological and material wellbeing of individuals and their families
and can lead to complications associated with the disease.
People with type 2 diabetes are sometimes mistakenly told they have a ‘mild’ condition, but
research shows that type 2 diabetes is as likely as type 1 to cause serious complications.
Diabetes can have a debilitating effect for the person diagnosed. Life may be less enjoyable
and there is an increased risk of cardiovascular disease, kidney problems and serious
complications affecting the eyes and feet. There is no cure for diabetes and individuals are
mostly responsible for managing the condition themselves.
People with diabetes do not always have symptoms, in which case a diagnosis may not be
made until complications have already developed. The United Kingdom Prospective Diabetes
Study (UKPDS) found that up to 50% of people with type 2 diabetes have complications on
diagnosis.
The increasing number of people with type 2 diabetes is driven by several factors. These
include population growth, an aging population (which drives some 20% of the expected
growth in the prevalence of diabetes) and increasing obesity, which accounts for an additional
30% of the expected growth in prevalence of diabetes. Up to 40% of Maori children are
overweight or obese and type 2 diabetes is an increasing problem among children and
adolescents. It is estimated that 25% of severely obese children have impaired glucose
tolerance.
Ministry of Health analysis 2 currently ranks diabetes fourth in relation to the number of
TP PT
disability life years lost across the population, behind ischaemic heart disease (IHD), stroke
and chronic obstructive pulmonary disease (COPD). As diabetes often contributes to stroke
and IHD, but is not recorded as such, the real loss in disability adjusted life years (DALYs) may
be much greater than this. In the past 25 years, while there has been a drop in the age-
adjusted death rate for chronic diseases such as stroke and cardiovascular disease, the death
rate for diabetes has risen (Figure 3 over the page). 3 TP PTP
Diabetes is rarely a primary cause of death. However, in the US, the diabetes age-
standardised death rate rose 6% per year during 1991-96, in contrast to the trend for other
chronic diseases (Figure 3); a similar trend is expected in New Zealand. Maori death rates
are 4.6 times higher than the total population (47.4 compared with 10.3/100,000 population). 4 P
It is not possible to assess trends because of changes to ethnicity coding, however almost
P
two-thirds of Maori and Pacific peoples with diabetes will probably die from their diabetes
compared with one third of Europeans with diabetes. 4 TP PT
2
TP PT Our Health, Our Future, Hauora Pakari, Koiora Roa: The Health of New Zealanders. Available at
http://www.moh.govt.nz/moh.nsf/by+unid/6910156BE95E706E4C2568800002E403?Open .
TU UT
3
TP PT Diabetes 2000. Health Funding Authority, 2000. Available at
http://www.moh.govt.nz/moh.nsf/by+unid/4735077ED3FD9B56CC256A41000975CA?Open .
TU UT
4
TP PT The Management of Type 2 Diabetes. NZ Guidelines Group, Dec 2003. Available at
http://www.nzgg.org.nz/index.cfm .
TU UT
The Northland Diabetes Strategy Page 7 of 67Figure 3. Changes in age-adjusted death rates in the USA for diabetes, stroke and
cardiovascular disease 5 TP PT
5
TP PT Type 2 diabetes: managing for better health outcomes. (Prepared by PriceWaterhouse Coopers for
Diabetes NZ.) Diabetes NZ, 2001. Available at http://www.diabetes.org.nz/resources/pwcreport.html .
TU UT
The Northland Diabetes Strategy Page 8 of 673.2 Life course approach to chronic care management
The MoH’s Leading for Outcomes work includes a model of the Continuum of Wellbeing and
Disease (Figure 4) which divides the population into groups according to their level of health or
progression along a scale of illness. STAND adopts this approach as a convenient way of
analysing the various degrees of diabetes and the impacts these have on both individuals and
health services.
Figure 4. Continuum of Wellbeing and Disease
(Adapted from the Ministry of Health’s Leading for Outcomes material)
Healthy End stage
population Severe
debilitation,
hospitalisation
Precursor risk At risk Asymptomatic Mild symptoms Advanced and intensive,
symptoms costly treatment
Development of Damage Clinical Symptoms or palliative
attributes that accumulates, indicators of begin to have Symptoms and care.
might lead to risk factors disease exist an impact. complications
disease later. combine, though lead to
likelihood of individual may significant loss
disease not be aware of of health and
increases. them. independence,
and often
hospitalisation.
Damage can be reversed through change in Disease state, cure impossible. Damage often becomes
lifestyle and reducing risk factors. Health can be irreversible, and at best can be repaired or ameliorated
regained, the process reversed. through treatment and monitoring.
Disease management
Screening and detection
STAND’s 7 key action areas cover parts of the continuum in the following ways (the numbering
reflects the order they appear in section 6, not any particular priority):
Reduce inequalities
6.1 Implementing Healthy Eating Healthy Action, strengthening health promotion
6.2 Children and diabetes
6.3 Patient-centred clinical care pathway
6.4 Review existing services for those with diabetes
6.5 Develop an effective, coordinated workforce
6.6 Information systems that best support the strategy
6.7 A district-wide coordinated approach
The Northland Diabetes Strategy Page 9 of 67There is increasing evidence that many non-communicable diseases such as cardiovascular
disease and diabetes are determined not just by risk factors in mid to adult life, but by
behaviours throughout life. The life course approach
encompasses factors that date back to infancy and
childhood, and even back to before birth. The “There is a real lack of
traditional lifestyle model approach to chronic information. When you’re
disease, on the other hand, focuses almost Maori, you say it’s all right and
exclusively on adult risk factors. put it off. We need more
information in Maori and you
The life course model also considers the social need to say how it is, but in a
interventions which result in behavioural changes way that doesn’t belittle them
across all stages of lifespan (gestation, infancy, or call you fat or huge. You
childhood, adolescence, young adulthood and need a different approach”
midlife) which may affect risk of disease later on. 6 TP PT
3.3 Effective treatment
Despite the rapid growth in diabetes and its increasingly early onset, there is strong evidence
to show that:
the onset of diabetes can be delayed or even prevented 7 TP PT
effective management can increase life expectancy and reduce complications
self management is crucial to effective diabetes care 8 TP PT
Good management can reduce the risk of serious complications at an early stage. This means
prompt diagnosis, regular checks to identify serious complications at an early stage, and
treatment to control blood glucose levels.
Better blood glucose control reduces eye disease by one quarter and renal (kidney) disease by
one third; effective eye screening and treatment can reduce blindness by one half and early
intervention for foot problems can reduce amputations by two
thirds. 9 TP PT
“I think you need a
book, like Diabetes Support and education is crucial so that individuals can manage
and You, which tells this complex disease effectively themselves. In the long term,
you what to do and is empowering patients is the key to improving health and reducing
comprehensive. This demands on services.
has been a great help
to me, but we needed
it 20 years ago.”
6
TP PT Life course perspectives on coronary heart disease, stroke and diabetes. WHO, 2001. Available at
http://search.who.int/search?ie=utf8&site=default_collection&client=WHO&proxystylesheet=WHO&output=xml_no_dtd&oe=utf
TU
8&q=life+course .
UT
7
TP PT Diabetes Prevention Progam Research Group (Washington), 2002. Reduction in the incidence of
type 2 diabetes with lifestyle intervention or metformin. N Eng J Med, Feb 2002. Available at
http://content.nejm.org/content/vol346/issue6/index.shtml .
TU UT
8
TP PT Training in flexible, intensive insulin management to enable dietary freedom in people with type 1
diabetes: dose adjustment for normal eating (DAFNE) randomised controlled trial. BMJ 2002; 325,
746. Available at http://bmj.bmjjournals.com/content/vol325/issue7367/
TU UT
9
TP PT UK prospective diabetes study (UKPDS), 1998. Intensive blood glucose control with sulphonylureas
or insulin compared with conventional treatment and risk of complications in people with type 2
diabetes. Lancet 1998; 352: 837-853. Available at
http://www.thelancet.com/journals/lancet/article/PIIS0140673698070196/fulltext
TU UT
The Northland Diabetes Strategy Page 10 of 674 PREVALENCE AND SERVICE PROVISION
4.1 New Zealand
Diabetes affects about 200,000 people in New Zealand but only half of them have been
diagnosed. The prevalence of diabetes across the population of New Zealand is currently
estimated to be 4%.
In the next 20 years, it is projected that the prevalence of diabetes in New Zealand will, if left
unchecked, increase by:
90% in Maori
109% in Pacific peoples
39% in Europeans 5 P P
4.2 Northland
What the data tells us about diabetes in Northland
The number of people with diabetes in Northland is rising rapidly.
Although we don’t have exact numbers, it is estimated that 5,644 Northlanders have
so far been diagnosed with diabetes; between a third and a half of the diabetic
population are undiagnosed, so the total number may be as high as 8,000.
Diabetes occurs more frequently in Maori and Pacific peoples. While Maori are 30%
of Northland’s population, 43% of known individuals with diabetes are Maori.
Control of diabetes in Northland leaves much room for improvement:
About a third of people in Northland diagnosed with diabetes have blood
glucose levels that are poorly controlled. This figure rises to more than 40%
among Maori and nearly 40% among Pacific peoples.
Preventive measures are not well utilised. Less than 40% of individuals known
to have diabetes receive an annual free check. Of these only about two-thirds
have had a retinal screen (eye check) during the last 2 years.
Complications of diabetes are a significant and growing user of hospital
services. Hospital service use in Northland is 1.7 times that of New Zealand as
a whole. Between 2001 and 2005 the number of admissions to hospital for
diabetes-related conditions grew 3.3 times from 726 to 2,376. The average
number of days those people have had to stay in hospital have risen from 3.95
to 4.84.
The Northland Diabetes Strategy Page 11 of 67Northland, in common with the rest of New Zealand, is experiencing a growing epidemic of
type 2 diabetes. As one of the most serious chronic diseases facing Northlanders, diabetes
has been identified as a priority for Northland DHB. Northland has a high level of deprivation
and a high Maori population, and it will be an enormous challenge to prevent, control and
manage the condition.
Maori and Pacific peoples are at particular risk of diabetes. There is also growing evidence
that type 2 diabetes is being diagnosed at a much earlier age in children and young adults.
Ministry of Health prevalence statistics do not currently include the under 25 year old age
group, but Northland has at least 25 young people with type 2 diabetes known to secondary
care services.
Inequalities, Maori and diabetes in Northland
Figures 5 and 6 show that diabetes occurs at a much younger age for Maori. Because Maori
life expectancy is 12 years lower than non-Maori in Northland, there are much fewer Maori in
older age groups with diabetes.
Figure 5. Estimated prevalence of (total number of people with) type 2 diabetes in Northland,
2005 10
TP PT
800
700 Maori
Pacific
600 Other
Number of people
Total
500
400
300
200
100
0
25-29 30-34 35-39 40-44 45-49 50-54 55-59 60-64 65-69 70-74 75-79 80-84 85+
Age group
10
TP PT Northland Regional Diabetes Team report for 2005.
The Northland Diabetes Strategy Page 12 of 67Figure 6. Incidence (new cases) of Type 2 diabetes in Northland, 2005 11 TP PT
70
Maori
60
Pacific
Other
50
Number of people
Total
40
30
20
10
0
25-29 30-34 35-39 40-44 45-49 50-54 55-59 60-64 65-69 70-74 75-79 80-84 85+
Age group
Maori suffer from the effects of diabetes more than others in the Northland population. They
have a higher incidence (number of new cases) of type 2 diabetes than the general
population. 12 Maori in Northland are at least 25% more likely to die of diabetes-related
TP PT
illnesses and at a younger age than Non-Maori (Figure 7). 13 TP PT
Figure 7. Mortality attributable to diabetes in Northland
25
Maori
20 Pacific
Other
Number of people
Total
15
10
5
0
25-29 30-34 35-39 40-44 45-49 50-54 55-59 60-64 65-69 70-74 75-79 80-84 85+
Age group
Maori and non-Maori with diabetes are accessing annual free checks at a similar rate and
number in Northland. This equity between Maori and non-Maori has consistently been one of
the best in New Zealand. However, fewer Maori have good control of blood glucose (see
Figure 17).
11
TP PT Northland Regional Diabetes Team Report for 2005.
12
TP PT Reti S, 2004. Diabetes in Northland.
13
TP PT Northland Regional Diabetes Team Report for 2005.
The Northland Diabetes Strategy Page 13 of 67In 2004/05, prevalence of retinopathy (eye disease) among people with diabetes in Northland
was higher for Maori than non-Maori (20% all ethnicities, 24% Maori). Retinopathy prevalence
in the Northland’s total population is higher than New Zealand’s.
The Northland Regional Diabetes Team report for 2005 states:
It is pleasing to see that after the drop in retinal screening in 2004, the number of people
screened in 2005 is similar to previous levels in 2002 and 2003..... In 2004 there was a 20%
difference between Maori and Europeans, and this year this has been reduced to 7%. 14TP PT
Maori and Pacific peoples also have a higher percentage of people with diabetes who smoke
(26% compared to 12% in the European population). Efforts in cardiovascular risk factor
reduction are important measures to improve health outcomes.
Diabetes in the primary care setting
It is estimated that 5,644 people with diabetes (type 1 plus type 2) are registered with primary
care providers in Northland (Figure 8). Prevalence data suggests that there might be as many
as 8,000. This concurs with statements that up to 50% of those with diabetes are undiagnosed
(MoH; PriceWaterhouse Coopers, 2001).
Maori comprise 30% of Northland’s population, though the proportion of Northlanders with
diabetes who are Maori should be lower than this figure because of their younger age
structure. Their actual share is 43% (2,433 out of 5,644).
Figure 8. Northlanders with diabetes, by ethnicity, who are registered with PHOs, May 2005
Ethnicity Number % of total
Maori 2,433 43%
Other 3,145 55%
Pacific 65 1%
Total 5,644 100%
Enhancing primary care
Primary prevention strategies. Lifestyle interventions do seem to be effective in patients with
impaired glucose tolerance. An intensive dietary modification and exercise programme in the
USA resulted in a 58% reduction in incidence of diabetes. 15 In the US, the National Diabetes
TP PT
Prevention and Control Programmes have shown that individualised care through
comprehensive diabetes assessment, education, referral, and follow-up care through
innovative partnerships is very effective. Although exercise and physical activity can reduce
people’s risk of developing type 2 diabetes, particularly among those with elevated fasting
glucose levels and impaired glucose tolerance, translating this knowledge into effective public
health actions is not easy.
Diabetes and CVD risk screening programmes. This Northland pilot programme, organised
through Northland DHB, has screened 1,000 high-risk patients in 2 areas of Northland. It has
demonstrated:
the benefit of screening for diabetes, with a 3% yield of new diagnoses
14
TP PT Northland Regional Diabetes Team Report for 2005.
15
TP PT Diabetes Prevention Progam Research Group (Washington), 2002. Reduction in the incidence of
type 2 diabetes with lifestyle intervention or metformin. N Eng J Med, Feb 2002. Available at
http://content.nejm.org/content/vol346/issue6/index.shtml .
TU UT
The Northland Diabetes Strategy Page 14 of 67the high proportion of these patients with high cardiovascular risk – 20% have a greater
than15% risk of developing cardiovascular disease (angina, heart attack or stroke) in the
next 5 years6
the difficulties general practices have of reaching those with the highest risk
the importance of opportunistic screening rather than relying on a formal recall system
Screening for diabetes must be accompanied by screening for CVD risk and vice versa. It may
be that patients can better understand the concept of a greater than 20% (1 in 5) chance of
having a heart attack or stroke in the next 5 years, rather than a risk of developing diabetes,
which is still to many a largely asymptomatic disease.
Another project in the Far North is screening Maori males for cardiovascular risk in the
community. It is being extended to all high-risk patients and will be assisted by the Northland-
wide rollout of the Predict electronic decision support tool for cardiovascular disease and
diabetes.
There is a clear need for widespread opportunistic diabetes and CVD screening in general
practice and in Maori and Pacific provider and community health clinics. This should ensure
the screening pathway remains intact and that people with newly diagnosed diabetes can
access appropriate care and treatment. Prompts for screening of high-risk groups via patient
management systems, and the use of HbA1c for screening those patients who may not return
for a fasting plasma glucose, may be some of the pragmatic and innovative ways needed to
ensure that as many high risk people as possible are screened for diabetes.
Annual Free Checks. This is an initiative to provide people with diabetes with one free primary
care visit a year. Northland DHB is working with Northland PHOs to significantly increase the
number of Annual Free Checks performed each year. A template is filled out either manually
or electronically, and a checklist of examinations, investigations and interventions is
performed. The results are collated in a regional database and the Regional Diabetes Team
uses these to produce a yearly report. Results from an overseas study 16 suggest that aTP PT
structured approach to care can achieve positive results:
59% decreased their weight (mean decrease of 2.8%)
9.7% stopped smoking
43% reduced HbA1c (blood glucose) to less than the threshold level of 8
a 10.4% reduction in mean HbA1c in 12 months (from 9.52 to 8.53)
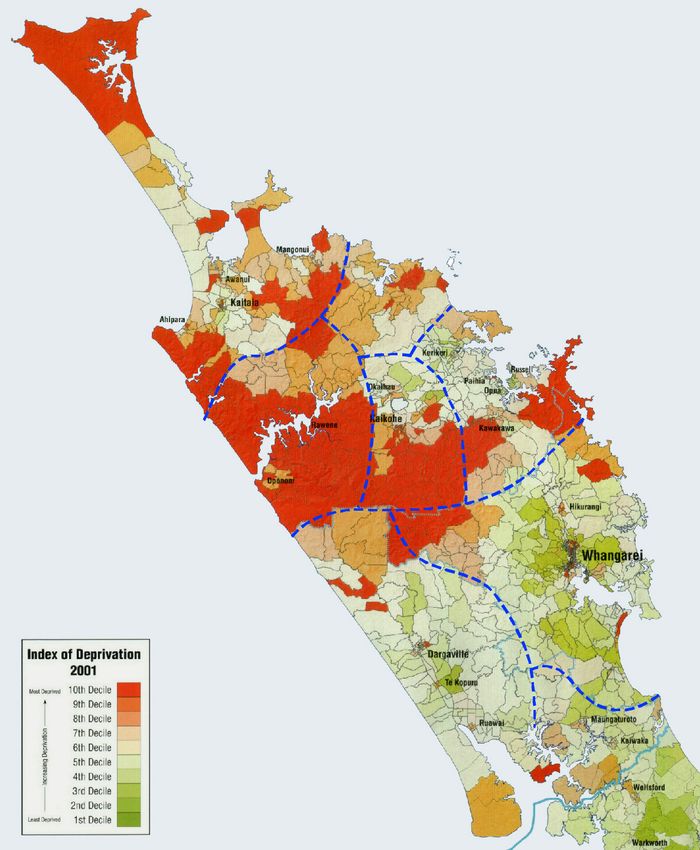
Figure 9 (over the page) overlays the deprivation map of Northland with, by PHO, the number
of people with diabetes currently enrolled with a GP and receiving annual free checks. There
is possibly some service overlap in the population of Kaiwaka, who are seen in secondary
services, but under the care of a PHO within the Waitemata DHB’s area.
Diabetes Chronic Care Management. Disease management is an evidence-based approach
to health service planning and provision that offers a more integrated and holistic approach for
patients with chronic disease. Care is focussed on people with the disease and their
experience of the complete clinical course of the condition, rather than viewing their care as a
series of discrete encounters with different parts of the healthcare system.
‘CarePlus’ is a PHO programme which assists general practices to provide free extended
quarterly visits for patients with diabetes complications or more than one chronic condition to
ensure that all areas of diabetic care are addressed. The emphasis is on evidence-based care
and reliance on guidelines (via either electronic means or hardcopy manual guidelines ) which
should ensure a consistent standard of care is delivered. A care plan is developed in
partnership between the patient and their primary care provider.
16
TP PT Tilyard M, 2002. New diabetes therapy. (Slides from a presentation to NZ Primary Care Conference.)
The Northland Diabetes Strategy Page 15 of 67Figure 9. Numbers of people with diabetes receiving Annual Free Checks by PHO area and
deprivation level, 2004 calendar year
Northland Approximate
Enrolled pop. Dec 04 146,302 PHO catchment
People receiving AFCs 2,555
Percent of enrolled pop. 1.7% Coast to Coast
PHO (part of
Waitemata DHB)
Te Tai Tokerau PHO
Enrolled pop. Dec 04 41,469 Whangaroa PHO
People receiving AFCs 249 Enrolled pop. Dec 04 3,218
Percent of enrolled pop. 0.6% People receiving AFCs 164
Percent of enrolled pop. 5.1%
Hokianga PHO
Enrolled pop. Dec 04 6,633
People receiving AFCs 313
Percent of enrolled pop. 4.7%
Tihewa Mauriora PHO
Enrolled pop. Dec 04 8,729
People receiving AFCs 376
Percent of enrolled pop. 4.3%
Kaipara PHO
Enrolled pop. Dec 04 12,008
People receiving AFCs 248
Percent of enrolled pop. 2.1%
Manaia PHO
Enrolled pop. Dec 04 74,245
People receiving AFCs 1205
Percent of enrolled pop. 1.6%
There is increasing recognition that the system changes and strategies required to improve
one chronic disease are the same as those found to improve care for other chronic conditions.
Evidence internationally 17 and from the Counties Manukau Chronic Care Management
TP PT
Programme 18 indicates that disease management programmes incorporating these changes
TP PT
can:
improve patient health outcomes
reduce avoidable hospital admissions
potentially save total health care expenditure
achieve this with high levels of patient and provider satisfaction
17
TP PTLuft H S, 2003. International perspectives on disease management. (Slides from a presentation to a
NZ Disease management conference.)
18
TP PTOgle M, 2003. Implementing chronic disease management in Northland. (Unpublished paper
prepared for Northland DHB.)
The Northland Diabetes Strategy Page 16 of 67The benefits of intensive management of diabetes and adherence to guidelines that occur in
Chronic Care Management programmes is demonstrated in the UK Prospective Diabetes
Study 19 . The study group’s average blood pressure dropped from 154/87 to 144/82 over an 8
TP PT
year period, which had the following benefits:
32% reduction in deaths related to diabetes
44% reduction in strokes
34% reduction in diabetic retinopathy progression
47% reduction in visual loss
The US Veterans Affairs organisation looks after nearly 4 million people. They found 20 that TP PT
better control of diabetes among their 82,000 diabetic patients was associated not with direct
clinical care but with organisational characteristics such as:
integrating computerised health information systems into the care of persons with chronic
illness to produce reminders (in Northland this relates to Chronic Care Management annual
free checks)
developing multidisciplinary teams to address specific concerns (Healthy Eating, Healthy
Action, retinal screening)
actively involving physicians in quality improvement programmes (clinical governance,
accreditation, PHO performance programme)
giving primary care providers greater authority to implement clinical initiatives and develop
staffing arrangements
notifying patients of changes (patient-held care plans)
Kaiser Permanente 21 have identified the following additional features:
TP PT
attending more than 70% of clinic appointments
frequent self-monitoring of blood glucose
Clinics with all the good features and few or none of the bad ones obtained average reductions
of 2.0 to 2.5% in HbA1c levels more than clinics not having these characteristics. The UK
Prospective Diabetes Study 21 showed that a 1% reduction in HbA1c leads to a 21% reduction
P P
in risk of diabetes related complications and death, so the implications are considerable.
Data from Northland’s diabetes database has shown the benefits that could be gained from
one initiative, namely prescribing cholesterol-lowering drugs (statins) to all eligible people with
diabetes (Figure 10). This suggests that if, as recommended in the national guidelines, every
Northlander with diabetes who had a greater than 15% risk of having a cardiovascular event
(angina, heart attack or stroke) was prescribed a statin, then over the next 5 years, we could
prevent 30 heart attacks, 19 strokes and 20 deaths from cardiovascular disease. Other
interventions such as improving blood glucose control or becoming physically active may
produce even greater health gains.
19
TP PT UK Prospective Diabetes Study Group, 1998. Tight blood pressure control and risk of macrovascular
and microvascular complications in type 2 diabetes. BMJ; 317: 703-13. Available at
http://bmj.bmjjournals.com/content/vol317/issue7160/ .
TU UT
20
TP PT Jackson GL, 2005. Veterans Affairs primary care organisational characteristics associated with better
diabetic control. American Journal of Managed Care, 2005; 11: 225-237.
21
TP PT Karter A J, 2005. Achieving good glycaemic control. American Journal of Managed Care, 2005; 11:
262 –270.
The Northland Diabetes Strategy Page 17 of 67Figure 10. Reductions in cardiovascular morbidity and mortality from one intervention
Estimated number of events in Estimated number of events
5 years on present prescription avoided in 5 years if all
(including current statin people with CVD risk >15%
prescribing rates) are started on a statin
Coronary heart 448 46
disease (CHD)
Myocardial infarct 263 30
(heart attack) risk
CHD mortality 102 13
Cerebrovascular 163 19
accident (CVA, or
stroke)
Total cardiovascular 865 90
disease
CVD mortality 156 20
Retinal screening
Diabetes is the most common cause of avoidable loss of vision in people of working age. It
can be reliably detected by regular retinal screening, which involves a digital photograph being
taken of the retina and a visual acuity (eye test) check. Between 6% and 39% of people with
type 2 diabetes have retinopathy at diagnosis, with 4% to 8% having sight-threatening disease.
Retinal screening coverage (Figure 11) dropped between 2003 and 2004. Although it
recovered again in 2005, overall coverage for the total population is still below the MoH target
of 80%. Prevalence of retinopathy appears to be higher in Northland (20% total across all
ethnicities) than other District Health Boards (Waikato 9-10%, Lower Hutt 11-12%).
Figure 11. Northlanders with diabetes, by ethnicity, who have received retinal screening within
the past two years
100%
90% 85%
83%
80% 75% 73% 75%
72%
69% 69% 68% 67%
70% 67%
60%
54% Maori
Pacific
50%
Other
40% Total
30%
20%
10%
0%
2003 2004 2005
The Northland Diabetes Strategy Page 18 of 67Northland DHB undertook a review of retinal screening service provision during 2004/05, with a view to improving delivery of services and uptake of screening. The following areas for improvements were identified: database information and data capture protocols and standing orders within the clinic patient information and outpatient letters turn-around times between patient appointments and delivery of results clinic booking procedures, administration of the clinics and process through the system rates of DNAs (did not attends) at clinics camera transportation To gain the perspective of service users, a patient satisfaction survey was undertaken throughout Northland. Comments overall were positive. Results (total sample 112) included: 5 people said they hadn’t had opportunity to change their appointment 1 person said they hadn’t received enough notice of their appointment 3 said that their choice of venue was not convenient 11 patients waited longer than 20 minutes before being first seen 3 said they were not satisfied with the explanations given for the procedure all 28 people who received additional eye drops before screening were happy with the explanations given for the procedure 4 people said that the letters explaining their screening results were not satisfactory MoH recommends that retinal screening services should use screening cameras that are non- mydriatic (that is, avoid the need for eye drops to dilate pupils). Since Northland DHB purchased such a camera, patient satisfaction has improved, but not as much as anticipated because about two-thirds of patients still need eye drops. It is hoped that future process improvements will reduce this figure. The new system offers immediate views of the eye, a good teaching experience and user involvement, earlier cataract detection and fast tracking, and there has been no recall of any patients as a result of poor camera views, which did occur with the previous system. As a result of the review to the retinal screening service, the following changes have been undertaken or are in the process of occurring: all patients are telephoned prior to their appointment to confirm their attendance a process is occurring to ensure appropriate registration of the database new referral forms master tracking and audit sheets for clinics review of protocols, grading criteria, patient letters and information, turn-around times, process and flow charts in line with best practice guidelines clinic settings and community venues sought to improve access regular team meetings to review the continuing process Diabetes in the hospital setting Northland’s avoidable hospitalisation rate for diabetes (those who wouldn’t have to go to hospital if their condition had been managed well in the community) is nearly twice the national average. Maori rates are higher than non-Maori. Diabetes on its own is seldom a reason for admission to hospital. In 2004 Northland DHB needed 10,047 bed-days to treat people who had diabetes, though less than 1% of them were admitted because of the condition; the rest were admitted for other reasons, many of which were complications associated with diabetes. The disease has a big impact on other areas of health spending including: The Northland Diabetes Strategy Page 19 of 67
renal services
  amputations
  eye disease
  cardiovascular disease (heart attacks and strokes)
  pregnancy (large babies and difficulties in birthing, and diabetic imprinting on babies)
  intensive care services for with patients with undiagnosed diabetes

Northland’s age standardised rate of hospitalisation for diabetes of 133 per 100,000 is 1.7
times the overall New Zealand rate of 77 per 100,000 (Figure 12).

Figure 12. Hospitalisations for diabetes, age standardised rate/100,000, 1996-2000
      Area                  Number of             Rate per              SRR**         95% CI for
                               cases               100,000                                 SRR
      Northland                       952             133.3                  1.7        1.55-1.92
      NZ                         13,609                 77.3                 1.0                   -
      Data source: NMDS, Ministry of Health
      Medium series population projections based on 1996 Census data
      **SRR: standardised relative ratio, using NZ rate as the base,

Within this total population figure there is a bigger relative difference for Maori (1.9 times in
Northland) than for non-Maori (1.2 times) (Figure 13).

Figure 13. Hospitalisations for diabetes, age standardised rate/100,000 by ethnicity, 1996-
           2000
      Ethnicity /              Total           Average                 SRR**        95% CI for
      area              discharges,         annual rate                                  SRR
                          1996-2000         per 100,000
      Maori
       Northland                   532                 390                  1.9       1.68-2.15
       NZ                        2,967                 210                  1.0               -
      Non-Maori
       Northland                   420                   81                 1.2       1.01-1.35
       NZ                       10,642                   70                 1.0               -
      NMDS financial years, 1996-2000, Ministry of Health, medium series projected population, June years 1996-2000

Figure 14 shows diabetes-related admissions (which are graphed in Figure 15) and length of
stay, both of which have continued to increase steadily over the last 4 or 5 years. Admissions
have increased by 3.3 times from 726 to 2,376, while average length of stay (a measure of the
complexity or severity of patients’ conditions) has increased by nearly a quarter from 3.95 to
4.84 days.

Of the patients described by Figures 14 and 15:
  more than 25% of patients admitted with heart failure had a secondary diagnosis of diabetes
  amputation rates remain unchanged despite the increasing prevalence in diabetes, which
  may be due to the implementation of the at-risk foot clinic
  203 people were admitted to Northland DHB services with renal failure as a result of
  diabetes in the year ended 1 June 2002

The Northland Diabetes Strategy                             Page 20 of 67
You can also read


