VANUATU Ecosystem and Socio-economic - Resilience Analysis and Mapping - Griffith University
←
→
Page content transcription
If your browser does not render page correctly, please read the page content below
VANUATU   Ecosystem and Socio-economic
          Resilience Analysis and Mapping
SPREP Library Cataloguing-in-PublicaƟon Data

Mackey, Brendan … [et al.].

Vanuatu Ecosystem and Socio-economic Resilience Analysis and Mapping (ESRAM). Apia, Samoa: SPREP, 2017.
100 p. 29 cm.
ISBN: 978-982-04-0735-0 (print)
       978-982-04-736-7 (ecopy)
1. Ecosystem management – Tanna Island (Vanuatu). 2. Nature conservaƟon – Tanna Island (Vanuatu)
3. Tanna Island (Vanuatu) – Social condiƟons. 4. Tanna Island (Vanuatu) – Economic condiƟons
I. Ware, Daniel. II. Nalau, Johanna. III. Sahin, Oz. IV. Fleming, Christopher M. V. Smart, James C.R.
VI. Connolly, Rod. VII. Hallgren, Willow. VIII. Buckwell, Andrew. IX. PaciĮĐRegional
Environment Programme (SPREP). X. Series. XI. Title.

333.7 959 5

Copyright © Secretariat of the PaciĮĐRegional Environment Programme (SPREP), 2017.

ReproducƟon for educaƟonal or other non-commercial purposes is authorised without prior wriƩen permission from the
copyright holder provided that the source is fully acknowledged. ReproducƟon of this publicaƟon for resale or other
commercial purposes is prohibited without prior wriƩen consent of the copyright owner.

Cover photo: Stuart Chape

                                               PO Box 240, Apia, Samoa
                                               sprep@sprep.org, www.sprep.org

Our vision: The PaciĮc environment, sustaining our livelihoods and natural heritage in harmony with our cultures.

As part of SPREP's commitment to the environment, this item is printed on paper made from 100% recycled post-consumer
waste.

Acknowledgements
This report was prepared by Griĸth University under the PaciĮc Ecosystem-based AdaptaƟon to Climate Change Project
(PEBACC), a ĮǀĞ-year iniƟaƟve implemented by the Secretariat of the PaciĮĐ Regional Environment Programme (SPREP) in
partnership with the governments of Fiji, Solomon Islands and Vanuatu. The project is part of the InternaƟonal Climate IniƟaƟve
(IKI). The German Federal Ministry for the Environment, Nature ConservaƟon, Building and Nuclear Safety (BMUB) supports
this iniƟaƟve on the basis of a decision adopted by the German Bundestag. The Project focusses on strengthening and
protecƟng the role of natural ecosystem services to enhance resilience to climate change.
Authors: Brendan Mackey, Daniel Ware, Johanna Nalau, Oz Sahin, Christopher M Fleming, James C.R. Smart, Rod Connolly,
Willow Hallgren, Andrew Buckwell.
WƌŽũĞĐƚĐŽŽƌĚŝŶĂƟŽŶ͗ĂǀŝĚ>ŽƵďƐĞƌ͘

Griĸth University and SPREP are grateful for the assistance and wise guidance provided by Allan Dan, the SPREP Project Oĸcer
on Tanna, and also to the Tafea Provincial Government and the Tanna community leaders for their support, collaboraƟon and
sharing of local knowledge.
The Griĸth University team parƟcipaƟon was in part supported by their Ecoadapt PaciĮĐ project funded by a private charitable
trust.
Statement of limitaƟons
Available data used in the report may be limited in its precision and accuracy. Therefore any use of informaƟon from the report
will be based on an informed assessment of the limitaƟons of the data, informaƟon and methodologies described.

Note: Where no source of image is given, these are the authors’ own or are creaƟve commons licenced images freely available for reuse
from the web.
Table of Contents
1       Introduction ....................................................................................................................... 6
1.1        Background on Vanuatu and Tanna Island .............................................................................. 6
1.2        Structure of this Report ............................................................................................................ 8
1.3        Connecting ecosystem services with resilience ........................................................................ 8
1.3.1         Concepts .............................................................................................................................. 8
1.4           Ecosystem types ................................................................................................................ 11
1.5        Ecosystem assessment ........................................................................................................... 14
1.5.1         Terrestrial ecosystem condition assessment .................................................................... 15
1.5.2         Coral reef condition assessment ....................................................................................... 15
1.6        Tanna Island ecosystem types mapping ................................................................................ 16
1.7        Ecosystem service valuation .................................................................................................. 16
1.7.1         Valuation in the absence of local data: benefit transfer ................................................... 16
1.7.2         Relevant studies for benefit transfer................................................................................. 17
1.7.3         Our approach ..................................................................................................................... 19
2       Results of ecosystem service assessment and valuation .................................................... 23
2.1       National level ......................................................................................................................... 23
2.1.1        Ecosystem types and extent .............................................................................................. 23
2.1.2        Ecosystem condition .......................................................................................................... 23
2.1.3        Ecosystem valuation .......................................................................................................... 25
2.1.4        Analysis .............................................................................................................................. 28
2.1.5        Social and demographic data ............................................................................................ 29
2.2       Tanna ..................................................................................................................................... 31
2.2.1        Ecosystem types, extent & condition ................................................................................ 31
2.2.2        Ecosystem valuation .......................................................................................................... 33
2.2.3        Comparing Vanuatu and Tanna ......................................................................................... 37
2.3       Ecosystem service benefits discussion.................................................................................... 39
2.4       Gaps in information ............................................................................................................... 40
3       Drivers, enablers and barriers ........................................................................................... 42
3.1       National.................................................................................................................................. 42
3.2        Tanna Island…………………………………………………………………………………………………………………......43
3.3         Social and cultural considerations ......................................................................................... 43
3.4         Political considerations .......................................................................................................... 44
3.4.1         National ............................................................................................................................. 44
3.4.2         Tanna Island ....................................................................................................................... 45
3.5         EbA policy and institutional considerations ........................................................................... 45
3.5.1         Policies ............................................................................................................................... 45
3.5.2         Institutions at the national level........................................................................................ 49
3.5.3         Institutions at the Tanna Island level ................................................................................ 50
4       Climate change pressures ................................................................................................. 51
4.1        Increasing climate change pressures - National level ............................................................ 51
4.1.1         Temperature ...................................................................................................................... 51
4.1.2         Precipitation ...................................................................................................................... 51
4.1.3         Frequency of extreme events including cyclones. ............................................................ 52
4.1.4         Ocean temperature, chemistry and sea level rise ............................................................. 53
4.2        Climate change pressures - Tanna level ................................................................................. 53

ii            VANUATU ECOSYSTEM AND SOCIO-ECONOMIC RESILIENCE ANALYSIS AND MAPPING
5          Environmental change pressures ...................................................................................... 58
5.1          Population change ................................................................................................................. 58
5.2          Land use change..................................................................................................................... 58
5.3          Understanding the drivers of land use change ...................................................................... 60
5.4          Other threats to ecosystem services ...................................................................................... 63
5.5          Options and strategies for restoring ecosystem health ......................................................... 64
6          Risk assessment ............................................................................................................... 65
6.1           Introduction and approach .................................................................................................... 65
6.1.1            Risk context........................................................................................................................ 65
6.1.2            Risk identification .............................................................................................................. 65
6.1.3            Risk analysis ....................................................................................................................... 66
6.1.4            Risk evaluation ................................................................................................................... 66
6.2           Coral reef socio-ecological system ......................................................................................... 66
6.2.1            Risk context........................................................................................................................ 66
6.2.2            Risk identification………………………………………………………………………………………………………….68
6.2.3            Risk analysis ....................................................................................................................... 69
6.2.4            Risk evaluation ................................................................................................................... 71
6.3           Tropical kastom forest socio-ecological system ..................................................................... 71
6.3.1            Risk context........................................................................................................................ 71
6.3.2            Risk identification .............................................................................................................. 73
6.3.3            Risk analysis ....................................................................................................................... 74
6.3.4            Risk evaluation ................................................................................................................... 76
6.4           Scenario analysis .................................................................................................................... 76
6.5           Summary and conclusions ...................................................................................................... 79
References ................................................................................................................................... 81
Appendices .................................................................................................................................. 85
Appendix A. Ecosystem assessment methodology .................................................................................. 85
Appendix B. Description of ministry responsibilities................................................................................ 89
Appendix C. Pressure and risk mapping methods ................................................................................... 91

iii              VANUATU ECOSYSTEM AND SOCIO-ECONOMIC RESILIENCE ANALYSIS AND MAPPING
List of figures
Figure 1. The official provinces of the Republic of Vanuatu. Tanna Island (black box) is located in the
southern Tafea Province. .......................................................................................................................... 7
Figure 2. Relation between ecosystems and ecosystem service flows, as conceptualised by
Experimental Ecosystem Accounts (adapted from UN, 2015). ................................................................. 8
Figure 3. Categories of ecosystem services modified for the Melanesian context, adapted from the
Millennium Ecosystem Assessment Report (2005). .................................................................................. 9
Figure 4. A conceptual framework illustrating (in a high generalised way) the relationship between
ecosystem-based approaches, ecosystem services and community resilience...................................... 10
Figure 5. Proportion of ecosystem types for Vanuatu (%). ..................................................................... 24
Figure 6. Ecosystem condition in Vanuatu .............................................................................................. 24
Figure 7. Ecosystem service value delivery by ecosystem type. ............................................................. 28
Figure 8. Tanna ecosystems. For data source and methods see Appendix A. ........................................ 31
Figure 9. Ecosystem condition and land uses for Tanna ......................................................................... 32
Figure 10. Proportion of ecosystem types by area on Tanna (%). .......................................................... 32
Figure 11. Ecosystem service value delivery by ecosystem type for Tanna (%)...................................... 37
Figure 12. Comparison of contribution to ecosystem service benefits (%) for each ecosystem service
for Vanuatu and Tanna. ........................................................................................................................... 38
Figure 13. Comparison contribution to ecosystem service benefits (%) for ecosystem type for Vanuatu
and Tanna. ............................................................................................................................................... 38
Figure 14. Annual precipitation (mm) for Tanna for current climate and projected for year 2070. ...... 55
Figure 15. Annual mean daily temperature (degree Celsius) for Tanna for current climate and
projected for year 2070 ........................................................................................................................... 55
Figure 16. Mean monthly max temperature for Tanna for summer months for current climate and
projected for year 2070........................................................................................................................... 57
Figure 17. Mean monthly rainfall (mm) for Tanna for winter months for current climate and projected
for year 2070. .......................................................................................................................................... 56
Figure 19. Loss of ecosystems from expansion of subsistence farming.................................................. 59
Figure 20. Four indicators of pressure on the sustainability of Tanna's subsistence farming systems in
four categories of pressure. .................................................................................................................... 61
Figure 21. Influence diagram for the subsistence farming socio-ecological system in Tanna (adapted
from Blanco, et al., 2013). ....................................................................................................................... 62
Figure 22. Factors, influences and pressures on the coral reef socio-ecological system for Tanna. ...... 67
Figure 23. Fringing coral reef risk analysis showing four risk indicators mapped in four categories of
low to extreme. ....................................................................................................................................... 70
Figure 24. Influence diagram of the kastom forest socio-ecological system. ......................................... 72
Figure 25. Kastom forest socio-ecological system risk assessment mapped in four categories (low to
extreme). ................................................................................................................................................. 75
Figure 26. Scenarios of climate change and environment for Tanna...................................................... 77
Figure 27: Vanuatu shoreline population density. .................................................................................. 88

4                 VANUATU ECOSYSTEM AND SOCIO-ECONOMIC RESILIENCE ANALYSIS AND MAPPING
List of tables
Table 1. Vegetation types in Vanuatu (Source: Munzinger et al. 2006). ................................................ 11
Table 2 Categories of ecosystems used in the Vanuatu ecosystem assessment. ................................... 12
Table 3. Categories of vegetation condition. Source: Adapted from Thackway and Lesslie (2006) and
Schwetter (2012) ..................................................................................................................................... 15
Table 4. Valuation approach and value per hectare per year for each ecosystem type......................... 20
Table 5. Monetary values employed for ecosystem service flows per ecosystem (2015 Vatu per ha per
year)......................................................................................................................................................... 21
Table 6. Total area of different ecosystem types for Vanuatu. .............................................................. 23
Table 7. Ecosystem Condition in Vanuatu ............................................................................................... 25
Table 8. National scale estimate of annual monetary value of ecosystem service flows per ecosystem
service type (million Vatu per ha per yr / USD per ha per year). ............................................................ 26
Table 9. Proportion of households reliant on provisioning ecosystem services by province (Source:
Vanuatu National Census, 2009). ............................................................................................................ 30
Table 10. Proportion of households with tenure over livestock by province. ........................................ 30
Table 11. Examples of ecosystem services used by Tanna local communities. ...................................... 33
Table 12. Estimate of the annual monetary value of ecosystem service flows per ecosystem type for
Tanna (2015 million Vatu/USD)............................................................................................................... 35
Table 13. National policies in Vanuatu that are potentially relevant to EbA and the extent to which
they acknowledge the importance and relevance of climate change, the role of ecosystems and
ecosystem-based adaptation. ................................................................................................................. 47
Table 14. Vanuatu national level ministries (as of June 2017). ............................................................... 49
Table 15. Current and projected population for Vanuatu and Tanna..................................................... 58
Table 16. Ecosystems converted to subsistence gardening between 2011 and 2016............................ 59
Table 17. Projecting Tanna Island land use change. ............................................................................... 59
Table 18. Threats to Tanna ecosystem services. ..................................................................................... 63
Table 19. Indicators for Ecosystem based Adaptation. ........................................................................... 64
Table 20. Summary of risk identification for the fringing coral reef socio-ecological system for Tanna.68
Table 21 Summary of Risk identification for the Kastom forest socio-ecological system ...................... 78
Table 22 Implications of scenarios for ecosystems and communities .................................................... 78
Table 23: Use of vegetation map classification by ESRAM outputs. ....................................................... 85
Table 24: Sources for coastal ecosystem type and extent. ..................................................................... 86
Table 25: Coral reef condition assessment classification ........................................................................ 87

5                  VANUATU ECOSYSTEM AND SOCIO-ECONOMIC RESILIENCE ANALYSIS AND MAPPING

1 Introduction                                                important ecosystem/land use types: coral
                                                              reefs, kastom forest, and subsistence
Approaches to planning and decision-making that               gardens).
use Ecosystem-based Adaptation (EbA) and                The information provided in this report will be used
resilience-thinking     provide     a    significant    to inform the identification, costing and
opportunity for small island developing states,         prioritisation of EbA options for adaptation
such as Vanuatu, to deal with climate change            planning and will feed into site-specific EbA
threats while addressing other sustainable              implementation plans. Based on these plans, the
development goals. The Pacific Ecosystem-based          PEBACC project will support a number of
Adaptation to Climate Change (PEBACC) project,          demonstration EbA activities at project sites.
led by the Secretariat of the Regional Environment
Programme (SPREP), aims to build capacity for           1.1    Background on Vanuatu and
developing and implementing EbA and resilience                 Tanna Island
projects within Vanuatu and the Pacific region.         Vanuatu is a country located in the South-western
Funded by the German Government and                     Pacific Ocean, about 1,750 kilometres east of
implemented by SPREP, the project investigates          Australia and 500 kilometres north-east of New
and promotes ecosystem-based options for                Caledonia. It is a Y-shaped archipelago of volcanic
adapting to climate change impacts. The overall         origin, comprised of approximately 83 islands (65
intended outcome of PEBACC is for EbA to be             of them inhabited). Vanuatu covers a total area of
integrated into development, climate change             approximately 1.4 million hectares and its coastline
adaptation and natural resource management              is 2,528 km long and is mostly is rocky, with fringing
policy and planning processes in three Pacific island   reefs and no continental shelf. Most of the islands
countries (Vanuatu, Fiji, and Solomon Islands),         are steep, with unstable soils and little permanent
while providing replicable models for other             fresh water (Government of Vanuatu 2016; Peace
countries in the region.
                                                        Corps 2013).
Ecosystem and Socio-economic Resilience Analysis        Vanuatu has long been regarded as one of the most
and Mapping (ESRAM) is the first stage of PEBACC.       vulnerable countries in the world due to the
This report presents the results of the ESRAM           occurrence of multiple natural hazards, including
undertaken by Griffith University for the Republic      cyclones, earthquakes, and tsunamis, together
of Vanuatu (hereafter ‘Vanuatu’) and Tanna Island       with underlying societal vulnerabilities (World Risk
(heareafter ‘Tanna’).                                   Report 2015). The majority of Vanuatu’s
The report addressed three main tasks:                  population relies on subsistence farming for their
    1. the mapping of key ecosystems for Vanuatu        livelihood, with 75% of the population living in rural
       and Tanna in terms of their type, condition      areas (Malvatumauri 2012). High population
       and the ecosystem services they potentially      concentration in rural areas is typical of
       generate;                                        Melanesian countries and often poses challenges
    2. an economic evaluation of the benefits to        for service delivery and disaster recovery
       local communities arising from these             (Wickham et al. 2009). These characteristics have
       ecosystem services; and                          consequences for food security, climate adaptation
    3. an assessment of the risk to community
                                                        and disaster risk reduction strategies (Republic of
       sustainability from threats and pressures on
                                                        Vanuatu 2015).
       ecosystem health, including climate change-
       related hazards, for three of the most

6             VANUATU ECOSYSTEM AND SOCIO-ECONOMIC RESILIENCE ANALYSIS AND MAPPING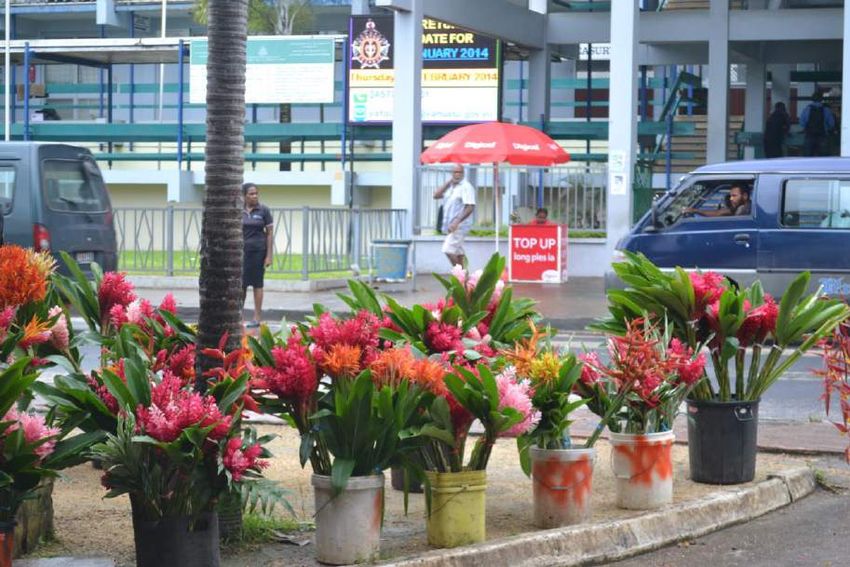
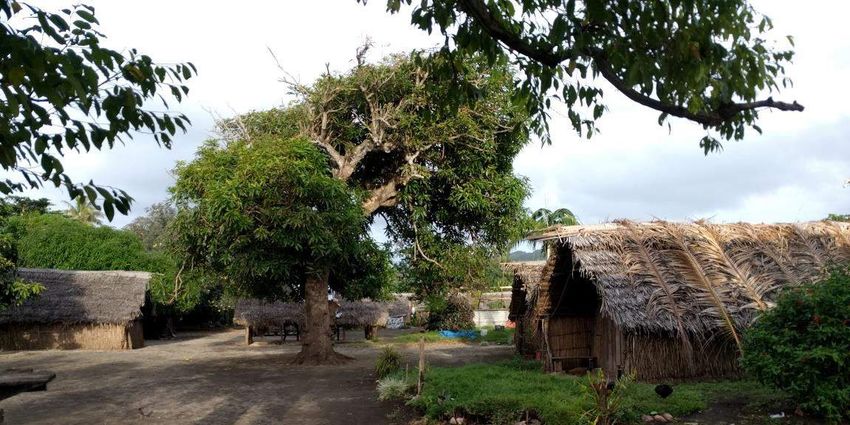
In Vanuatu, small-scale subsistence farming is         spoken on Tanna, with some people also speaking
undertaken by 98% of the rural population. These       Bislama, one of the official languages of Vanuatu.
farming systems now typically comprise three           Many of the tribes on Tanna live in traditional
components: (1) a shifting cultivation system; (2) a   housing and have a long history of coping with
perennial plantation cultivation system; and (3) a     cyclones.
forest and arboricultural system (Blanco et al.        Tanna is often referred to as the stronghold of
2013; Clarke and Thaman 1993). In the shifting         kastom; a place where people still know traditional
cultivation component (i.e. that based on              songs, can trace their lineage, and still participate
traditional subsistence gardening), each family        and organise kastom rituals and ceremonies
slashes and burns secondary forest in two to five      (Lindstrom 2011). Tanna is regarded as an example
locations per year to grow taro or yam. Large trees    of how kastom and modernity coexist hand in hand
are often left for their economic or cultural use.     (Lindstrom 1982).
Then, having depleted the plots’ soil fertility, the
family leaves them fallow, allowing for secondary
forest re-growth, before returning to start the
cycle again. The perennial cultivation system
constitutes the main source of cash income for
families and in Vanuatu can involve growing
coconut, cacao, coffee or sandalwood. The
traditional shifting cultivation crops of taro and
yam are being supplemented with more recently
introduced crops, especially peanuts and sweet
potato. Traditional wealth items, such as kava,
pigs, mats and yams, are particularly important in
Vanuatu in terms of traditional ceremonies and
form a part of the informal economy
(Malvatumauri 2012).
Administratively, Vanuatu is organised into six
provinces, comprising a total of 83 islands (Figure
1). The provinces from the largest to smallest are:
Sanma, Malampa, Tafea, Shefa, Penama and
Torba. Tanna is in the southern province of Tafea
(black box in Figure 1) and covers an area of 58,793
hectares. According to the latest population
census, in 2016 there were 32,280 people living on
Tanna (Vanuatu National Statistics Office, 2016).
However, the current number is likely higher, given
rapid population growth. For example, during           Figure 1. The official provinces of the Republic of
government disaster recovery and food relief           Vanuatu. Tanna Island (black box) is located in the
operations after 2015 Tropical Cyclone Pam,            southern Tafea Province
44,000 people were reported as residing on the
Island. Seven different indigenous languages are

7           VANUATU ECOSYSTEM AND SOCIO-ECONOMIC RESILIENCE ANALYSIS AND MAPPING
and Tanna by the year 2070. Chapter 5 presents
1.2 Structure of this report                           the results of the risk assessment.
This report is structured as follows: The remainder
of Section 1 outlines the conceptual frameworks,       1.3 Connecting ecosystem services
approaches and data sources adopted for: (a)               with resilience
mapping of key ecosystems for Vanuatu and
Tanna, in terms of their type, condition and the       1.3.1 Concepts
ecosystem services they generate; (b) an economic
                                                       In implementing ESRAM we draw upon the
evaluation of the benefits flowing to local
                                                       conceptual framework developed by the UN
communities arising from these ecosystem
                                                       Statistical Commission’s Experimental Ecosystem
services; and (c) an assessment of the risk to
                                                       Accounting system (EU 2013; ABS 2012), which
community sustainability from threats and
                                                       describes ecosystem accounting as a coherent and
pressures on ecosystem condition, including
                                                       integrated approach to the assessment of the
climate change-related hazards, for three of the
                                                       environment through the measurement of
most important ecosystem/landuse types (coral
                                                       ecosystems and the flows of services from
reefs, kastom forest, and subsistence gardens).
                                                       ecosystems into economic and other human
Section 2 presents the results of the economic
                                                       activity (Figure 2).
evaluation of the flow of ecosystem service
benefits at a national level for all of Vanuatu and    The commission adopts a standard definition of
then for Tanna. Section 3 discusses the drivers,       ecosystems as ‘… a dynamic complex of plant,
barriers, and enablers of ecosystem-based              animal and micro-organism communities and their
adaptation, again at the national level and for        non-living environment interacting as a functional
Tanna. Chapter 4 presents a preliminary analysis of    unit.’ The commission notes that the scale of
how climate is projected to change for Vanuatu         ecosystem accounting may vary for specific land

      Figure 2. Relationship between ecosystems and ecosystem service flows, as conceptualised
      by Experimental Ecosystem Accounts (adapted from UN 2015)

8           VANUATU ECOSYSTEM AND SOCIO-ECONOMIC RESILIENCE ANALYSIS AND MAPPING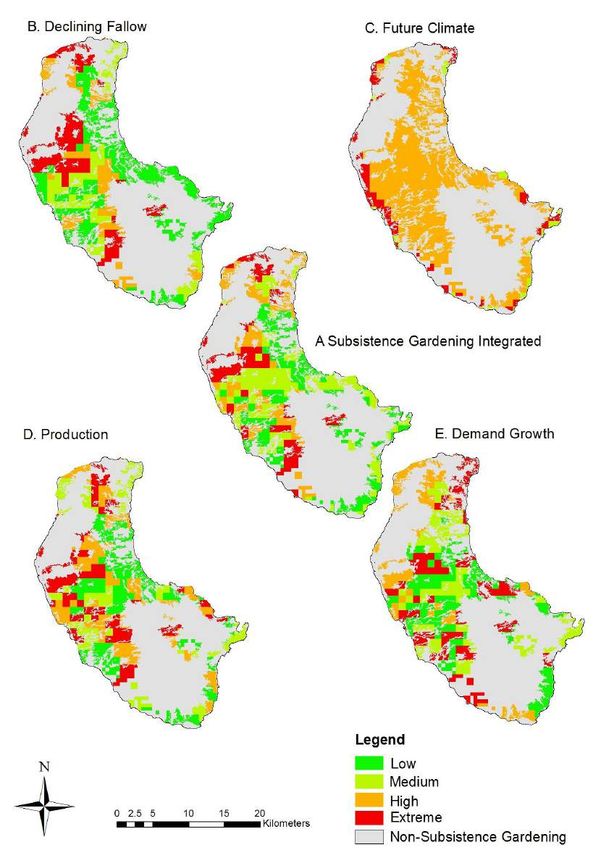
cover types, such as forests, to larger integrated       time, an estimated stock of expected ecosystem
areas, such as river basins, and can include areas       service flows (EU 2013).
that may be considered relatively natural and            Ecosystem services do not result only from the
those that may be heavily influenced by human            harvesting or extraction of materials from
activity, such as agricultural areas. According to the   ecosystems. They also result from the general
commission’s system, ecosystem accounting goes           functioning of the ecosystem (e.g. air filtration
beyond other approaches to ecosystem analysis            services from trees providing clean air) and extend
and assessment through the explicit linking of           to other characteristics of an ecosystem (e.g. the
ecosystems to economic and other human activity.         physical structure and composition of mountain
The links are seen both in terms of the services         landscapes providing scenic views). Thus, the term
provided by ecosystems and also in the impacts           ‘services’ is used here in an all-encompassing
that economic and other human activity may have          manner, covering the various ways in which
on ecosystems and their future capacity to               humans may benefit from ecosystems (EU 2013).
continue to deliver ecosystem service flows.
                                                         Categories of ecosystem services are summarised
A key term the commission introduces is                  in Figure 3, based on the system developed by the
‘ecosystem assets’, defined as spatial areas             Millennium Assessment Report (2005). However,
containing a combination of biotic and abiotic           we have modified their system to better reflect the
components and other characteristics that                Melanesian context by recognising two new
function together. Ecosystem assets are measured         categories: (1) ‘non-extractive use services’, which
in terms of: (i) ecosystem type; (ii) ecosystem          includes recreation and tourism, education and
extent; (iii) ecosystem condition; and (iv)              research; and (2) ‘kastom services’, which includes
ecosystem services. A particular combination or          customary and spiritual practices, among other
‘basket’ of ecosystem services can be generated at       things.
a particular point in time from a specific ecosystem
                                                         The IPCC (2014) defines resilience as the ‘capacity
asset. The aggregation of all future ecosystem
                                                         of social, economic, and environmental systems to
services for a given basket provides, at a point in
                                                         cope with a hazardous event or trend or

Figure 3. Categories of ecosystem services modified for the Melanesian context, adapted from the
Millennium Ecosystem Assessment Report (2005)

9           VANUATU ECOSYSTEM AND SOCIO-ECONOMIC RESILIENCE ANALYSIS AND MAPPING
disturbance, responding or reorganising in ways supporting biophysical environments, with the that maintain their essential function, identity, and latter typically defined in terms of ecosystems structure’. A system, or one of its components, can (Constanza et al, 1993; Berkes and Folke 1998). be more or less resilient with respect to a given Socio-ecological system thinking is consistent with ‘shock’. the conceptual frameworks of the UN Statistics However, being resilient can in some instances be Commission and the Millennium Ecosystem counterproductive. For example, if the context Assessment. within which the system operates changes In a Melanesian context it makes sense to identify significantly, it is not necessarily beneficial for a community resilience as the focal point of analysis, system to remain in (or return to) its original state with resilience being enhanced by ongoing access (Nalau and Handmer 2015). Therefore, part of a to ecosystem service benefits (Figure 4). The resilience-thinking approach is to consider the quality of these services in turn is a function of the transformability of a system – the capacity to condition of the ecosystem; with degraded create a fundamentally new system when ecosystems providing lower benefit flows (or none ecological, economic, or social (including political) at all). There are pressures arising from both conditions make the existing system untenable natural processes and human activities that can (Walker et al. 2004). It follows that application of degrade ecosystem condition, including climate EbA approaches require consideration of the change and the impacts of inappropriate capital capacity of a system for self-stabilisation, works. In Vanuatu (and the Pacific generally) a adaptation or transformation, depending on the major pressure on ecosystem condition is from circumstances. rising human populations and the increased Central to EbA and resilience is the concept of demand for subsistence food. These impacts can ‘socio-ecological systems’, where the focus of be addressed through appropriate governance study are systems defined in terms of closely arrangements, such as land use planning. As coupled human societies, together with the discussed further below, in Vanuatu these will Figure 4. A conceptual framework illustrating (in a highly generalised way) the relationship between ecosystem-based approaches, ecosystem services and community resilience 10 VANUATU ECOSYSTEM AND SOCIO-ECONOMIC RESILIENCE ANALYSIS AND MAPPING
involve both formal policy, planning and Table 1. Vegetation types in Vanuatu (Source:
management interventions for adaptation and Munzinger et al. 2006)
sustainable development, along with customary
1. Lowland rain forest
land and sea use and management.
a. High stature forest on old volcanic soil
In terms of policy and programmatic interventions,
options are needed that enhance community b. Medium stature forest heavily covered
resilience through EbA approaches, such as: with lianas
avoiding or reducing activities that degrade c. Complex forest scrub densely covered
ecosystems through, for example, over-use or with lianas
pollution; restoring ecosystem condition through d. Alluvial and floodplain forest
ecological restoration of degraded forests and
coral reefs; providing appropriate technologies e. Agathis-Calophyllum forest
that reduce environmental waste, such as solar f. Mixed species forest without
power systems in place of diesel generators; or by gymnosperms and Calophylum
establishing community conservation areas. In 2. Montane cloud forest and related
these ways, the condition of ecosystems can be vegetation
maintained or improved and communities can
3. Seasonal forest, scrub and grassland
continue to benefit from the flow of ecosystem
services. a. Semi-deciduous transition forest
1.4 Ecosystem types b. Acacia spirorbis forest
While terrestrial ecosystems can be identified c. Leucaena thicket, savanna and grassland
and mapped using various criteria, from a
4. Vegetation on new volcanic soil
practical perspective (and in a Melanesia
5. Coastal vegetation including
context) they have been defined here according
mangroves
to the major vegetation types that have been
6. Secondary and cultivated woody
recognised by biodiversity and forest surveys. In vegetation
addition, we recognised the general coastal
ecosystem categories of coral reefs (particularly
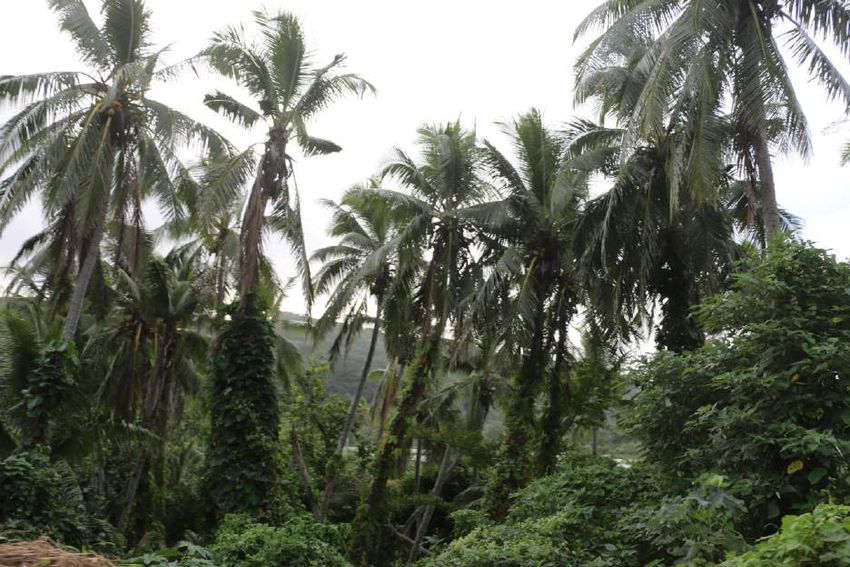
fringing reefs), mangroves, and sea grass. At the 1.4.1 Tropical forest
national level, Table 1 lists the main vegetation A comprehensive overview of Vanuatu’s tropical
types that have been recognised in Vanuatu. forests is given in Rhind (2010). Vanuatu supports
However, the only national mapping available three main forest ecosystem types: lowland
for terrestrial ecosystems was a vegetation map tropical rainforest, montane cloud forest, and
published by the Vanuatu Forestry Department Acacia spirorbis forest.
(Schwetter 2012); the categories for which are Up to about 600 m altitude, lowland rain forest is
listed in Table 2. For coastal marine ecosystems the natural vegetation on the south eastern,
we were able to use GIS data layers generated windward sides of all Vanuatu islands, referred to
from global inventories of coral reef and sea as mixed lowland rainforest. On old volcanic ash,
grass GIS data layers (See also Table 2). rich in plant nutrients, trees can reach more than
30 m in height, with large crowns.
11 VANUATU ECOSYSTEM AND SOCIO-ECONOMIC RESILIENCE ANALYSIS AND MAPPINGImportant trees are Antiaris toxicaria, Pipturus and Vaccinium can also be found in these
Castanospermum australe, Intsia bijuga and treeless, herbaceous zones. Acacia spirorbis forests
Kleinhovia hospitat. are known locally and this open formation can be
found on various islands, including Anatom and
Montane cloud forests range from about 500 -
Erromango. The trees usually have a low to
1000 m in altitude. They are all characterised by
medium stature, growing to a maximum of about
stunted, gnarled trees, covered in bryophytes and
15 m, and typically have wide-branching crowns.
filmy ferns. The main tree genera are Ascarina,
Dominant among undergrowth shrubs are Croton,
Geissois, Metrosideros, Quintinia, Syzygium and
Symplocos and Xylosma. In canopy openings,
Weinmannia. In addition, tree ferns of Cyathea and
heliophytic grasses predominate. These include
Dicksonia are locally common, together with
various other large ferns. Many of the tree crowns Miscanthus floridulus in moist areas and
are covered with epiphytic orchids, particularly Heteropogon contortus in the dryer areas.
species of Dendrobium, and ferns. Astelia
(Liliaceae) is another conspicuous epiphyte. Lianas, Vanuatu’s forests have been subjected to a long
on the other hand, are less numerous but include history of human use, including for non-timber
the pandanaceous climber products, customary practices, fuel wood and,
Freycinetia. Scattered among the trees are various more recently, industrial logging. Here we drew
herbaceous patches with plants such as large upon the in-depth account provided by Regenvanu
leaved Gunnera, the grass Isachne and the sedge et al. (1997). Vanuatu’s first commercial tree
Machaerina. Shrubs such as Eurya, Gaultheria, harvest began in 1825, with the cutting of
Table 2. Categories of ecosystems used in the Vanuatu ecosystem assessment
Ecosystem type 1. Data source
Tropical forest – medium 2012 Vanuatu Vegetation Map
Tropical forest – low 2012 Vanuatu Vegetation Map
Tropical forest – thicket 2012 Vanuatu Vegetation Map
Tropical forest – shrub 2012 Vanuatu Vegetation Map
Plantation cropping 2012 Vanuatu Vegetation Map
Bare soil 2012 Vanuatu Vegetation Map
Built-up 2012 Vanuatu Vegetation Map
Freshwater wetlands 2012 Vanuatu Vegetation Map
Freshwater water bodies 2012 Vanuatu Vegetation Map
Coastal – mangroves 2012 Vanuatu Vegetation Map
Coastal – seagrass 2005 Global Distribution of Seagrass UNEP World Conservation
Monitoring Centre – Marine metadata catalogue
2010 Global Distribution of Coral Reefs UNEP World Conservation
Coastal – coral reef
Monitoring Centre – Marine metadata catalogue
12 VANUATU ECOSYSTEM AND SOCIO-ECONOMIC RESILIENCE ANALYSIS AND MAPPINGsandalwood (Santalum austro-caledonicum) for Carpet (Axonopus compressus) and T grass
(Paspalum conjugatum) in combination with native
export to China. This collapsed after 40 years and
legumes, which are the major grazing resource. Of
subsequently the commercial use of the forest
next significance is buffalo grass (Stenotaphrum
ecosystems expanded with the logging and sawing
secundatum) pastures under old, moderately
of trees for timber. As discussed further below, the shaded plantation coconuts. Heavily shaded
principal form of subsistence farming involved native grass, and to a minor extent buffalo
rotating the use of plots with the length of the grass pastures, under dense coconuts and
fallow period, and thus the length of vegetation bush comprise an estimated 25 - 30% of the
regeneration, varying with soil fertility, suitability total grazed area. The principal native grasses
for cultivation, and population density. In pre- are carpet grass and T grass, while some
consider buffalo grass to have become
European times, those areas of Vanuatu allocated
naturalised (Macfarlane and Shelton 1986).
for such cultivation would have been dominated by
The impacts of introduced grassland species,
secondary forest, often in quite mature tree including elephant grass (Panicurn purpureum)
stands. have also been noted (Department of Environment
1999).
In addition to the subsistence agriculture and
arboriculture, a conservation-oriented use of trees
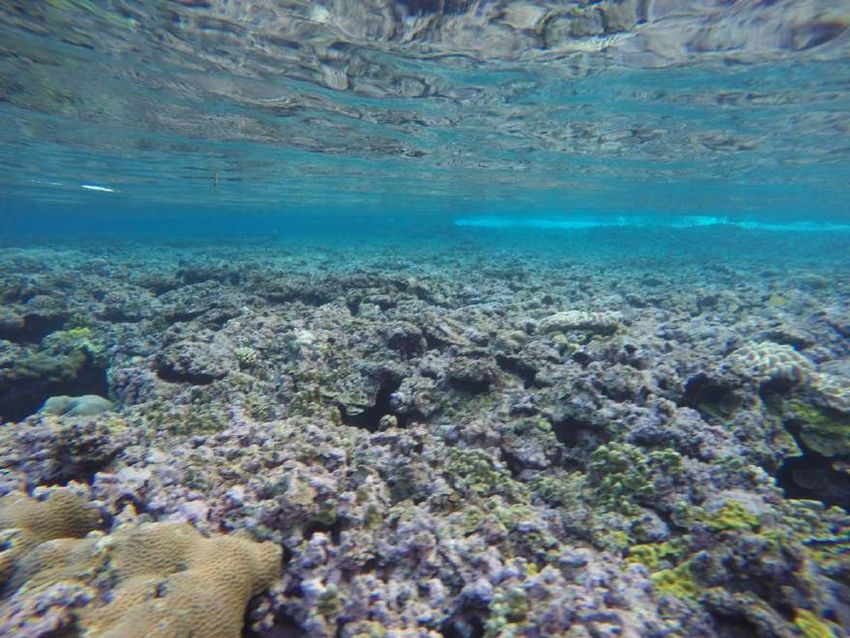
1.4.3 Coral reefs, mangroves and sea
and forest areas was also ensured by other
grass
traditional customs. As Regenvanu and colleagues
Vanuatu's 200 nautical mile exclusive economic
(1997) noted: ‘… the traditional landscape was
zone is extensive and encompasses mangrove, sea
replete with places or sites that were ‘tabu’ (taboo)
grass, lagoon, coral and pelagic habitats.
meaning that access to them—either physically or Consequently, coastal and marine biodiversity are
through oral narrative—was restricted in some important national considerations (Department of
way. In many cases the taboo meant that the area Environment, 1999). The coral reefs of Vanuatu are
immediately surrounding a site was off-limits to described by Naviti and Aston (2000) and Done and
Navin (1990). There are, however, relatively few
almost everyone and, in a few cases, everyone. As
extensive shallow-water reefs surrounding the 80
a result, such sites would appear (and still do) as
high islands in the Vanuatu archipelago. Inner reef
wooded groves, some of considerable size, within areas are limited to narrow fringing reefs and reef
an environment of secondary forest. Oral platforms surrounding islands and a few lagoons
traditions indicate that large tracts of the and barrier reefs, totalling an area of
landscape may have been declared off-limits at approximately 70,000 hectares. Exposed coral reef
slopes and crests are dominated by coralline algae
different times by such customs, effectively
and robust plating and branching corals (Acropora
creating reserved areas.’
and Pocilloporidae), changing to dominance of a
mix of massive and branching corals three to five
1.4.2 Grassland metres below the level of the reef flat. Sheltered
The extensive areas of grassland occur in Vanutatu parts of the outer reef are characterised by various
can be largely attributed to clearing of natural species of Acropora and Montipora. Massive
vegetation cover and pasture establishment for Porites are prevalent in open embayments, while
beef production. Major pasture types include sheltered embayments are strongly dominated by
13 VANUATU ECOSYSTEM AND SOCIO-ECONOMIC RESILIENCE ANALYSIS AND MAPPINGsoft corals. It has been postulated that the have also been recorded in these inhospitable
colonisation of coral reefs in Vanuatu is assisted by areas, including species of Spathoglottis, while on
a dispersal pathway through Solomon Islands to the volcanic ash of Erromango the endemic orchid
the Great Barrier Reef in Australia. Trichochilus neoebudidus (Orchidaceae) can be
found.
1.4.4 Freshwater wetlands and
freshwater bodies 1.5 Ecosystem assessment
In Vanuatu, freshwater ecosystems are scattered, In a general sense, ecosystem assessment involves
Iocalised and small in extent. (Department of gathering information regarding the location,
Environment 1999), and little information is extent and condition of ecosystems in a format
available on their location and condition. suitable for informing decision-making. As
suggested in Figure 4, the quality of the flow of
ecosystem service benefits is a function of the
1.4.5 Thickets and shrublands
condition of the ecosystem; that is, the degree to
This ecosystem type covers a range of vegetation which it has been degraded by human pressures
types and conditions from cleared or degraded
and the impacts of a rapidly changing climate.
tropical forests through to natural vegetation
Ecosystems across Vanuatu are under pressure
communities. For example, as described by Rhind
from multiple sources, including climate change
(2010), on the lava fields of Yasur Volcano on
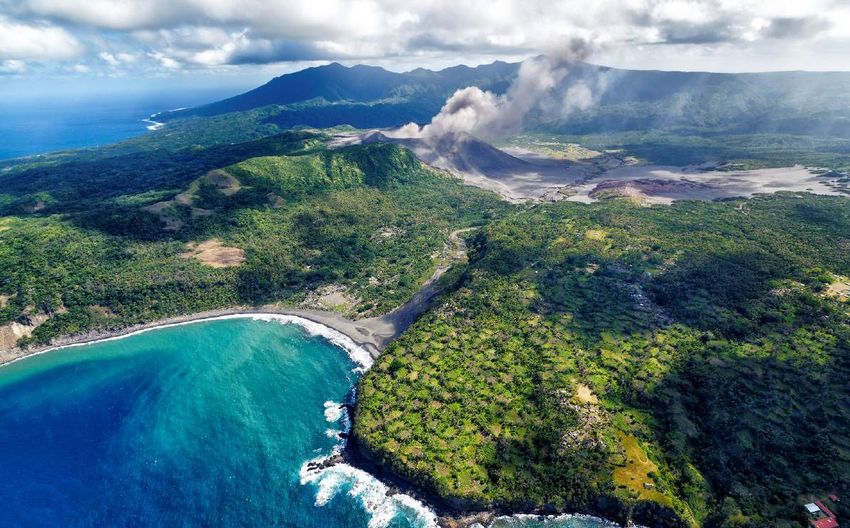
impacts and increasing demand for natural
Tanna, the ferns Histiopteris incisa, Nephrolepis
resources from population growth and economic
hirsutula and Cyathea species are widely, but
development. Ecosystem assessments were
sparsely, distributed, but a completely different
conducted at both the national (Vanuatu) and
flora occurs on the disturbed cinder cones. Here
the dominant species include shrubs such as island (Tanna) scales. At each scale, the assessment
Melastoma denticulatum, Piper latifolium and involved establishing the type, location, extent and
The proportional
conditioncontribution of ecosystem
of ecosystems. Further details onthethe
total values f
Pipturus argenteus, the grasses Imperata
type on Tanna to totalassessment
ecosystem ecosystem service value are provided
methodology demonstrates that
cylindrical and Miscanthus floridulus,and the
is shown ininFigure 11.
the Appendices. Tanna communitie
annual herb Emilia sochifolia. Surprisingly, orchids
Ecosystem service valuations for Tanna (Table their high depend
11, Figure 11) indicate that 99% of Tanna’s benefits from the
ecosystem service value is generated from two Both derive betwe
ecosystem types,ANALYSIS
coastal AND
coralMAPPING
(80.7%) and ecosystem service
14 VANUATU ECOSYSTEM AND SOCIO-ECONOMIC RESILIENCE
subsistence gardens (17.9%). reefs and tropical1.5.1 Terrestrial ecosystem condition condition is still developing, for coral reefs it is now
widely accepted that there is a negative
assessment
relationship between ecosystem condition and
The vegetation classification and map of Schwetter
proximity to human populations. The deleterious
(2012) reflects a combination of vegetation type,
effects of humans on coral reefs are largely a result
vegetation condition and land use. We
of land-based pollution and the cascading trophic
Table 3. Categories of vegetation condition. Source: Adapted from Thackway and Lesslie (2006) and
Schwetter (2012)
Category 0 I II 2. III 3. IV 4. V VI
Description Naturally Intact Modified Transformed Replaced by Replaced Removed
bare largely (highly invasive by crops
unmodi- modified) species
fied
Example Volcano Primary Commer- Traditional Lantana Coconut Airport
forest cially subsistence infestation plantations
logged farming
native
forest
endeavoured to separate out these variables by effects of harvesting fish, invertebrates and turtles
producing two separate GIS data layers of: (i) (McClanahan et al. 2011).
ecosystem type; and (ii) ecosystem condition. The results from field studies have highlighted the
For condition of the terrestrial ecosystems we used importance of several potential indicators relating
a modified version of the Vegetation Assets, States human proximity to reef condition, including
and Transitions (VAST) method developed by coastal population density, socio-economic status
Thackway and Lesslie (2006). The primary source of of populations, distance from population, and
information on ecosystem condition was the travel time from population centres to reefs
Schwetter (2012) vegetation map, which provides (Brewer et al. 2013; Cinner et al. 2013; and Maire
an assessment of areas of forest and thicket et al. 2016). Where fishing is for profit (rather than
considered as degraded or intact (Table 3). subsistence), distance to market is another
measure that can be used to predict reef condition
1.5.2 Coral reef condition assessment (Brewer et al. 2013).
The condition of coral reefs was modelled based on It should be noted, however, that one recent global
an empirically established relationship between analysis could not find a predictive relationship
reef condition and the density of human between human populations and reef condition
populations in the coastal zone. This strategy for (Bruno and Valdivia, 2016). The authors suggest
estimating ecosystem condition via a metric based two principal reasons for the apparent lack of a
on available data is particularly relevant for marine clear relationship: (1) the different intensities of
habitats, as costs preclude broad scale direct fishing practices in different locations, from small-
scale subsistence fishing to large-scale,
Vanuatu andassessments
Tanna. It and remote sensing techniques
cannot and
at this stage estimate condition reliably. industrialised harvesting; and (2) natural variation
nuatu (nationally)
While to some in measures of coral reef health among different
re broadly the same in extent the science underpinning the
use service
of proxy metrics to indicate ecosystem biogeographic provinces. In Vanuatu, however, we
e on ecosystem
ge of ecosystem types.
97% and 99% of their
nefit from coastal coral
15 VANUATU ECOSYSTEM AND SOCIO-ECONOMIC RESILIENCE ANALYSIS AND MAPPING
ests and approximatelyconsider the use of a human proxy to be valid, as surface hydrology attributes, including water
the range of fishing practices is narrower than that catchments, which provide a useful spatial unit of
occurring globally and reefs are all in the same analyses for some of the indicators used for the risk
biogeographic region. assessment detailed in section 5.
For Vanuatu, we were able to access reliable, 1.7 Ecosystem service valuation
spatially-explicit data on human populations from
Although the importance of ecosystems to human
national census surveys. For the entire coastline of
society has many dimensions (ecological, socio-
the country we calculated population density
cultural and economic), expressing the value of
(persons per km2) in a 1-km wide strip, based on 10
ecosystem services in terms of monetary units is an
km grid cells and categorised into three levels of important tool to raise awareness and convey the
impacts following the principles in Table 3. relative importance of ecosystems and biodiversity
However, note that for coastal assessments the to policy makers. ‘Money talks’, it is said, and
‘Transformed’ category in Table 3 typically information on monetary values can be effectively
represents a higher level of impact on condition used as a tool to strengthen the argument for
than ‘Modified’, but does not imply that an allocating resources towards ecosystem
alternative habitat has resulted. conservation or repair. Valuation also enables
more efficient use of limited funds by identifying
where ecosystem protection and restoration is
1.6 Tanna Island ecosystem types economically most important and can be provided
mapping at lowest cost. Several different techniques for
valuing ecosystem services in monetary terms are
Our ecosystem assessment for Tanna drew on the
now well established in the literature.
national level vegetation data, complemented by
satellite image classification, field survey
observations, and digital terrain analysis. We 1.7.1 Valuation in the absence of local
employed the same terrestrial ecosystem classes data: benefit transfer
developed for the national assessment (Table 1). There was not sufficient time and resources to
However, we remapped the extent of the conduct primary research into the valuation of
ecosystems using a new land cover map for Tanna, ecosystem services specifically for Vanuatu, or
based on a high-resolution mosaic of RapidEye Tanna. Given this, a ‘benefit transfer’ approach was
satellite imagery compiled by the Griffith employed, which is a method of estimating the
University team. The most recent cloud-free value of an environmental good or service at a
images were used, noting that, due to continuous target site, using information from an existing
volcanic activity, the Island is rarely, if ever, cloud study (or studies) conducted at another source site.
free. The RapidEye mosaic was classified using the
segmentation approach in Terrset (2016) and
calibrated using a combination of the vegetation
map and field survey observations. The UNEP coral
reef layer was also used for Tanna and cross-
validated with a near-coastal marine classification
of the RapidEye mosaic.
A 30 m resolution Aster-derived Digital Elevation
Model was also used to model key topographic and
16 VANUATU ECOSYSTEM AND SOCIO-ECONOMIC RESILIENCE ANALYSIS AND MAPPINGIn practice, benefit transfer typically involves Valuation Database (Ecosystem Services
searching the relevant empirical literature to Partnership, 2016). Of the assessed studies, only
identify existing studies that value goods or three relate directly to the Pacific Islands. Caution,
services that have similar social and biophysical therefore, is needed in interpreting the values
contexts to those in which the researcher is derived from their analysis for Vanuatu. On a more
interested. For example, if the objective of the general note, this points to the paucity of studies
study is to estimate the value of subsistence fishing valuing ecosystem services in the context of the
from a coastal coral ecosystem in a target area, Pacific Islands and Vanuatu in particular – there is
researchers can apply values from studies
clearly scope for further research in this area.
undertaken under similar socio-economic
conditions. Note that the value of commercial
recreational fishing in a developed country would
be an inappropriate source site study in this case.
When using a benefit transfer approach, in the
absence of a highly relevant study, it is prudent to
use the median value derived from as many
appropriate studies as time permits discovering. It
is important to note that benefit transfers can
only be as accurate as the value estimates in the
source site studies.
1.7.2 Relevant studies for benefit
transfer
The most comprehensive analysis of ecosystem
service values published to date is that of de Groot
et al. (2012). In this analysis, the authors assess 665
studies obtained from the Ecosystem Service
17 VANUATU ECOSYSTEM AND SOCIO-ECONOMIC RESILIENCE ANALYSIS AND MAPPINGYou can also read


