Mapping Crime: Understanding Hot Spots - REPORT
←
→
Page content transcription
If your browser does not render page correctly, please read the page content below

U.S. Department of Justice
          Office of Justice Programs
          National Institute of Justice
AUG. 05

                                                   Special   REPORT

          Mapping Crime: Understanding Hot Spots

                                                             www.ojp.usdoj.gov/nij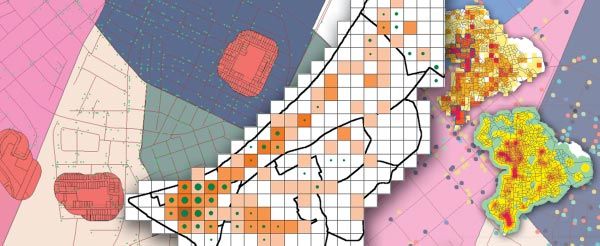
U.S. Department of Justice
Office of Justice Programs
810 Seventh Street N.W.
Washington, DC 20531

Alberto R. Gonzales
Attorney General

Regina B. Schofield
Assistant Attorney General

Sarah V. Hart
Director, National Institute of Justice

This and other publications and products of the National Institute
of Justice can be found at:

National Institute of Justice
www.ojp.usdoj.gov/nij

Office of Justice Programs
Partnerships for Safer Communities
www.ojp.usdoj.gov
AUG. 05

          Mapping Crime:
          Understanding Hot Spots

          John E. Eck, Spencer Chainey, James G. Cameron, Michael Leitner,
          and Ronald E. Wilson

          NCJ 209393
Sarah V. Hart
Director

This document is not intended to create, does not create, and may not be relied upon to
create any rights, substantive or procedural, enforceable by law by any party in any matter
civil or criminal.
Findings and conclusions of the research reported here are those of the authors and do
not necessarily reflect the official position or policies of the U.S. Department of Justice. The
products, manufacturers, and organizations discussed in this document are presented for
informational purposes only and do not constitute product approval or endorsement by the
U.S. Department of Justice.
The National Institute of Justice is a component of the Office of Justice Programs, which also
includes the Bureau of Justice Assistance, the Bureau of Justice Statistics, the Office of
Juvenile Justice and Delinquency Prevention, and the Office for Victims of Crime.

Cover Credits
(From left to right)
Map by Jeff Stith and the Wilson, North Carolina, Police Department
Map by Wilpen Gore, Heinz School of Public Policy and Management, Carnegie Mellon
University, Pittsburgh, Pennsylvania
Background map by Jeff Stith and the Wilson, North Carolina, Police Department
About This Report
Much of crime mapping is devoted to
detecting high-crime-density areas known
What did the researchers
as hot spots. Hot spot analysis helps find?
police identify high-crime areas, types of ■ Identifying hot spots requires multiple
crime being committed, and the best way techniques; no single method is suffi
to respond. cient to analyze all types of crime.
This report discusses hot spot analysis ■ Current mapping technologies have sig
techniques and software and identifies nificantly improved the ability of crime
when to use each one. The visual display analysts and researchers to understand
of a crime pattern on a map should be crime patterns and victimization.
consistent with the type of hot spot and
possible police action. For example, when ■ Crime hot spot maps can most effective
hot spots are at specific addresses, a dot ly guide police action when production
map is more appropriate than an area of the maps is guided by crime theories
map, which would be too imprecise. (place, victim, street, or neighborhood).
In this report, chapters progress in sophis
tication. Chapter 1 is for novices to crime
mapping. Chapter 2 is more advanced,
Who should read this study?
and chapter 3 is for highly experienced Crime analysts and researchers in police
analysts. The report can be used as a com departments.
panion to another crime mapping report
published by the National Institute of
Justice in 1999, Crime Mapping: Principle
and Practice, by Keith Harries.
iii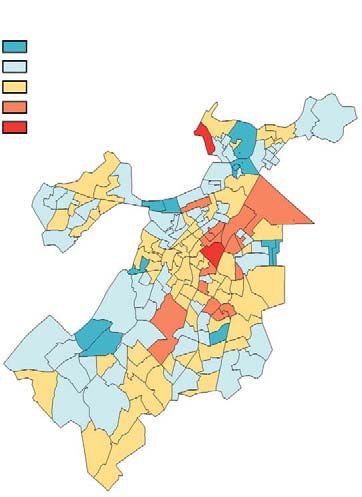
Contents
About This Report . . . . . . . . . . . . . . . . . . . . . . . . . . . . . . . . . . . . . . . . . . . . . . . . . . . . . . . . . iii

Chapter 1. Crime Hot Spots: What They Are,
Why We Have Them, and How to Map Them . . . . . . . . . . . . . . . . . . . . . . . . . . . . . . . 1

Chapter 2. Methods and Techniques for
Understanding Crime Hot Spots . . . . . . . . . . . . . . . . . . . . . . . . . . . . . . . . . . . . . . . . . 15

Chapter 3. Spatial Analysis Tools for Identifying Hot Spots . . . . . . . . . . . . . . . 35

Chapter 4. Conclusion . . . . . . . . . . . . . . . . . . . . . . . . . . . . . . . . . . . . . . . . . . . . . . . . . . . . 65

                                                                                                                                          v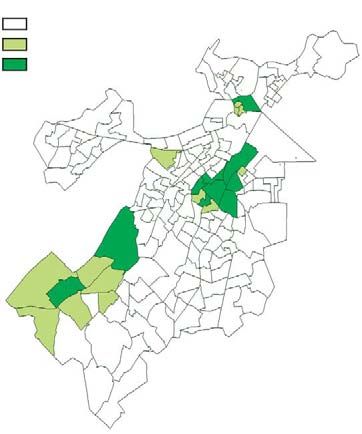
Chapter 1. Crime Hot Spots: What They Are,
Why We Have Them, and How to Map Them
John E. Eck, University of Cincinnati
Crime is not spread evenly across maps. scarce. Community policing is particularly
It clumps in some areas and is absent in attentive to high-crime neighborhoods,
others. People use this knowledge in their where residents have great difficulty exert
daily activities. They avoid some places ing social controls. Problem-oriented polic
and seek out others. Their choices of ing pushes police officials to identify
neighborhoods, schools, stores, streets, concentrations of crime or criminal activity,
and recreation are governed partially by determine what causes these concentra
the understanding that their chances of tions, and then implement responses to
being a victim are greater in some of reduce these concentrations. Much of
these places than in others. In some what is called crime analysis is dedicated
places people lock their cars and secure to locating concentrations of crime—hot
belongings. In other places they do not. spots—and much of crime mapping is
Along some streets people walk swiftly devoted to their detection.
and view approaching strangers with sus
picion. Along other streets they casually This chapter discusses how different inter
stroll and welcome the next interesting pretations of hot spots require different
person they might meet, and notice others types of crime maps. The principal theme
making the same choices in the same is that crime hot spot maps can most
areas. effectively guide police action when pro
duction of these maps is guided by theory.
Some might argue that this behavior With the appropriate crime theory, crime
merely shows that people are unreason maps can communicate vital information
ably fearful of some areas but not of oth to police officials and community mem
ers. This may often be true, but the fact bers efficiently and effectively.
that people are not equally fearful of all
places suggests that they understand that Many useful crime theories provide guid
crime is not evenly distributed. People ance for selecting mapping symbols.
might be mistaken about the risks of Which theory is most useful depends on
some places, but they are not mistaken the type of problem being mapped. Maps
that their risk of being a victim of crime is that are not based on theory will provide
not geographically constant. officers with inadequate and even mislead
ing information.
Police use this understanding every day.
Decisions about how to allocate scarce The term hot spot has a number of mean
resources are based partially on where the ings. This chapter begins with a discussion
demands for police are highest and where of what the term means and how the
they are lowest. Officers are told to be meanings relate to the concept of levels of
particularly attentive to some behavior in spatial analysis of crime. Different theories
some areas, but are given no guidance of crime explain crime at different levels,
about other areas where this behavior is so this chapter briefly describes various
1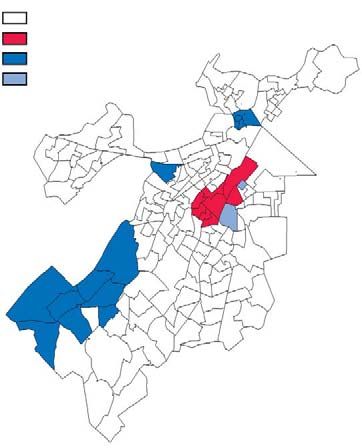
SPECIAL REPORT / AUG. 05
levels of crime theories and explains how crime or disorder. It also suggests that
they can be depicted on maps. This chap some hot spots may be hotter than others;
ter examines four types of crime theories that is, they vary in how far above average
in greater detail: place (point) theories; they are.
street (line) theories; area (polygon) theo
ries; and repeat victim theories, which can
operate on point, line, or polygon level. Levels of hot spot analysis
These theories describe the levels of hot
spots and how these levels can be depict If hot spots are merely areas with an
ed on maps. This chapter examines why above average amount of crime or disor
crime theory, crime mapping, and police der, why do practitioners and researchers
actions need to be consistent. The end of use the term in such a variety of ways? In
the chapter examines how the map sym fact, with recent developments in crime
bols implied by each theory communicate mapping, one can find hot spots of any
to users of crime maps. size—from hot spot places to hot regions.
Although all of these perspectives on hot
spots have something in common—con-
centrations of crime or disorder separated
What is a hot spot? by areas with far less crime or disorder—
Areas of concentrated crime are often they differ in the area covered by the hot
referred to as hot spots. Researchers and spots. More importantly, the factors that
police use the term in many different ways. give rise to hot spot places are different
Some refer to hot spot addresses (Eck and from the factors that give rise to hot spot
Weisburd, 1995; Sherman, Gartin, and streets, hot spot neighborhoods, or hot
Buerger, 1989), others refer to hot spot spot cities. Further, the actions one takes
blocks (Taylor, Gottfredson, and Brower, to deal with a hot spot place will be differ
1984; Weisburd and Green, 1994), and oth ent from the actions needed to address a
ers examine clusters of blocks (Block and hot spot street, hot spot neighborhood, or
Block, 1995). Like researchers, crime ana hot spot city.
lysts look for concentrations of individual
events that might indicate a series of relat These approaches differ on the level of
ed crimes. They also look at small areas analysis, or the size of the geographic area
that have a great deal of crime or disorder, of crime about which one is concerned.2
even though there may be no common The level at which one examines crime or
offender. Analysts also observe neighbor disorder is dictated by the question one
hoods and neighborhood clusters with high asks, which will determine the usefulness
crime and disorder levels and try to link of the results. Consider two related, but
these to underlying social conditions. very distinct, questions: Where are drugs
being sold? What is the market for drugs?
Though no common definition of the term
hot spot of crime1 exists, the common The precise answer to the first question
understanding is that a hot spot is an area requires identifying specific drug-dealing
that has a greater than average number of locations or street segments (very small
criminal or disorder events, or an area areas) where drug dealers and customers
where people have a higher than average routinely meet. To answer the second
risk of victimization. This suggests the question, the analyst needs to find out
existence of cool spots—places or areas where the customers are coming from,
with less than the average amount of just as he would if he asked the question,
2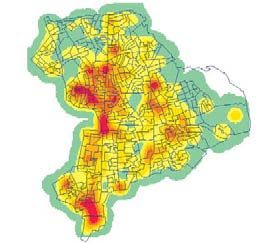
MAPPING CRIME: UNDERSTANDING HOT SPOTS
“What is the market for new cars?” The Crime hot spot theories
answer to the first question—specific
locations or street segments—is not par
ticularly useful for answering the second
Place theories
question. Rather, the analyst would be Place theories explain why crime events
interested in larger areas with high con occur at specific locations. They deal with
centrations of drug users. These areas crimes that occur at the lowest level of
might surround the locations and street analysis—specific places. They involve
segments identified when answering the looking at specific incidents and asking
first question, or they may be physically such questions as, “At what places are
separated from the dealing sites (as would burglaries occurring and at what places are
occur when suburban high school and col they not occurring?” Crime phenomena at
lege students drive into cities to find this level occur as points, so the appropri
drugs). The types of police actions that ate units of analysis are addresses, street
might remove drug-dealing locations are corners, and other very small places,
likely to be different from the actions which are typically represented on maps
needed to dry up the market. So identify as dots. Police action, such as warrants,
ing the appropriate level of analysis is criti which specify exact addresses (not blocks
cal to understanding the problem and or neighborhoods), is very precise at this
determining what action to take. level. Similarly, nuisance abatement focus
es on specific locations.
Crime theories are critical for useful crime
mapping because they aid in the interpre
tation of data (Eck, 1998) and provide Street theories
guidance as to what actions are most Street theories deal with crimes that occur
appropriate. Therefore, understanding at a slightly higher level than specific
how crime theories account for hot spots places; that is, over small, stretched areas
is critical. Several theories of crime and such as streets or blocks. A prostitution
disorder concentration (hot spots) exist. stroll is an example. At this level of analy
Some theories disagree, but often the sis analysts ask such questions as, “On
theories do not contradict each other. which streets are prostitutes found and on
Rather, they explain different types of which streets are they not found?” The
crime phenomena that occur at different appropriate units of analysis can be street
geographic levels. segments, paths, and sections of high
ways, which would be represented on
Each level has basic units of analysis—the maps as straight, bent, or curved lines.
things being examined. One can think of Police action is still relatively precise,
units as corresponding to the geographic although not as precise as at the place
areas being depicted on maps: points, level. Concentrated patrolling occurs at
lines, or polygons (Harries, 1999). Some this level, for example, as well as efforts to
theories help explain point concentrations change traffic and street patterns.
of crime. Other theories help explain linear
concentrations of crime or hot spot crime
polygons. However, theories of crime are Neighborhood theories
useful for helping to guide crime and disor Some theories of crime attempt to explain
der mapping only if one selects a theory neighborhood differences.3 At a higher
appropriate for the level of analysis and level than place or street, neighborhood
action.
3
SPECIAL REPORT / AUG. 05
theories deal with large areas. Here ana Exhibit 1 organizes and summarizes the
lysts are interested in such questions as, discussion of hot spot analysis so far and
“What areas are claimed by gangs and introduces what is to come. The first col
what areas are not?” The appropriate units umn describes the geographic concentra
of analysis are quite varied and can include tion at various levels of interest. The
square blocks, communities, and census second column describes the basic pat
tracts, to name a few. Two-dimensional tern formed by hot spots at each level. The
shapes such as ellipses, rectangles, and third column lists the geometric dimen
other polygons are used on maps to repre sion to be used on a crime map to depict
sent crime phenomena at this level. At this each type of hot spot. Place theories sug
level police action is far less precise gest maps with dots, street theories sug
because the areas are typically too large gest maps that emphasize lines, and area
for effective concentrated patrolling theories suggest the use of polygons on
(Sherman, 1997). Nevertheless, depending maps. Repeat victimization theories do not
on neighborhood characteristics, relevant directly correspond to a single dimension
action might include efforts to engage resi or level. They can be depicted on maps by
dents in collective action against crime dots, lines, or polygons. The last three
and disorder. If offenders are mobile columns highlight points discussed next.
throughout an area, rather than concen Examined are four types of hot spots—
trated at a few places, then efforts to places, victims, streets, and areas.
deter them should occur at this level.
Other large area theories Types of hot spots
Still other theories attempt to explain dif Repeat places hot spots
ferences in crime patterns at much higher
levels of aggregation. For example, theo The most basic form of a hot spot is a
ries of crime differ among cities and place that has many crimes. A place can
among regions. On the city level, suggest be an address, street corner, store, house,
ed actions may include citywide changes or any other small location, most of which
in economic, transportation, education, can be seen by a person standing at its
welfare, and recreation policies, to name a center (Sherman et al., 1989). Places typi
few. On the multijurisdictional or multi- cally have a single owner and a specific
state regional levels, suggested actions function—residence, retail sales, recre
against concentrations of crime could ation, school (Eck and Weisburd, 1995).
include even broader scale policies or Crime often is concentrated at a few
social change. Although these are interest places, even in high-crime areas. Although
ing theories, they are far less useful for hot places often are concentrated within
local police agencies. Thus, they are not areas, they often are separated by other
examined here. places with few or no crimes. Because
such hot spots are best depicted by dots,
they have a dimension of zero.
Repeat victimization theories
Finally, repeat victimization theories pertain Underlying causes. Routine activity theo
to questions of why the same victims are ry helps to explain why crime often is con
targeted repeatedly. They can operate at centrated at specific places. In particular,
any of the three levels discussed: points, routine activity points to how behavior is
lines, or polygons. However, not all repeat regulated at the location by place man-
victimization can be shown on maps. agers—owners of places or people acting
on an owner’s behalf. Behavior regulation
4MAPPING CRIME: UNDERSTANDING HOT SPOTS
falls under place management theory, a place (Brantingham and Brantingham,
part of routine activity theory. For exam 1995). Repeat places tend to be stable
ple, the difference between a bar that has over time (Spelman, 1995a), and this is
few or no incidents or assaults and a bar consistent with the routine activity theory
with frequent assaults is likely to be that in that an absence of effective place man
the first instance the bar employees regu agement is at the heart of the problem.
late the behavior of patrons to minimize
the chances of an assault, and in the sec Maps for repeat places. Maps for repeat
ond instance, they do not. Such regulation places include—
has three effects. It directly prevents crimi
■ Graduated symbols. When looking for
nal activity through early intervention (e.g.,
controlling the number of drinks a patron hot places, dot maps are superior to
can consume), it attracts place users who other forms of mapping. The goal is to
desire a well-regulated location over a identify isolated high-crime locations,
weakly regulated place (such people are which can be done in a number of ways.
less likely to create problems), and it One can use graduated dots, so that dot
repels place users who desire a weakly size is proportional to the number of
regulated location over a well-regulated crimes at the location. This method
Exhibit 1. Hot spot concentrations, evidence, theory, and causes
Map Geometric
Concentration pattern dimension Theories Likely causes Examples
Place—at Point concentration; Zero; concentration Routine activity Management of Bar fights,
specific a few places with at points theory; place behavior at places convenience
addresses, many crimes and many management store
corners, or other places with few robberies,
places or no crimes. Repeat ATM patron
crime places are often robberies,
concentrated. drug dealing
locations
Among Often confused with Zero, one, or two; Routine activity Victim routines Domestic
victims repeat crime places concentration at theory; and lifestyle violence
(above). Only visible points, lines, and lifestyles choices
on maps if victims are areas
concentrated at places,
on streets, or in areas.
Street—along Linear concentration One; concentration Offender search Offender movement Outside
a street or block along major thorough- along lines theory patterns and target street
face fares; a few blocks concentrations prostitution,
with much crime and street drug
many blocks with little dealing,
crime robberies of
pedestrians
Area—neighbor- Concentration covering Two; concentration Disorganization Low collective Residential
hood areas multiblock areas in areas theory and re- efficacy, social burglary,
lated ecologic fragmentation, gang
theories of concentrations violence
crime; of youth,
opportunity economic disinvest-
theories ments; concentra-
tions of crime
targets
5SPECIAL REPORT / AUG. 05
allows the depiction of repeat and non- Repeat victimization hot spots
repeat places on the same map and per
mits comparison among repeat places Repeat victimization refers to the multiple
about the number of crimes. Graduated attacks on the same individual, regardless
dots also allow one to find concentra of location. It often is confused with
tions of hot places (e.g., an area that repeat crime places. A repeat place might
contains several repeat assault bars). have a number of different victims.
Because graduated dots can obscure Clearly one can have both repeat victim
nearby features (e.g., a large dot may ization and repeat crime places (Eck,
overlap nearby smaller dots), this tech 2000). For example, a person could fre
nique is best used on large-scale maps. quent a bar where he is assaulted on a
number of different occasions. But if
■ Color gradient dots. Two other repeat victimization is distributed over
approaches are useful on small-scale many locations (as would occur if repeat
maps. One is to use a color gradient— victims are assaulted at different bars,
yellow through red, for example—to but never the same bar twice), it will not
depict the number of crimes at each show up on a map as a hot spot place
location. A yellow dot may be used to (zero dimension). Repeat victimization
represent places with a single crime, a could show up as lines (one dimension) if
light orange dot may represent locations the victims are repeatedly attacked along
with two crimes, and a deeper orange the same thoroughfares, or as a polygon
dot might represent places with three (two dimensions) if victims are repeatedly
crimes. This approach has the advantage attacked in the same neighborhoods.
of the use of graduated symbols but
overcomes the overlap problem. Mapping repeat victimization is more likely
to reveal patterns with vulnerable popula-
■ Repeat addresses. Another method is tions—potential victims who engage in
to select the most serious hot spot similar activities. Consider taxicab rob
addresses. For example, one might want beries and homicides. These crimes are
to find the worst 10 percent of the unlikely to be concentrated in places. One
addresses. This is called repeat address might find attacks on this victim group
mapping (RAM). The addresses would occurring along specific streets where the
be the 10 percent of repeat addresses drivers are particularly vulnerable or where
that have the most crimes. They would offenders have a better chance of escape.
be plotted on a map using dots to repre More likely, however, taxicab robberies
sent hot spots. This method has two dis and homicides will be spread over a neigh
tinct advantages. First, the map is borhood or in a multineighborhood area
clearer because it has less clutter. within a city.
Second, such maps are useful for clearly
specifying police targets. The deficiency Underlying causes. Repeat crime places
of RAM is that it leaves out information with different victims and repeat victimiza
about the other locations. This deficiency tion with different places have different
can be overcome by producing supple causes. Repeat crime places (with differ
mentary maps that show all locations or ent victims) can be attributable to the
by combining RAM with the use of a behavior of place managers, but if the vic
color gradient so that the targeted hot timizations occur at different places, place
spots have a distinct color (Eck, Gersh, managers have less of a role. In those
and Taylor, 2000). cases, one should look at the occupations,
6MAPPING CRIME: UNDERSTANDING HOT SPOTS
commuting patterns, or lifestyles of the (including offenders), targets situated
potential victims (Farrell and Pease, 1993; along thoroughfares face higher crime
Spelman, 1995b; Stedman and Weisel, risks than targets on side streets far from
1999). The most obvious example comes thoroughfares. Further, some types of tar
from the increasing evidence that the peo gets concentrate along major streets.
ple most likely to become victims of Convenience stores, fast food stores, gas
assault are those people most likely to be stations, and other retail places are sited
involved in deviant and criminal activity along major thoroughfares because that is
(e.g., drug dealing, drug use, heavy alcohol where their customers concentrate. So for
consumption, prostitution) (Menard, both reasons of offender movement pat
2000). Some occupations increase the terns and target placement patterns, many
chances of victimization, which can crime hot spots are actually hot lines.
increase repeat victimization. Police offi
cers, for example, have a greater rate of Some offenses may be concentrated at
victimization than many other occupations points or along lines. Street drug dealing is
(Block, Felson, and Block, 1985). However, one example. Many street drug dealers
the things that make a person a target for simultaneously work along streets but
crime are sometimes difficult for that per anchor their activities to a specific
son to change. address. In such circumstances, one
might find a concentration of drug dealing
along a few street segments and concen
Repeat streets hot spots trations of drug locations at anchor sites.
Repeat streets are those thoroughfares or Weisburd and Green (1995) used street
streets with a high degree of victimization. segments to identify drug hot spots in
Repeat places and some repeat victimiza Jersey City because of offender move
tion hot spots show up as dots on crime ment patterns. Eck (1994), however, identi
maps. If one increases the dimension of fied drug-dealing places because they
the hot spot from zero to one, hot spots seemed to be the anchor points of the
that form lines appear. Linear hot spots drug trade in the San Diego neighborhood
are likely to be the results of the interac he was studying.
tion of targets and offenders along thor
oughfares. Brantingham and Brantingham Distinguishing hot places from hot streets
(1981) describe the search behavior of can be difficult. In fact, one can some
offenders. Their offender search theory times find both. Imagine robbers attacking
points to the importance of street patterns pedestrians on a street leading from
for how offenders look for targets. restaurants and bars to a parking area. The
attack sites may form a line along this
Underlying causes. Offenders find tar street. But even along this hot street, hot
gets while going about their normal legiti places where multiple attacks have
mate business—going to and from work, occurred may exist. However, one should
recreation, shopping, school, and other always be suspicious of such findings. It
nodes of activity. Potential targets that are might be that the hot places are not actual
not along the routes or near nodes used robbery occurrence sites. Instead, they
by offenders will unlikely be victimized, but may be locations to which victims run for
those close to offenders’ routes and nodes help, or they may be addresses that offi
have elevated risks of victimization. Since cers put in their reports when they cannot
major thoroughfares concentrate people easily find the correct robbery address.
7SPECIAL REPORT / AUG. 05
Knowledge of offender, victim, and police outmigration. These changes either dis
behavior is critical to separating the under rupt social networks or prevent such
lying crime pattern from reporting and networks from forming. Since these net
recording patterns. works, according to disorganization the
ory, are responsible for most social
Maps for repeat streets. Commonly control in neighborhoods, their absence
available mapping programs make it easy leads to higher levels of deviancy. Other
to identify hot spot places or hot spot factors, such as poverty and racism, also
areas, but do not make linear hot spots have been identified as undermining
easy to identify. Simple dot maps can be social networks.
used to identify hot street segments, and
this may be the most straightforward ■ Social efficacy. Recent evidence from
method. Most clustering algorithms, Chicago points to the role of social effi
unfortunately, will show areas of concen cacy, which is “the willingness of local
tration even when a line is the most residents to intervene for the common
appropriate dimension. If high levels of good.” It depends on “mutual trust and
precision are not required, such area solidarity among neighbors” (Sampson,
maps may be adequate. Raudenbush, and Earls, 1997, page 919).
Neighborhoods that have a great deal of
social efficacy have less crime and disor
Neighborhoods and other area
der than neighborhoods that have low
hot spots
levels. Social efficacy—like disorganiza
More has been written about neighbor tion and social networks—is not a prop
hood concentrations of crime (hot spots) erty of individual people or places, but a
than about any other form of concentra characteristic of groups of people.
tion of crime. In their pathbreaking book
Social Factors in Juvenile Delinquency ■ Broken windows theory. The broken
(1931), Shaw and McKay noted persistent windows theory also is an area theory of
concentrations of deviancy in the 1920s. crime concentration. Wilson and Kelling
They noted that some neighborhoods had (1982) claim that in most well-function-
high levels of juvenile delinquency, year in ing neighborhoods, small transgressions
and year out, decade after decade, regard of social norms (e.g., failure to keep
less of who lived in the areas (Shaw and one’s yard tidy) result in social pressures
McKay, 1969). Since that time, many to bring the offending party into compli
explanations for differences in neighbor ance. Once a place becomes untended,
hood crime levels have surfaced. Most of however, it undermines the willingness
these theories focus on the ability of local and ability of residents to enforce social
residents to control deviancy (Bursik and order. Consequently, residents withdraw
Grasmick, 1993). from enforcing neighborhood norms,
which allows further deviancy to occur.
Underlying causes. Explanations for dif This in turn results in additional with
fering neighborhood crime levels include drawal and fear and the neighborhood
the following: begins to spiral downward. Skogan
(1990) found evidence in support of this
■ Social disorganization theory. This the basic thesis, although others suggest
ory suggests that the natural ability of the evidence is weak (Harcourt, 1998) or
people to control deviancy in their neigh show that the theory is seriously flawed
borhoods is impaired in some areas by (Taylor, 2000).
constant residential turnover and net
8MAPPING CRIME: UNDERSTANDING HOT SPOTS
■ Crime opportunity theories. Another levels of hot spots. By now, it should be
explanation for neighborhood-level hot obvious that each form of concentration—
spots comes from routine activity theory place, victim, street, or neighborhood—
and related theories that point to crime requires its own form of mapping. It
opportunities as the principle cause of should also be apparent that the types of
crime. Rather than concentrations of actions police should take correspond to
offenders or the absence of social con the type of the concentration. These fac
trols, opportunity theories suggest that tors have important implications for how
analysts should look for concentrations maps of hot spots are constructed and
of crime targets. For example, a dense how the hot spots are depicted.
urban neighborhood with no off-street
parking will have many cars parked on Dot maps. When hot spots are at specific
the street. Such an area may become an addresses, corners, and other places, the
area hot spot for thefts from vehicles. A relevant depiction of the hot spot is a dot
suburban subdivision inhabited by dual- because mappers want to distinguish
income families will have few people at between the places with problems and
home during weekdays. Since their very nearby places without problems.
property is unprotected, their neighbor Such distinctions are critical for delivering
hood can become an area burglary hot effective and efficient action. A gas station
spot. Note that in this type of situation, with many robberies needs to be distin
several layers of hot spots can exist guished from the gas station across the
simultaneously. Within area hot spots, street with no robberies. In this circum
defined by the subdivision in this exam stance, a map highlighting a street or area
ple, might be streets with even greater is far less useful to police than a map high
numbers of burglaries, and some of the lighting the gas stations that are robbery
homes on these streets may be broken hot spots. Dot maps of crime places can
into multiple times. identify widely spread locations that are
hot spots. Such places might be over
Maps for area hot spots. Problems looked if lines or polygons are used to
arising from processes described by define hot spots.
neighborhood-level theories are best
depicted on maps by shaded areas, rather Line maps. When the hot spots are along
than dots or lines. Area hot spots on maps streets, point maps and area maps are of
can be shown in a variety of ways: ellipses, far less utility than line maps. Point maps
shaded areas (choropleth maps), or crime- draw attention to the hot spot places along
frequency gradients (e.g., isoline maps that the street and imply that the intervening
depict crime frequency or risk as graduat locations have low risk, when they may be
ed contours, just as feet above sea level is future targets. Area maps include streets
depicted on topographical maps). that have few or no crimes. Street rob
beries of people leaving bars and night
clubs are good examples of this. The bars
Selecting the Appropriate and nightclubs are specific points, but the
robberies do not occur there. These enter
Hot Spot Map tainment spots may be concentrated in
one neighborhood, but even within this
Action level, hot spot level, neighborhood, many streets do not have
and mapping street robberies. The robberies may occur
The discussion so far has highlighted the along streets leading from the entertain
ories relevant to understanding different ment spots to car parking locations.
9SPECIAL REPORT / AUG. 05
Knowing which streets have the robberies Limitations of hot spot maps
and which do not is critical for addressing
such a concentration. So showing this Concentrations of victimization sometimes
form of hot spot requires lines—straight, can be shown with maps, but often they
jointed, curved, or intersecting. cannot. If victimization risk is in part geo
graphical, then maps are useful. A city
Ellipse, choropleth, and isoline maps. wide dot map of gas stations with two or
When hot spots cover broader areas and more robberies within the last 6 months
coincide with neighborhoods, they need to shows concentration at two levels. The
be depicted in another way. Ellipse and dots depict concentrations of robbery at
choropleth maps imply that the areas with specific places. Groupings of dots depict
in the designated hot spots share the streets or neighborhoods with concentra
same risk level, so a specific street or loca tions of repeat robbery gas stations. Dot
tion within the area is irrelevant. Isoline maps for this type of victimization makes
maps imply a continuous gradient of risk some sense, but they do not work for all
within a hot spot, so a particular place has forms of victimization concentration. If vic
risks similar to but not the same as an tims are mobile, street or area maps might
adjacent place or street. A gang-related be more useful. However, the use of maps
robbery problem can be an example. If is limited for some forms of victimization
gang members commit robberies through analysis. If the population of potential vic
out specific neighborhoods (i.e., do not tims is spread throughout an area (not
focus on specific streets or around specif concentrating at places, along streets, or
ic sites), but refuse to commit robberies within neighborhoods), the analyst would
outside their territories, and their territorial be better off using an analytical technique
boundaries are streets, then a choropleth other than maps to convey the concentra
map might be useful. One could create a tion. For example, taxicab robberies may
map of the gang areas and shade the be spread quite thinly across a city. The
areas according to the robbery frequency relevant features of the robbery victims
within each. If the likelihood of a gang- might be related to the cab companies,
related robbery diminishes the farther one the drivers’ ages, hours of operation,
goes from the center of gang activity, then installed security within cabs, or a host of
an isoline map depicting gradients of rob factors that cannot be shown on a map.
bery frequency does a better job of show Police officers trying to investigate or pre
ing the problem. vent such robberies would find maps less
useful than bar charts showing the charac
Ellipses may be far less useful. They sug teristics of victims and nonvictims.
gest a firm boundary between crime on
the inside and no crime on the outside, Exhibit 2 links the major points discussed
but they frequently do not follow natural thus far. The first two columns are from
movement patterns of people. Using an exhibit 1. The third column shows where
ellipse to define an area hot spot is like the police action needs to be focused. If
saying, “Look in this general area,” the concentration level, action level, and
because neither its shape nor its boundary form of hot spot depiction are not aligned,
are likely to conform to the nature of the then the map will be useless at best and
underlying problem. Consequently, suggest inappropriate action at worst. A
ellipses provide police officers with far map depicting hot streets or areas does
less information than other ways of depict not help identify places where nuisance
ing area hot spots. abatement would be useful. Alternatively,
a point map is too specific for implement
10MAPPING CRIME: UNDERSTANDING HOT SPOTS
ing street reconfigurations or neighbor attention is needed. At the other extreme,
hood redevelopment efforts. focusing attention on point locations when
the problem is at the area level focuses
The consequences of using the wrong attention at too precise an area and sug
type of map are not equal. Point maps are gests action that is too focused.
more forgiving than street or areas maps.
Dot maps allow the user to see the under Maps convey powerful messages to their
lying pattern of crime and determine readers, most of whom are not knowledge
whether to go up a level. However, maps able about the technicalities of crime map
of hot streets or hot areas often do not ping. These messages are conveyed in
show the hot places, thus place concen symbols, as shown in exhibit 3. Dots (A)
tration can remain hidden. This suggests draw attention to specific places and sug
that crime mapping should start at the gest that places without dots can be
lowest level and work upward to avoid ignored. A point conveys the message that
overlooking low-level concentrations the hot spot is located at this exact location
where effective action can be taken. and should be the focus of police efforts. A
shaded street segment (B) suggests that
the chances of crime are roughly equal
Conclusion along the entire segment and police efforts
should focus along this line, but not along
Different kinds of hot spots, which devel other lines. A shaded area (C), such as one
op from different causes, require different used in a choropleth map, also suggests
kinds of police action. For crime mappers, equivalent risks of crime throughout the
this means that the visual display of the area with a dramatic reduction in risk at the
crime pattern on the map should be consis border. It suggests that police activity
tent with the type of hot spot and possible throughout the area is appropriate. An area
police action. Plotting area maps when the covered by a gradient (D), such as that
hot spots are addresses is not useful to the depicted in isoline maps, implies that a cen
police officers using the map because the ter of high-crime activity exists and that
map is imprecise. It directs their attention criminal activity tapers off gradually from
to large areas where little effort needs to be that center. It directs police attention to the
expended and away from the places where center and its surroundings. Each way of
Exhibit 2. Concentration, mapping, and action
Concentration Hot spot depiction Action level Action examples
Place—at specific Points Place, corner Nuisance abatement, hot
addresses, corners or spot patrols
other places
Among victims Points, lines, and areas High-risk targets and Developing networks
depending on the nature potential victims among potential victims,
of concentration repeat victimization
programs
Street—along streets Lines Streets, highways Concentrated patrolling of
or block faces specific streets, traffic
reengineering
Area—neighborhood Ellipses, shaded areas, Large areas Community partnerships,
areas and gradients neighborhood redevelopment
11SPECIAL REPORT / AUG. 05
depicting hot spots is connected with use 3. Some disagreement exists over the geographic
ful theories, each of which suggests differ scope of neighborhood theories of crime. Most
researchers refer to areas covering several square
ent types of police action. Recognition of blocks, although Taylor (1997, 1984) makes a strong
these links in mapping practice will lead to case for the relevant area being about the size of a
better use of crime maps. single block. Clearly, the difference between a large
place and a small neighborhood is blurry.
Notes
1. Although one could have hot spots of anything that
References
can be geographically distributed—a hot spot of auto Block, R., and C. Block. 1995. “Space, Place and
mobile dealerships, for example—usage of this term Crime: Hot Spot Areas and Hot Place of Liquor-
is restricted to crime or disorder. So unless other Related Crime.” In J.E. Eck and D. Weisburd (eds.),
wise specified, hot spots means hot spots of crime Crime and Place (vol. 4, pp. 145–184). Monsey, NY:
or disorder. Criminal Justice Press.
2. Level does not indicate superiority or rank in this Block, R., M. Felson, and C.R. Block. 1985. “Crime
instance. A high-level hot spot is not better or worse Victimization Rates for Incumbents of 246
than a low-level hot spot. Rather, higher level hot spots Occupations.” Sociology and Social Research, 69,
can be composed of groups of lower level hot spots. 442–451.
In this sense, level refers to level of aggregation.
Exhibit 3. Messages in crime maps
Chance of a crime site
Chance of crime being being part of the pattern is
part of pattern is high equal anywhere along
at site, but zero at street segments, and zero
other places. elsewhere.
Everywhere outside A B
the chance of being a
crime site that is part
of the pattern is zero.
Everywhere inside is
equally likely to be a C
crime site that is part
D
of the pattern.
Gradient indicates that the
probability of being a crime
Chance of a site being part
site that is part of the pattern
of the pattern changes
varies from low near the edge
radically at the edge.
to high near the center.
12MAPPING CRIME: UNDERSTANDING HOT SPOTS
Brantingham, P.L., and P.J. Brantingham. 1981. “Notes Menard, S. 2000. “The ‘Normality’ of Repeat
on the Geometry of Crime.” In P.J. Brantingham and Victimization From Adolescence Through Early
P. L. Brantingham (eds.), Environmental Criminology Adulthood.” Justice Quarterly, 17(3), 543–574.
(pp. 27–54). Beverly Hills, CA: Sage Publications.
Sampson, R.J., S.W. Raudenbush, and F. Earls. 1997.
Brantingham, P.L., and P.J. Brantingham. 1995. “Neighborhoods and Violent Crime: A Multilevel
“Criminality of Place: Crime Generators and Crime Study of Collective Efficacy.” Science, 227, 918–924.
Attractors.” European Journal of Criminal Justice
Policy and Research, 3, 5–26. Shaw, C.R., and H.D. McKay. 1931. Social Factors in
Juvenile Delinquency (vol. 2, no. 13). Washington,
Bursik, R.J., and H.G. Grasmick. 1993. Neighborhoods DC: U.S. Government Printing Office.
and Crime: The Dimensions of Effective Community
Control. New York, NY: Lexington Books. Shaw, C.R., and H.D. McKay. 1969. Juvenile
Delinquency and Urban Areas (revision of 1942 ed.).
Eck, J. 2000. “Policing and Crime Event Concentration.” Chicago, IL: University of Chicago.
In L.W. Kennedy, R.F. Meier, and V.F. Sacco (eds.),
The Process and Structure of Crime: Criminal Events Sherman, L.W. 1997. “Policing for Crime Prevention.”
and Crime Analysis. New Brunswick, NJ: Transaction In L.W. Sherman, D. Gottfredson, D. MacKenzie, J.
Press. Eck, P. Reuter, and S. Bushway (eds.), Preventing
Crime: What Works, What Doesn’t, What’s Promising
Eck, J.E. 1994. Drug Markets and Drug Places: A (pp. 8-1–8-58). Washington, DC: U.S. Department of
Case-Control Study of the Spatial Structure of Illicit Justice, National Institute of Justice.
Drug Dealing. Unpublished Ph.D. dissertation,
University of Maryland. Sherman, L.W., P.R. Gartin, and M.E. Buerger. 1989.
“Hot Spots of Predatory Crime: Routine Activities
Eck, J.E. 1998. “What Do Those Dots Mean? and the Criminology of Place.” Criminology, 27(1),
Mapping Theories With Data.” In D. Weisburd and 27–55.
T. McEwen (eds.), Crime Mapping and Crime
Prevention (vol. 8, pp. 379–406). Monsey, NY: Skogan, W.G. 1990. Disorder and Decline: Crime
Criminal Justice Press. and the Spiral of Decay in American Neighborhoods.
New York, NY: Free Press.
Eck, J.E., J.S. Gersh, and C. Taylor. 2000. “Finding
Crime Hot Spots Through Repeat Address Mapping.” Spelman, W. 1995a. “Criminal Careers of Public
In V. Goldsmith, P.G. McGuire, J.H. Mollenkopf, and Places.” In J.E. Eck and D. Weisburd (eds.), Crime
T.A. Ross (eds.), Analyzing Crime Patterns: Frontiers and Place (vol. 4, pp. 115–144). Monsey, NY: Criminal
of Practice (pp. 49–64). Thousand Oaks, CA: Sage Justice Press.
Publications.
Spelman, W. 1995b. “Once Bitten, Then What?
Eck, J.E., and D. Weisburd. 1995. “Crime Places in Cross-Sectional and Time-Course Explanations of
Crime Theory.” In J. E. Eck and D. Weisburd (eds.), Repeat Victimization.” British Journal of Criminology,
Crime and Place (vol. 4, pp. 1–33). Monsey, NY: 35, 366–383.
Criminal Justice Press.
Stedman, J., and D.L. Weisel. 1999. “Finding and
Farrell, G., and K. Pease. 1993. Once Bitten, Twice Addressing Repeat Burglaries.” In C.S. Brito and
Bitten: Repeat Victimization and Its Implications for T. Allen (eds.), Problem-Oriented Policing: Crime-
Crime Prevention (vol. 46). London: Her Majesty’s Specific Problems, Critical Issues and Making POP
Stationery Office. Work (vol. 2, pp. 3–28). Washington, DC: Police
Executive Research Forum.
Harcourt, B.E. 1998. “Reflecting on the Subject: A
Critique of the Social Influence Conception of Taylor, R.B. 1997. “Social Order and Disorder of Street
Deterrence, the Broken Windows Theory and Order Blocks and Neighborhoods: Ecology, Microecology
Maintenance Policing New York Style.” University and the Systematic Model of Social Disorganization.”
Michigan Law Review, 97, 291–389. Journal of Research in Crime and Delinquency, 34(1),
113–155.
Harries, K. 1999. Mapping Crime: Principle and
Practice. Washington, DC: U.S. Department of
Justice, National Institute of Justice.
13SPECIAL REPORT / AUG. 05
Taylor, R.B. 2000. Breaking Away from Broken Uchida (eds.), Drugs and Crime: Evaluating Public
Windows: Baltimore Neighborhoods and the Policy Initiatives. Thousand Oaks, CA: Sage
Nationwide Fight Against Crime, Grime, Fear, and Publications.
Decline. Boulder, CO: Westview Press.
Weisburd, D., and L. Green. 1995. “Policing Drug Hot
Taylor, R.B., S.D. Gottfredson, and S. Brower. 1984. Spots: The Jersey City Drug Market Analysis
“Block Crime and Fear: Defensible Space, Local Experiment.” Justice Quarterly, 12(4), 711–736.
Social Ties, and Territorial Functioning.” Journal of
Research in Crime and Delinquency, 21, 303–31. Wilson, J.Q., and G.L. Kelling. 1982. “Broken
Windows: The Police and Neighborhood Safety.”
Weisburd, D., and L. Green. 1994. “Defining the Atlantic Monthly, March, 29–38.
Street Level Drug Market.” In D.L. MacKenzie and C.
14Chapter 2. Methods and Techniques for
Understanding Crime Hot Spots
Spencer Chainey, Jill Dando Institute of Crime Science, University College London
This chapter presents a number of meth these points will be aggregated to small
ods and techniques to understand and area geographies such as beats or census
describe patterns of hot spots in crime blocks to demonstrate the applicability of
data. It explains the advantages and disad certain techniques. The methods dis
vantages of certain techniques, focusing cussed and tested on these data are per
on methods that are easy to understand fectly applicable to analysts’ own data.
and practical to apply. Four data sets are
used to test the methods. The results help
evaluate how the methods improve under Preliminary global
standing of crime patterns. This chapter
does not attempt to find the optimal
statistical tests
method. Rather, it presents a procedure A number of simple-to-use global statisti
for applying a number of complementary cal tests can be used to help analysts
methods that can help analysts under understand general patterns in the crime
stand hot spots in the data. data presented here. These tests
include—
The four data sets are from the London
Metropolitan Police Force’s Crime Report ■ Mean center.
Information System for Hackney Borough
Police for the period June 1999 through ■ Standard deviation distance.
August 1999. This chapter contains tests
■ Standard deviation ellipse.
developed and conducted to help analysts
understand hot spots in representative
■ Tests for clustering.
samples of crime data sets of—
■ All crime (9,972 records) and three Mean center
subsets.
The mean center point can be used as a
■ Street robbery (588 records). relative measure to compare spatial distri
butions between different crime types or
■ Residential burglary (1,068 records). against the same crime type for different
periods of time (i.e., for measuring spatial
■ Vehicle crime (1,747 records). shifts in the same crime type). For exam
ple, exhibit 1 shows the mean center
The geographic area for these data is points for all crime, street robbery, resi
insignificant to explain the different meth dential burglary, and vehicle crime. The all-
ods for trying to understand crime hot crime mean center can be used as a
spots. The data should be treated merely control to compare against crime type
as point events of crime within a geo subsets. Residential burglary has a mean
graphical boundary area. In some cases, center that is more north than all crime
15SPECIAL REPORT / AUG. 05
and the two other crime subsets. The tance, the more dispersed are the crime
mean center for vehicle crime is the far data. These results show that vehicle
thest south of all the crime types, and crime is the most dispersed; robbery is
street robbery is nearly as far north as that the least.
for residential burglary but slightly farther
west. These mean centers can be used to Standard deviation ellipses
generally indicate that residential burglary
and robbery offenses show a greater ten Levels of dispersion also can be presented
dency to occur in the northern part of the using standard deviation ellipses. The size
borough and that vehicle crime affects the and shape of the ellipse help explain the
southern areas of the borough more. degree of dispersion, and its alignment
helps to explain the crime type’s orienta
tion. Exhibit 3 shows standard deviation
Standard deviation distance ellipses for the four crime types. The sub
Measures of standard deviation distance tle differences between the ellipses help
help explain the level and alignment of dis describe the relative differences in disper
persion in the crime data. These statistics sion and alignment of the four crime
are best used as relative measures, com types’ patterns. The ellipse with the small
paring crime types against each other or est area (robbery) is the least dispersed of
the same crime types for different periods the crime types. The position of the rob
of time. Exhibit 2 shows the standard devi bery ellipse farther north of all crime and
ation distances for the four crime types. vehicle crime, but slightly farther south of
The greater the standard deviation dis the residential burglary ellipse, reflects its
Exhibit 1. Mean center points for the four crime categories
All crime
Street robbery
Residential burglary
Vehicle crime
Borough boundary
16MAPPING CRIME: UNDERSTANDING HOT SPOTS
assume that crime distributions are clus
Exhibit 2. Standard deviation distance results for tered, and whether clusters exist or not,
the four crime categories some can be identified from random crime
Standard deviation distance distributions. Testing for clustering is the
Crime type (meters) first step in revealing whether data has hot
spots of crime.
All crime 1,807.94
Robbery 1,749.94 Several approaches can be applied to test
for clustering in crime distributions. Most
Residential burglary 1,806.28
methods incorporate the basic principles
Vehicle crime 1,820.85 of hypothesis testing and classical statis
tics, in which the initial assumption is that
the crime distribution is one of complete
mean center. Its north-west, south-east spatial randomness (CSR). By setting the
orientation also helps to describe the gen CSR assumption as the null hypothesis,
eral direction toward which robbery crimes the crime distribution can be compared
have a tendency to be patterned. against a set significance level to accept or
reject the null hypothesis. Some tests for
clustering are the nearest neighbor index
Tests for clustering
and the spatial auto correlation tests.
The fourth and probably most useful of the
preliminary global statistics are those that Nearest neighbor index (NNI). The NNI
test for clustering. Crime analysts often is a simple and quick method to test for
Exhibit 3. Standard deviation ellipses for the four crime categories
All crime
Robbery
Residential burglary
Vehicle crime
17SPECIAL REPORT / AUG. 05
evidence of clustering. The NNI test com The results also show the differences
pares the actual distribution of crime data between the NNI results for a minimum
against a data set of the same sample bounding rectangle area and the actual
size, with random distribution. It can be catchment area of the crime points. When
applied when the user has access to data the actual catchment area is known or can
in which each point relates to individual easily be calculated, it should be used in
crime events (irrespective of whether the calculation of the NNI. If the area is
some of these events are mapped on top not known, a minimum bounding rectan
of each other at exactly the same loca gle around the crime distribution often is
tion). The NNI method is explained in the used to calculate the area representing
following steps: the crime data’s catchment zone.
■ For each point, calculate the distance to However, minimum bounding rectangle
the nearest neighbor point. areas used for NNI tests often can create
misleading results for describing point dis
■ Sum the nearest neighbor distance for tributions. To test and show evidence of
all points and divide by the number of this, analysts purposely designed a regular
points in the data. This value is the distribution of points and applied three dif
observed average nearest neighbor ferent types of bounding areas: minimum
distance. bounding rectangle, bounding convex hull,
and true boundary area. After applying NNI
■ Create a random distribution of the tests, the bounding convex hull method
same number of crime points covering and true boundary area revealed similar
the same geographic area, and for each results, correctly describing the point
point calculate the distance to each
nearest neighbor point.
■
Exhibit 4. Nearest neighbor analysis results for the
Calculate the sum of the nearest neigh
four crime data sets
bor distances for all these randomly
distributed points and divide by the Crime type and
number of points in the data. This value bounding area* NNI Z-score
is the average random nearest neighbor
All crime
distance.
Bounding rectangle area 0.32 –129.11
■ The NNI is then the ratio of the True boundary area 0.46 –103.14
observed average nearest neighbor dis
Robbery
tance against the average random near
est neighbor distance. Bounding rectangle area 0.59 –19.14
True boundary area 0.80 –9.20
If the result generated from the NNI test is
Residential burglary
1, then the crime data are randomly dis
tributed. If the NNI result is less than 1, Bounding rectangle area 0.57 –27.14
then the crime data show evidence of True boundary area 0.74 –16.46
clustering. An NNI result that is greater Vehicle crime
than 1 reveals evidence of a uniform pat
Bounding rectangle area 0.52 –38.73
tern in crime data.
True boundary area 0.72 –22.16
Exhibit 4 shows the NNI results for the
four crime data sets. All four sets show *Crime distribution is clustered for all areas.
evidence of clustering in their distribution.
18You can also read