WORKSHOP ON STOCK IDENTIFICATION OF NORTH SEA COD (WKNSCodID) - VOLUME 2 | ISSUE 89 - ICES
←
→
Page content transcription
If your browser does not render page correctly, please read the page content below
WORKSHOP ON STOCK IDENTIFICATION OF
NORTH SEA COD (WKNSCodID)

VOLUME 2 | ISSUE 89
ICES SCIENTIFIC REPORTS

RAPPORTS
SCIENTIFIQUES DU CIEM

 IC E S INTERNATIONAL COUNCIL FOR THE EXPLORATION OF THE SEA
 CIEM CONSEIL INTERNATIONAL POUR L’EXPLORATION DE LA MER
International Council for the Exploration of the Sea
Conseil International pour l’Exploration de la Mer
H.C. Andersens Boulevard 44-46
DK-1553 Copenhagen V
Denmark
Telephone (+45) 33 38 67 00
Telefax (+45) 33 93 42 15
www.ices.dk
info@ices.dk

The material in this report may be reused for non-commercial purposes using the recommended cita-
tion. ICES may only grant usage rights of information, data, images, graphs, etc. of which it has owner-
ship. For other third-party material cited in this report, you must contact the original copyright holder
for permission. For citation of datasets or use of data to be included in other databases, please refer to
the latest ICES data policy on ICES website. All extracts must be acknowledged. For other reproduction
requests please contact the General Secretary.

This document is the product of an expert group under the auspices of the International Council for the
Exploration of the Sea and does not necessarily represent the view of the Council.

ISSN number: 2618-1371 I © 2020 International Council for the Exploration of the Sea
ICES Scientific Reports

Volume 2 | Issue 89

WORKSHOP ON STOCK IDENTIFICATION OF NORTH SEA COD
(WKNSCodID)

Recommended format for purpose of citation:
ICES. 2020. Workshop on Stock Identification of North Sea Cod (WKNSCodID).
ICES Scientific Reports. 2:89. 82 pp. http://doi.org/10.17895/ices.pub.7499

Editor
Steven Cadrin

Authors
Steven Cadrin • Neil Campbell • Massimiliano Cardinale • José De Oliveira • Helen Dobby • Alison Frey
Chris Griffiths • Samuel Hardman • Jakob Hemmer Hansen • Helen Holah • Karin Hüssy • Alexander
Kempf • Adrienne Kovach • Gwladys Lambert • Sara Maggini • Richard McBride • Tanja Miethe •
Coby Needle • Alessandro Orio • Yves Reecht • Thomas Régnier • David Righton • Jon Egil Skjæraasen
Nicola Walker • Peter Wright
ICES | WKNSCODID 2020 | I

 Contents
 i Executive summary ....................................................................................................................... II
 ii Expert group information ............................................................................................................. IV
 iii Resolution ...................................................................................................................................... V
 1 Introduction................................................................................................................................... 1
 1.1 Historical background ...................................................................................................... 1
 1.1.1 Previous Cod Benchmark Stock Assessment ................................................................... 2
 1.2 Workshop process ........................................................................................................... 6
 2 Review information on stock identification of North Sea cod (ToR 1) .......................................... 9
 2.1 Tagging (ToR 1 a.i) ............................................................................................................ 9
 2.1.1 Review of previous studies .............................................................................................. 9
 2.1.2 Re-analysis of historic mark-recapture data .................................................................. 11
 2.1.3 Summary ........................................................................................................................ 12
 2.2 Scientific surveys (ToR 1 a.ii) .......................................................................................... 16
 2.2.1 Review of Previous Studies ............................................................................................ 16
 2.2.2 Summary ........................................................................................................................ 19
 2.3 Fisheries (ToR 1 a.iii) ...................................................................................................... 23
 2.3.1 Recent Spatial Analyses ................................................................................................. 23
 2.3.2 Summary ........................................................................................................................ 24
 2.4 Dispersal of cod eggs and larva/juveniles (ToR 1 a.iv) ................................................... 28
 2.4.1 Ichthyoplankton and Spawning Ground Surveys ........................................................... 28
 2.4.2 Mechanistic models ....................................................................................................... 30
 2.4.3 Summary ........................................................................................................................ 30
 2.5 Genetic analyses (ToR 1 b.) ............................................................................................ 30
 2.5.1 Genetic Structure within the Current North Sea Advisory Area .................................... 31
 2.5.2 Reproductive Connectivity with Spawning Populations in Neighbour Areas ................ 31
 2.5.3 Reanalysis of Available Data .......................................................................................... 33
 2.5.4 Summary ........................................................................................................................ 33
 2.6 Otolith microchemistry (ToR 1 c.) .................................................................................. 36
 2.6.1 Summary ........................................................................................................................ 38
 2.7 Morphometrics and meristics (ToR 1 d.) ....................................................................... 38
 2.8 Life-history and parasites (ToR 1 e.) .............................................................................. 39
 2.8.1 Life-history ..................................................................................................................... 39
 2.8.2 Parasites ......................................................................................................................... 41
 3 Plausible scenarios for cod stocks in the North Sea and adjacent areas (ToR 2) ........................ 43
 4 Practical implications of cod stock scenarios (ToR 3) .................................................................. 46
 5 Recommendations for North Sea cod benchmark (ToR 4) .......................................................... 53
 6 References ................................................................................................................................... 54
 Annex 1: List of participants.......................................................................................................... 62
 Annex 2: Recommendations ......................................................................................................... 63
 Annex 3: Working document 01 ................................................................................................... 64
 Annex 4: Working document 02 ................................................................................................... 79
II | ICES SCIENTIFIC REPORTS 2:89 | ICES

 i Executive summary

 “It seems that cod may be as local as salmon” (Michael Graham, 1934, The North Sea Cod)

 The Workshop on Stock Identification of North Sea Cod (WKNSCodID) reviewed information
 on population structure of Atlantic cod (Gadus morhua) in the North Sea and adjacent waters to
 recommend the most plausible scenario of population structure for stock assessment and fishery
 management advice. The review considered geographic variation and movements of cod life
 stages inferred from genetic analyses, scientific surveys, fishery data, tagging, life-history, distri-
 bution of eggs and larvae, otolith microchemistry and shape, and parasites. Based on the review,
 several population structure scenarios were hypothesized (including the scenario assumed in
 the current advisory unit), and plausibility of each scenario was evaluated. Practical implications
 of each scenario, including the derivation of a catch time-series, were considered to form recom-
 mendations for benchmark stock assessment workshops.
 Since 1996, cod were assessed as a single stock in the North Sea (Subarea 4), Skagerrak (Subdivi-
 sion 20), and the Eastern English Channel (Division 7.d). Adjacent advisory units are Kattegat
 cod (Subdivision 21), Norwegian coastal cod (subareas 1–2), Faroe Plateau cod (Subdivision
 5.b.1), cod West of Scotland (Subdivision 6.a), and cod in the Western English Channel and south-
 ern Celtic Sea (subdivisions 7.e–k).
 A large body of scientific information is available for identification of cod population structure
 in the North Sea and adjacent areas, and a diverse group of experts participated in the workshop
 to help meet WKNSCodID’s objectives. WKNSCodID concluded that North Sea cod appear to
 be isolated from the cod population on the Faroe Plateau (Subdivision 5.b.1) and Norwegian
 Coastal Cod (subareas 1–2). Significant and persistent patterns of genetic variation indicate re-
 productively-isolated populations of Viking cod and Dogger cod that have some spatial overlap
 and mixing after spawning. The Skagerrak and northern Kattegat appear to be a nursing ground
 for Viking and Dogger cod, with most cod in the Skagerrak being Viking cod. These genetically
 different groups have different rates of maturity and growth. Trends in biomass and recruitment
 are strongly correlated among subareas of the North Sea, but subarea trends diverged in the last
 decade, with no apparent rebuilding in the southern North Sea. The common trends in biomass
 and recruitment among subareas suggest that there is some mixing of populations after spawn-
 ing in some areas of the North Sea, and common environmental factors throughout the region.
 Viking cod inhabit the northeast North Sea (on and around Viking Bank, 4.a). The spatial distri-
 bution of Viking cod extends westward to the Shetlands (western part of 4.a) and southward to
 the Fischer and Jutland Banks (northern part of 4.b), with and a nursery area in the Skagerrak
 (20). Some Viking cod some juveniles also inhabit the Kattegat (21). This definition is based pri-
 marily on genetics and is supported by information from tagging, larval dispersal, size and age
 at maturity, otolith chemistry, otolith shape and different recent trends in biomass than the
 southern North Sea.
 The Dogger cod population inhabits the south-central North Sea (on and around Dogger Bank,
 4.b), along the Scottish coast to the north of Scotland (northern part of 6.a), and in the eastern
 English Channel (7.d), with some adults seasonally migrating to the western English Channel
 (7.e–k). The available information does not provide clear evidence of genetic heterogeneity
 within the Dogger cod population. However, the Dogger cod population appears to have some
 phenotypic spatial structure, approximately delineated by the 50 m bathycline in the central
 North Sea (4.b). Cod north of this boundary (4.a and parts of 4.b) exhibit differing rates of growth
 and maturity, as well as recent biomass trends, compared to those to the south (4.c). There is
 relatively little mixing of cod between 4.a and 4.b and sedentary behaviour along the British
ICES | WKNSCODID 2020 | III

 coast. Geographic shifts in the distribution of North Sea cod and the low abundance of cod in the
 southern North Sea appear to result from the interacting effects of fishing effort and warming
 habitats.
 WKNSCodID recommends that ICES stock assessments recognize and account for Viking and
 Dogger cod populations and consider accounting for phenotypic stocks within the Dogger pop-
 ulation. A range of spatial approaches to stock assessment methods and advice should be con-
 sidered, including a single-area assessment of the current advisory unit, fleets-as-areas, spatially
 structured assessments, fully separated subarea assessments, and survey-based assessments;
 ideally with simulation testing to evaluate the relative performance of these alternatives. A prac-
 tical consideration for representing stock structure is that the 2020–2021 North Sea cod bench-
 mark is not prepared to include data for cod north and west of Scotland (northern part of 6.a),
 so that topic should be addressed at a future benchmark workshop.
 Routine stock composition sampling and analysis is needed to fully account for mixing of Viking
 and Dogger cod in some areas, but most of the populations and phenotypic stocks can be delin-
 eated by geographic boundaries. The spatial resolution of stock boundaries depends on the data
 used for stock assessment. Surveys and recent fishery data can be disaggregated by latitude-
 longitude rectangles, but further disaggregation of historical fishery data is difficult, and rela-
 tively simple groupings of latitude-longitude rectangles would be more practical for deriving a
 time-series of landings, discards, size composition, and age composition. Therefore, to support
 alternative spatial approaches for the 2020–2021 North Sea cod benchmark assessment, WKNS-
 CodID recommends a minimum spatial resolution for fishery data (i.e. catch by major fleets) and
 survey data, over as long a time-series as possible, by ICES divisions (e.g. 4.a, 4.b, 4.c, 7.d) and
 subdivisions (e.g. 20), and a relatively simple division of the northern North Sea (4.a.West and
 4.a.East, divided at the prime meridian, 0° longitude) to approximately represent the most plau-
 sible delineation between the Viking and Dogger cod populations.
IV | ICES SCIENTIFIC REPORTS 2:89 | ICES

 ii Expert group information

 Expert group name Workshop on Stock Identification of North Sea Cod (WKNSCodID)

 Expert group cycle Annual

 Year cycle started 2019

 Reporting year in cycle 1/1

 Chair Steven Cadrin, USA

 Meeting venue and dates 14 July 2020 and 3–6 August 2020 by correspondence (Webex) (25 participants)
ICES | WKNSCODID 2020 | V

 iii Resolution

 This resolution was approved on the Resolution Forum February 2020

 2020/2/FRSG43 A Workshop on Stock Identification of North Sea Cod (WKNSCodID)
 chaired by Steve Cadrin, will meet from 3–6 August by correspondence (Webex) to:
 a) Review information on stock identification of North Sea cod and comparative review
 of Atlantic cod population structure, including critical evaluation of inferences from
 each source of information, to build up a picture of cod substock structure in the
 North Sea and adjacent areas, based on the following:
 i. Distribution and movements of different life-stages of cod, including changes
 over time, inferred from:
 1) WKNSCodID tagging
 2) Scientific surveys
 3) Commercial landings
 4) Dispersal models (e.g. of cod eggs and larva/juveniles)
 ii. Genetic analyses
 iii. Otolith microchemistry
 iv. Morphometrics and meristics
 v. Life-history and parasites
 vi. Other approaches not listed above
 b) Based on the evidence from ToR 1, formulate scenarios for cod stocks in the North
 Sea and adjacent areas, and assess the evidence-based plausibility of each of these
 scenarios (including current definitions).
 c) Consider the practical implications, for data, particularly historical time-series of
 catch data, of each of the scenarios in ToR 2, and how any difficulties might be dealt
 with. For example, considering spatial components with mixing in a single model
 has different implications for data compared to split stock units. Considerations
 should include how to deal with changes over time.
 d) Make recommendations for which cod stock scenario(s) to take forward in the forth-
 coming cod benchmark, including in what format data should be requested and pre-
 pared.

 The Workshop will report by 20 August for the attention of ACOM and FRSG.
ICES | WKNSCODID 2020 | 1

 1 Introduction

 1.1 Historical background
 Atlantic cod (Gadus morhua) are distributed across the continental shelves of the North Atlantic,
 from the Middle Atlantic Bight off the northeast coast of the United States to the Barents Sea off
 the coast of Russia—and throughout the North Sea and adjacent waters. Within this broad area,
 cod are relatively population-rich, with distinct self-sustaining populations inhabiting coastal
 areas and offshore banks (Sinclair, 1988; ICES, 1994, 2005).
 ICES has a long record of research on the population structure of cod in the North Sea and adja-
 cent areas. Spatial structure of cod in the North Sea was recognized by Graham (1934), who re-
 ported that cod in the shallower south-eastern North Sea (80 m). The North Sea Cod Working Group (ICES, 1970) and the
 North Sea Roundfish Working Group (ICES, 1971) studied the relationships between cod among
 areas of the North Sea in response to spatial shifts in fisheries, in which catch of cod in the central
 North Sea (4.b) doubled from 1963 to 1966, and was almost an order of magnitude greater than
 cod caught in the southern North Sea (Daan, 1969). The Larval Fish Ecology Working Group
 compiled spawning and larval characteristics for cod stocks throughout the North Atlantic
 (ICES, 1987), which led to comparative analyses among cod stocks by the ICES Study Group on
 Cod Stock Fluctuations (ICES, 1990) and the ICES/GLOBEC Working Group on Cod and Climate
 Change (ICES, 1994, 2005). The most recent benchmark stock assessment of North Sea cod re-
 viewed information on stock identity (ICES, 2015), which has been included in recent ICES ad-
 vice (e.g. ICES, 2019a).
 The North Sea Cod Working Group (ICES, 1970) and the North Sea Roundfish Working Group
 (ICES, 1971) reviewed information on spawning grounds, nursery grounds areas, age structure,
 and extensive tagging data—concluding that cod do not disperse uniformly throughout the
 North Sea. Age compositions of the fishery demonstrated geographic variation in recruitment.
 For example, the 1963 year-class was abundant in the south and central North Sea (4.b and 4.c)
 but not in the northern North Sea (4.a) (ICES, 1971). Tagged cod exhibited seasonal movements
 with limited mixing among the following areas:
 1. Norwegian side of the Skagerrak (20),
 2. Danish side of the Skagerrak (20),
 3. one to several areas along the English coast from Flamborough to the Scottish east and
 north coasts (4.a and 4.b),
 4. central North Sea (4.b),
 5. Southern Bight from the Strait of Dover to 54°N (4.c and 7.d)
 6. the Western English Channel (7.e)
 Historical tagging suggested movements of cod from the Skagerrak to the eastern portion of the
 North Sea (4.a and 4.b), and seasonal mixing between the central North Sea (4.b) and the South-
 ern Bight (4.c). Some North Sea cod groups were relatively resident, but individual movements
 varied within spawning groups, and some exhibited long-distance spawning-feeding migrations
 usually 30–200 km but up to 300 km (ICES, 1994, 2005). Therefore, North Sea cod has not been
 assumed to be one distinct population (ICES, 1994, 1996, 2005, 2015).
 Before 1996, cod were assessed as three separate stocks in the southern and northern North Sea
 (4.a–c), the Skagerrak (20), and the Eastern English Channel (7.d). In 1995, the stock structure of
 cod in the North Sea and adjacent areas was reconsidered (ICES, 1996). A continuous distribution
 of cod larvae from the north-eastern North Sea to the Skagerrak/Kattegat border, the lack of
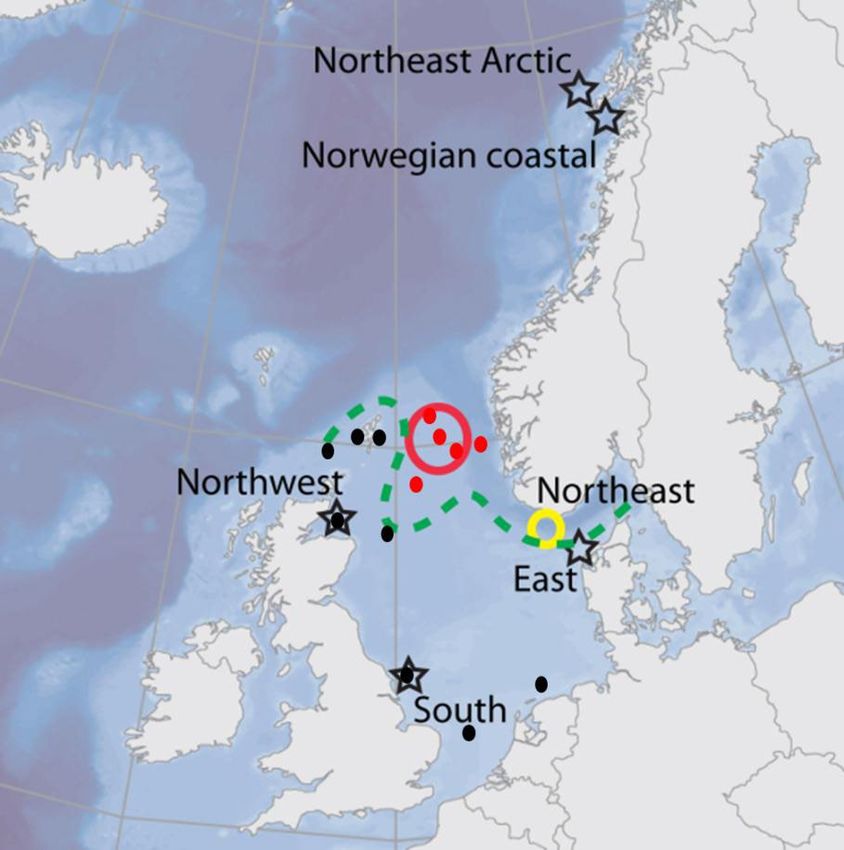
2 | ICES SCIENTIFIC REPORTS 2:89 | ICES

 spawning cod in the Skagerrak, and movement of tagged juveniles from the Skagerrak to the
 North Sea suggested that cod in the Skagerrak and northern Kattegat were spawned in the North
 Sea. Egg surveys indicated that cod spawn in the eastern English Channel, suggesting local re-
 cruitment, but tagging documented movement of juveniles and adults to the Southern Bight, and
 fishery catch rates of cod in the eastern Channel were most strongly correlated with catch rates
 in the southern North Sea (4.c). Working group experts (ICES, 1996) concluded that cod in the
 North Sea, Skagerrak, and the eastern Channel are not a single, homogeneous stock, but cod in
 the combined areas could be considered as a single stock for assessments, and as separate stock
 from cod spawning in the southern Kattegat (21) and Norwegian fjords of the Skagerrak (20).
 In 1996, the assessment that combined cod in the North Sea, eastern English Channel, and Skag-
 errak (Subarea 4, Division 7.d, and Subdivision 20) showed that catches of cod in the North Sea
 dominated the combined catch, with an annual average of 10% from the Skagerrak and 3% from
 the eastern Channel (ICES, 1997). ICES (2005) explained that the three areas formed one manage-
 ment unit which was justified based on conventional tagging data that demonstrated mixing of
 cod between the three areas but little intermingling of cod between the North Sea and other
 areas. Adjacent advisory units are Kattegat cod (subdivision 21), Norwegian Coastal cod (1–2),
 Faroe Plateau cod (5.b.1), cod West of Scotland (6.a), and cod in the western English Channel and
 southern Celtic Sea (7.e–k).
 There is evidence of spatial structure within the current advisory unit. Substocks with clear
 boundaries could not be defined by initial analyses of haemoglobin allozymes (Jamieson and
 Birley 1989; ICES, 1994), but Hutchinson et al. (2001) used more sensitive genetic characters to
 identify several genetically distinct populations within the southern and northern North Sea (at
 Bergen Bank, Moray Firth, Flamborough Head and the Southern Bight) that appear to be repro-
 ductively isolated and spatially distinct during the spawning season. Trends in cod abundance
 have also varied among areas of the North Sea. For example, ICES (2005) reported a decrease in
 age 1–2 cod in the German Bight and a concentration in the north-eastern North Sea (north of the
 50 m bathycline from Flamborough Head to the Jutland Bank).

 1.1.1 Previous Cod Benchmark Stock Assessment
 Stock identification was not the primary objective of the 2015 benchmark stock assessment for
 North Sea cod (ICES, 2015), but the benchmark workshop reported evidence of two cod popula-
 tions in the North Sea:
 1. one in the northeast North Sea (eastern portion of 4.a, termed ‘Viking’ cod) and
 2. one in shallower waters of the northwest North Sea (western portion of 4.a) and the
 southern North Sea (4.b–c; termed ‘Dogger’ cod, Heath et al., 2014). See Figure 1.1.
 Microsatellites and Single Nucleotide Polymorphisms (SNPs) indicated that Viking cod are re-
 productively isolated from other spawning aggregations in the North Sea (Nielsen et al., 2009b,
 Poulsen et al., 2011; Heath et al., 2014). Information from genetics also suggested that cod in the
 North Sea are isolated from Norwegian coastal cod (areas 1–2; ICES, 2015), which is supported
 by tagging studies that document high site fidelity of cod in Norwegian fjords (Nedreaas et al.,
 2008), and different trends in juvenile abundance among fjords (Rogers et al., 2014).
 Other mechanisms of reproductive isolation among cod groups in the North Sea include limited
 life-stage connectivity and oceanographic barriers to early life-stage transport (Heath et al., 2008;
 Munk et al., 2009) as well as limited mixing and natal homing of adults, with residence in >100 m
 depths and little mixing of Viking fish with neighbouring groups (Wright et al., 2006a; Neat et
 al., 2014). Genetics and otolith microchemistry indicated that many Viking juveniles settle in the
 Skagerrak and subsequently make a return migration prior to spawning (ICES, 2015). This return
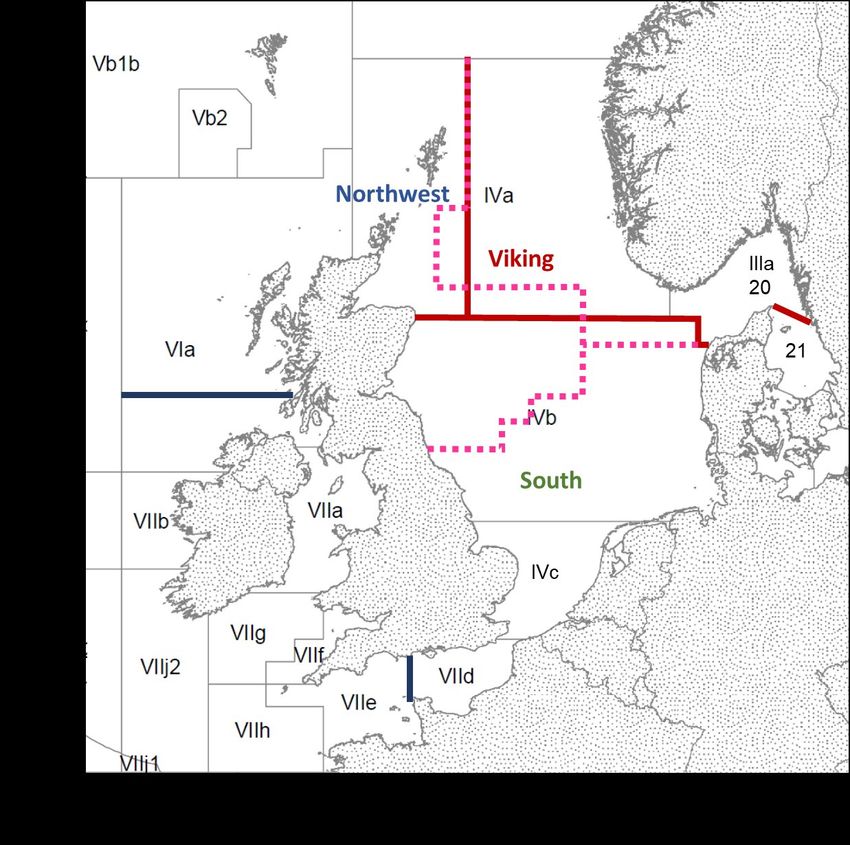
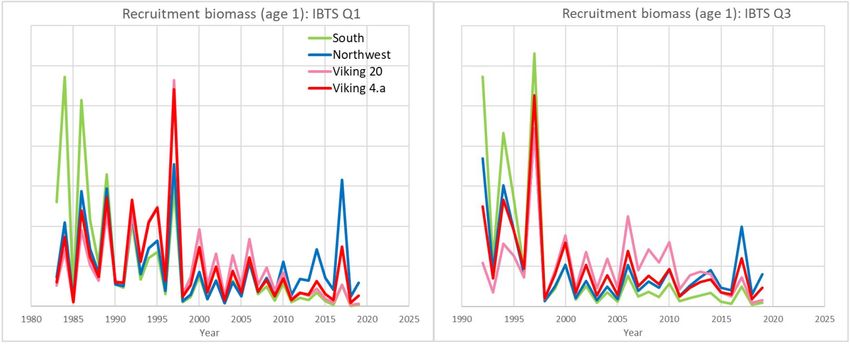
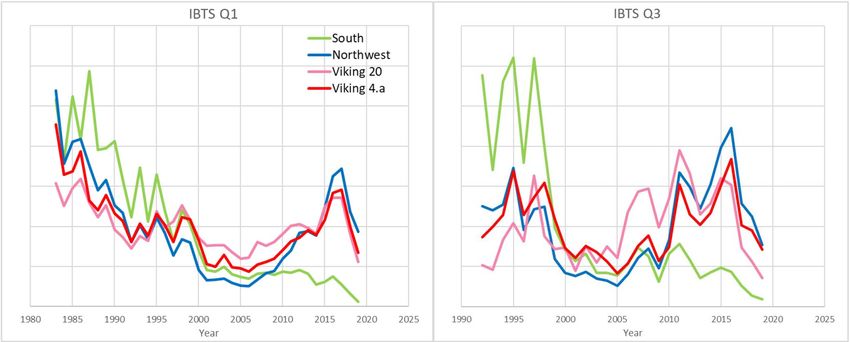
ICES | WKNSCODID 2020 | 3

 migration of Viking juveniles could explain observations of relatively high age-0-1 cod abun-
 dance in the Skagerrak that did not correspond with a high abundance of those year-classes at
 age 2+ in the Skagerrak (Svedäng and Svenson, 2006), and the relatively strong year class of cod
 in 2001 in the Skagerrak that was genetically assigned to originate from the North Sea (Knutsen
 et al., 2004).
 In addition to evidence for population structure of cod within the North Sea, there also appears
 to be fine-scale population structuring within the North Sea as suggested by patterns of larval
 transport (Heath et al., 2008), juvenile dispersal (Wright et al., 2006a), and adult movements
 (Wright et al., 2006b; Righton et al., 2007; Svedäng et al., 2007; Neat et al., 2014). Larval transport
 models and otolith microchemistry do not suggest mixing of eggs and larvae across the North
 Sea. In the Skagerrak, there appears to be extensive mixing of juveniles between local, Viking
 cod and possibly Dogger cod from the southern North Sea. Seasonal adult movements are gen-
 erally 100 m.
 Although home ranges of cod are relatively compact during the spawning season, spatial distri-
 butions increase after spawning with some overlap between Viking cod and Dogger cod east of
 Shetland (Wright et al., 2006b; Neat et al., 2014). Home ranges of cod aggregations overlap for
 some life stages outside the spawning period. For example, cod from the shallow population
 may overlap with the western distribution of Viking cod after spawning
 The 2015 benchmark assessment of North Sea cod defined subarea boundaries to investigate
 spatiotemporal patterns in the cod resource and fisheries (ICES, 2015). Subarea boundaries (Fig-
 ure 1.1) reflect areas of low mixing but do not necessarily represent distinct population bounda-
 ries:
 1. Viking
 2. Skagerrak (nursery area for Viking).
 3. Northwest, and
 4. South.
 Survey trends were similar for cod in the Northwest, Viking and Skagerrak areas in recent years,
 but biomass trends have been different in the South since 2010 (ICES, 2015, 2019a). The biomass
 of adult cod in the Northwest area more than tripled from 2006 to 2013, adult biomass in the
 Viking and Skagerrak subareas approximately doubled during the same period, but biomass
 remained low in the South (Figure 1.2; Eero et al., 2015). An exploratory assessment of cod in the
 Northwest and South subareas produced stock trends that were similar to an assessment of Vi-
 king and Skagerrak cod but lower estimates of fishing mortality in the Northwest and South
 subareas than in the Viking and Skagerrak subareas. Survey information did not indicate major
 differences in recruitment (Figure 1.2) or recruitment per unit of spawning biomass among any
 of the subareas. European fishing effort was greatest in the low cod abundance area in the South.
 European cod landings were greatest in the Viking subarea in recent years where the cod bio-
 mass is estimated to be highest, but there was a declining trend in the South subarea where the
 stock size was lowest. Survey data and analytical assessments suggest that total mortality is
 greatest in the South, lowest in the Northwest, with intermediate level in the Viking and Skag-
 errak subarea (Figure 1.1; ICES, 2015).
 The 2015 North Sea cod benchmark assessment concluded that different recent trends among
 subareas are consistent with evidence of population structure. Regional variation in environ-
 mental conditions, predation and fishing mortality are expected to lead to some differences in
 subarea trends. Differences in life-history traits were also found among the subareas consistent
 with population differences (Harrald et al., 2010; Wright et al., 2011; Yoneda and Wright, 2004).
4 | ICES SCIENTIFIC REPORTS 2:89 | ICES

 ICES (2019a) advice for 2020 included a summary of information on stock identity of North Sea
 cod 1:

 “Cod is widely distributed throughout the North Sea, but there are indications of
 subpopulations inhabiting different regions of the North Sea (e.g. from genetic stud-
 ies). The inferred limited degree of mixing suggests slow recolonization in areas
 where subpopulations are depleted. Figure 1.2 plots a cod biomass index by subre-
 gion (with subregions given in Figure 1.1), and highlights differing rates of change
 in this index. The figure shows a general decline in all areas prior to the mid-2000s
 and a general increase peaking in 2016–2017 in all areas thereafter, with the excep-
 tion of the southern area where cod has further declined. There has been a subse-
 quent decrease in all areas, and it is unclear what the reasons are for this; further
 work is required to investigate climate change, biological, and fisheries effects. Re-
 cruitment has declined and remains low in all areas (Figure 1.3).”

 There is a long history of recognising the biological stock structure of cod throughout the North
 Atlantic, including in the North Sea area. Considering information from both traditional and
 newly developed disciplines adds a richness to the understanding of cod population structure.
 In parallel to stock structure research, the spatial units of ICES advice for cod fisheries in the
 North Sea have evolved from multiple advisory units in the North Sea, eastern English Channel
 and Skagerrak, to a single advisory unit in those areas, to the consideration of subarea trends
 within the North Sea cod advisory unit. ICES recognized the need to reconsider the population
 structure of cod in the North Sea and adjacent recommendations for benchmark stock assess-
 ments.

 1 Figure numbering revised to reflect numbering in this report.
ICES | WKNSCODID 2020 | 5

 Figure 1.1. Putative subareas used for spatial analyses of North Sea cod by ICES (2015).
6 | ICES SCIENTIFIC REPORTS 2:89 | ICES

 Figure 1.2. Cod in Subarea 4, Division 7.d, and Subdivision 20. Biomass indices by subregion (see Figure 1.1), based on the
 NS IBTS quarter 1 and quarter 3 survey data (ICES, 2019a).

 Figure 1.3. Cod in Subarea 4, Division 7.d, and Subdivision 20. Recruitment indices by subregion (see Figure 1.1), based
 on NS IBTS quarter 1 and quarter 3 survey data (from ICES, 2019a).

 1.2 Workshop process
 The Workshop on Stock Identification of North Sea Cod (WKNSCodID) met by Webex on 14 July
 2020 and 3-6 August 2020 and by correspondence to address its Terms of Reference:
 1. Review information on stock identification of North Sea cod and adjacent areas in the context
 of Atlantic cod population structure information from throughout its range, including criti-
 cal evaluation of inferences from each source of information, to build up a picture of cod
 substock structure in the North Sea and adjacent areas, based on the following Terms of
 Reference:
 a) Distribution and movements of different life-stages of cod, including changes over
 time, inferred from:
 i. Tagging
 ii. Scientific Surveys
 iii. Commercial landings
 iv. Dispersal (e.g. of cod eggs and larva/juveniles)
 b) Genetic analyses
 c) Otolith microchemistry
 d) Morphometrics and meristics
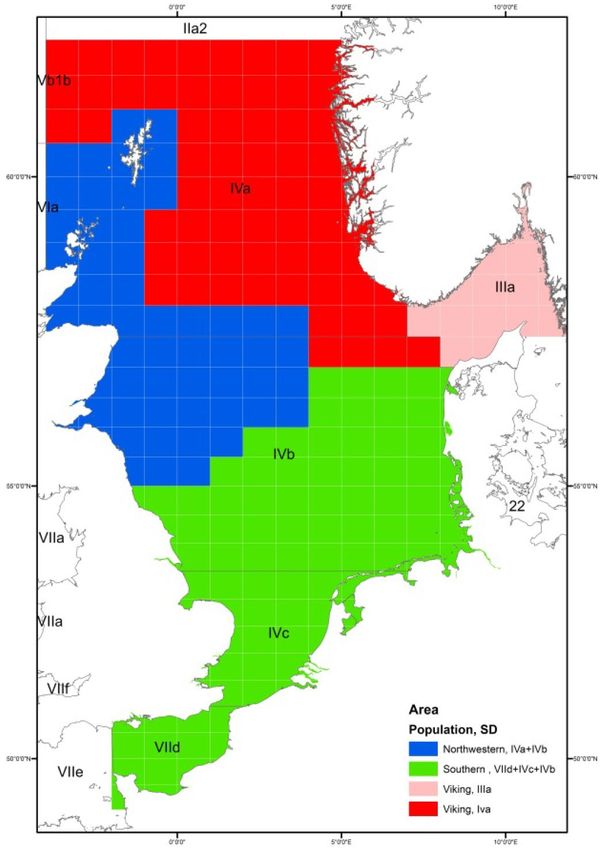
ICES | WKNSCODID 2020 | 7

 e) Life-history and parasites
 f) Other approaches not listed above
 2. Based on the evidence from ToR 1, formulate scenarios for cod stocks in the North Sea and
 adjacent areas, and assess the evidence-based plausibility of each of these scenarios (includ-
 ing current definitions).
 3. Consider the practical implications, for data, particularly historical time-series of catch data,
 of each of the scenarios in ToR 2, and how any difficulties might be dealt with. For example,
 considering spatial components with mixing in a single model has different implications for
 data compared to split stock units. Considerations should include how to deal with changes
 over time.
 4. Make recommendations for which cod stock scenario(s) to take forward in the forthcoming
 cod benchmark, including in what format data should be requested and prepared.
 Workshop participants met on 14 July 2020 for introductions, a quick review of previous ICES
 science and advice for North Sea cod, a decision to refine conclusions about stock identity from
 the 2015 benchmark, identification of initial population structure scenarios, and to agree on the
 general approach. Participants agreed to build on conclusions and recommendations from the
 2015 Benchmark (ICES, 2015) with some refinements. For example, information supporting
 boundaries with West of Scotland (northern portion of 6.a), the Western English Channel (7.e)
 and the Kattegat (21) were reviewed. Some tagging information was available to consider mixing
 with 6.a, 7.e, and 21. Information on otolith chemistry and genetics was also available to consider
 mixing with the Kattegat (21). The delineation of subareas also needed to be revised to account
 for new information on stock identity north and west of the Shetland Islands (Figure 2.4).
 The 2020 benchmark stock assessment of cod west of Scotland (ICES, 2020) was not primarily
 focused on stock identification but reported: “Stock structure remains an issue for cod in Division
 6.a. The latest evidence (WD 4.1) suggests that there are at least three substocks which remain
 largely geographically isolated throughout the year with the northern offshore component (cur-
 rently responsible for the majority of the landings) more closely linked to cod in the northern
 North Sea than the rest of Division 6.a.”
 Workshop participants agreed to address the terms of reference by adopting the general ap-
 proach developed for the Workshop on Redfish Stock Structure (ICES, 2009) which involved
 sequential stages of consensus summary statements from all participants:
 1. Define current spatial management units and their justification.
 2. Identify all plausible hypotheses of population structure (including current management
 units).
 3. Review available information on stock identity, grouped into broad disciplines
 4. Form consensus conclusions about stock inferences within each discipline
 5. Evaluate each stock structure hypothesis based on interdisciplinary synthesis
 Initial stock identification hypotheses and putative advisory units for the 2020–2021 benchmark
 assessment were formed:
 Hypothesis 1. The current advisory unit of North Sea cod (4, 7.d and 20) is a closed, homogene-
 ous population.
 Hypothesis 2. The cod resource in the current advisory unit of North Sea cod (4, 7.d and 20) is a
 metapopulation (i.e. a system of interacting biological populations, termed sub-
 populations, that exhibit a degree of independence in local population dynamics
 as well as connectivity between subpopulations, Cadrin et al., 2014) with three
 interacting subpopulations (Viking-Skagerrak, Northwest, South; Figure 2.4).
8 | ICES SCIENTIFIC REPORTS 2:89 | ICES

 Hypothesis 3. The substocks of cod in the North Sea (Figure 2.4) are demographically independ-
 ent.
 Hypothesis 4. There is considerable connectivity of cod between the northwest North Sea (4.a)
 and north of Scotland (northern part of 6.a).
 Hypothesis 5. There is considerable connectivity of cod between the eastern English Channel
 (7.d) and the western English Channel (7.e–k).
 Hypothesis 6. There is considerable connectivity of cod between the Skagerrak (20) and the Kat-
 tegat (21).
 Workshop participants contributed to topical groups according to Term of Reference #1 to iden-
 tify and review the available literature on stock identity of cod in the North Sea and adjacent
 areas. Technical reviews of each publication and some unpublished documents considered the
 objective of the study, representativeness of samples for the hypothetical stocks, power of sam-
 pling and analytical design for detecting meaningful differences between groups. Group leaders
 assigned group members to draft a brief review of specific source documents, group members
 reviewed drafts to form group consensus on each source document, and group leaders drafted
 a summary of information on their assigned topic for Workshop consensus on inferences related
 to population structure of cod in the North Sea and adjacent areas as well as relative support for
 alternative hypotheses. The chair drafted an interdisciplinary summary of inferences related to
 population structure of cod in the North Sea and adjacent areas, with relative support for alter-
 native hypotheses, for Workshop discussion and iterative refinement to develop consensus con-
 clusions and recommendations. Christoph Stransky and Manuel Hidalgo, members of the Stock
 Identification Methods Working Group (SIMWG), who did not participate in the workshop re-
 viewed the draft report in advance of the 2020–2021 North Sea cod benchmark workshop.
 At the suggestion of Workshop participants, the Workshop Chair contacted the ICES Advisory
 Committee Chair in advance of the draft report to communicate two aspects of Workshop rec-
 ommendations: 1) spatial data compilation to support a range of spatial approaches to stock as-
 sessment methods, and 2) connectivity between cod in the northern part of 6.a and the North
 Sea, which is expected to be beyond the scope of the 2020–2021 North Sea cod benchmark.
ICES | WKNSCODID 2020 | 9

 2 Review information on stock identification of North
 Sea cod (ToR 1)

 2.1 Tagging (ToR 1 a.i)
 Tagging studies document movement patterns, the degrees of residence or dispersal, and rela-
 tive movement rates among areas (Harden Jones, 1968). Many tagging studies have been con-
 ducted in the North Sea area to investigate the movement and spatial distribution of cod (e.g.
 Robichaud and Rose 2004, Righton et al., 2007; Neat et al., 2014). These studies involve the tag-
 ging, release, and recapture of individuals, with the aim of shedding light on individual behav-
 iours such as foraging and migration, as well as population-level characteristics that are informa-
 tive to management. For example, tagging studies can reveal the level of mixing that occurs be-
 tween populations (e.g. Espeland et al., 2008), spatial distribution relative to management units
 (e.g. Neat et al., 2014), and can help disentangle the complex issue of stock structure and stock
 identification. Evidence for stock structure and stock identification provided by tagging data for
 North Sea cod includes studies completed throughout most of the last century and span the
 management units: Subarea 4 (divisions 4.a–c), Divisions 7.d–e, Division 6.a, Division 7.a, divi-
 sions 7.f–h and subdivisions 3.a.20 and 3.a.21, and two general approaches: mark-recovery and
 electronic telemetry (predominantly Data Storage Tags; DSTs). Historic mark-recapture data
 were also re-analysed for the workshop.

 2.1.1 Review of previous studies
 In the southern North Sea (4.c) and eastern Channel (7.d), Righton et al. (2007) used historical
 mark-recovery data (dating back to the 1960s) as well as electronic tags (n = 30) to investigate the
 movement patterns of cod. The authors show that the spatial distribution of tag returns depends
 on both season and age. Fish recaptured during the spawning season (quarter 1 and quarter 4)
 were typically caught within their release area, whereas recapture outside of their release area
 was much more common during the summer foraging season (quarter 2 and quarter 3). Adults
 were found to displace further than juveniles (body length < 50 cm), moving northwards into 4.b
 and in a south-easterly direction into 7.d and 7.e. The connectivity of cod between 4.c and 4.b,
 and from 4.c into 7.d and 7.e, is documented further in the work of Bedford (1966), Le Franc
 (1969), Daan (1969), De Clerck, (1973), Hobson et al. (2009), Neat et al. (2014) and Griffiths et al.
 (2018), as well as in the re-analysis of historic mark-recovery data presented below. For instance,
 40% of cod tagged in 7.d were recaptured in 4.c (Bedford, 1966), whereas 20-30% of all individu-
 als tagged in 4.c were recaptured in 4.b (Figure 2.2).
 Righton et al. (2007) reported that cod tagged in 4.c moved an average distance of 135 km (±
 135 km) between their release and recapture locations but their northern range rarely extended
 into 4.a. This finding is consistent with the work of Neat and Righton (2007) who reported that
 129 large juvenile (>30 cm) and adult cod tagged with electronic tags in 4.c showed no evidence
 of northward expansion. This result is discussed in a thermodynamic perspective, with the au-
 thors highlighting that cod within the southern North Sea currently inhabited thermal environ-
 ments that were super-optimal for growth (Neat and Righton, 2007; Righton et al., 2010). These
 cod showed no evidence of a northward dispersal to cooler waters even though they appeared
 to be more than capable of such redistribution (Neat and Righton, 2007; Neat et al., 2014). These
 findings could indicate a local preference for environmental conditions (e.g. temperature, salin-
 ity, depth, bottom type; González-Irusta and Wright, 2016) or reliance on patchily distributed
10 | ICES SCIENTIFIC REPORTS 2:89 | ICES

 prey (e.g. the lesser sandeel, Ammodytes tobianus; Magnussen, 2011), both of which could influ-
 ence the spatial distribution of cod in the North Sea. Further, as temperature effects are often
 expressed on individual-level traits (Gillooly et al., 2001; Neuheimer and Grønkjær, 2012), differ-
 ences in temperature regime will be relevant to the way weight-at-age and maturity-at-age are
 considered in the assessment process. However, there is currently a limited amount of electronic
 tagging data available in the northern and central parts of 4.b which adds uncertainly to conclu-
 sions of a southern-northern divide in North Sea cod.
 Behaviour may also play a key role in the stock structure of cod (Metcalfe, 2006). In a large meta-
 analysis that included cod tagged in the North Sea and adjacent areas, Robichaud and Rose
 (2004) illustrated that, throughout much of its spatial range, cod exhibit four migratory behav-
 iours: sedentary resident, accurate homers, inaccurate homers, and dispersers. Sedentary behav-
 iour is found to be most common (42%), occurring mainly in coastal environments, followed by
 inaccurate homers and dispersers (both 20%). This difference in migratory behaviour could have
 large effects on stock structure and the spatial scale at which management decisions are relevant.
 In the North Sea and adjacent waters, some cod are thought to remain as sedentary residents
 (Norwegian coastal cod; Espeland et al., 2008) while others migrate seasonally between foraging
 and spawning grounds (cod in the southern North Sea; Righton et al., 2007). A similar argument
 is made by Wright et al. (2020) who conclude that cod in 6.a can be split into four populations
 based on behaviour. Three are sedentary and remain in shallow coastal waters (< 100 m) with
 some exchange between southern components and cod in 7.a. In comparison, the fourth popula-
 tion west of Scotland is highly migratory, occupying a spatial range that extends from the deeper,
 more offshore waters of 6.a, east into 4.a and west into 6.b (Wright et al., 2020). Further evidence
 for the extended spatial range of this offshore component is provided by the work of Easey
 (1987). Cod tagged west of the Hebrides dispersed widely along the west coast of Scotland with
 recaptures in 6.a and on the western boundary of 4.a (around Papa Bank). Individuals also
 moved into 4.a, with 8% of recaptures occurring in Moray Firth and central North Sea, but no
 recaptures were made around the Shetland Isles. In comparison, 82% of cod tagged around Papa
 Bank were recaptured near the 4°W stock boundary and in 6.a to the west of Orkney. Further, in
 Wright et al. (2006a) cod released off the North coast of Scotland showed a similar range of move-
 ment, with recaptures occurring in 6.a and 4.a. These studies demonstrate that mixing of cod
 between 6.a and 4a may occur and can be attributed to the presence of an offshore migratory
 population. The tagging data used in Easey (1987) and Wright et al. (2006a, 2020) span the period
 1960–1984, so further work is needed to confirm the temporal consistency of such observations.
 A second key finding by Robichaud and Rose (2004) is that cod biomass exhibits a strong rela-
 tionship with spatial range, with large migratory populations having the largest biomass. Such
 a trend could influence our interpretation of stock structure and stock identification, as reduc-
 tions in biomass may result in range contractions. This topic is discussed in the context of Irish
 Sea cod by Connolly and Officer (2001) who suggest that the movement of cod from 7.a into 7.f–
 g may have become less frequent through time as the abundance of both stocks has declined.
 In the northern North Sea, extensive mark-recovery work has indicated that adult cod located in
 Norwegian coastal waters (northeast part of 4.a; Viking Bank) display high rates of site fidelity,
 with little movement south (Nedreaas et al., 2008). This tendency to remain is further supported
 by electronic tagging results showing that cod from the Viking Bank occupies a unique thermal
 habitat and exhibit low connectivity with other areas (Righton et al., 2010; Neat et al., 2014). The
 resident behaviour of cod in Norwegian fjords justifies there exclusion from the North Sea cod
 advisory unit. However, some tagging data suggests mixing between Viking Bank cod and cod
 that inhabit the shallower waters to the east of the Shetland Isles during the summer foraging
 season (Wright et al., 2006b; Neat et al., 2014). In the northwest of 4.a, cod tagged to the west of
 the Shetland Isles were recaptured locally, with electronic tagging data supporting this pattern
 of residency and high site fidelity (Wright et al., 2006a, 2006b). This is also true of cod tagged and
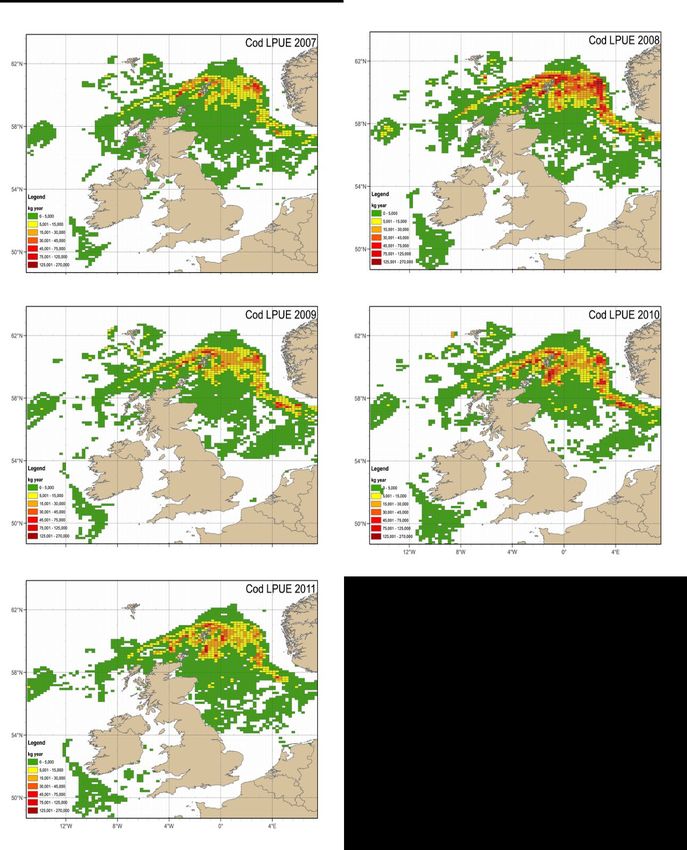
ICES | WKNSCODID 2020 | 11

 released in the Moray Firth and Firth of Forth, with only a few individuals that moved out of the
 area (Wright et al., 2006a, 2006b). These studies suggest that the cod population in 4.a is made up
 of several sedentary resident populations with relatively small spatial ranges and little mixing
 during the spawning season.
 Similarly, high site fidelity has also been found within Norwegian coastal waters of the Skager-
 rak, with up to 98% of tagged individuals remaining within 2 km of their release location (Es-
 peland et al., 2008; Rogers et al., 2014). Some movement from the Skagerrak into the North Sea is
 observed, however, this is relatively rare (less than 2%). Such findings allow the authors to con-
 clude that cod in Norwegian fjords of the Skagerrak are highly sedentary and exhibit fine-scale
 stock structuring at relatively small spatial scales. On the Danish side of the Skagerrak, most
 tagged cod were recaptured locally, but some adults and juveniles were recaptured in 4.c (mostly
 between January to July) and 4.a (August to October), as well as in 3.a.21 (Kattegat; Danielssen,
 1969). A similar trend was observed within Swedish coastal waters of the Skagerrak, with age-1
 and age-2 cod moving from 3.a.20 (Skagerrak) to 4.a–b and from 3.a.20 to 3.a.21 (Pihl and
 Ulmestrand, 1993). These trends along the Swedish coast of the Skagerrak (including the Gullmar
 fjord) and Kattegat are further supported by the recent electronic tagging work of Svedäng et al.
 (2007). Of cod tagged in the Skagerrak, 38% remained resident in the area, 18% moved into 4.a
 and were recaptured there, whereas 28% were recaptured in the Skagerrak after moving from
 3.a.20 into the North Sea and returning. This apparent spawning site fidelity and spawning mi-
 gration are similar to the movement patterns of cod in the southern North Sea (e.g. Righton et
 al., 2007). Contrary to this, 96% of cod tagged in the Gullmar fjord remained resident in the area.
 These results support the hypothesis that cod in different areas of the Skagerrak exhibiting vari-
 able migratory behaviours, and some cod in the Skagerrak have connectivity with the North Sea.

 2.1.2 Re-analysis of historic mark-recapture data
 The available mark-recapture data for tags at liberty at least 90 days (n=6202) were analysed by
 plotting recaptures by ICES division of release (Figure 2.1), maturity, quarter-year and decade
 (Figure 2.2). Cod were mostly recaptured in the same division where they were released (88% of
 cod released in 4.a were recaptured in 4.a, 95% of cod released in 4.b were recaptured in 4.b, and
 68% of cod released in 4.c were recaptured in 4.c). However, a considerable portion of cod moved
 from 4.c to 4.b (28% of cod released in 4.c were recaptured in 4.b), and some cod moved from 4.c
 to 7.d and from 4.a to 6.a. Most (70%) of tagged cod were juveniles (< 68.3 cm), which exhibited
 high fidelity in 4.a and 4.b, but 28% of juvenile cod released in 4.c were recaptured in 4.b. Adults
 dispersed more than juveniles (e.g. most recaptures of adults tagged in 4.c recaptured in 4.b, and
 10% of adults tagged in 4.a recaptured in 4.b). The high residence in 4.a and 4.b was consistent
 among seasons, but movement of cod from 4.c to 4.b peaked at 64% in quarter three (i.e. the
 majority of cod tagged in 4.c and recaptured in quarter 3 moved to 4.b). These general patterns
 appear to be relatively persistent through time, but sample sizes were much greater in the 1960s.
 The net direction and displacement of tagged cod from English and Scottish tag experiments
 generally changed south of the Firth of Forth (in 4.b), and there was little exchange with cod
 further north (Figure 2.3). North of this area, there are both inshore sedentary groups and off-
 shore migratory cod in both the Viking area (northeast North Sea, depths > 100 m) and around
 the Northern Isles (Wright et al., 2006a, 2006b; Neat et al., 2014).
 The same tag-recapture data were also analysed using Kernel Density Estimates (KDE) for the
 Northwest, Viking and South subregions (Figure 2.4). In order to acknowledge the connectivity
 between the northwest unit and 6.a.North (ICES, 2020), a probability density surface for tag-
 recapture data from this region was also included. The data was constrained to recaptures oc-
 curring after at least 90 days but consisted of a mixture of mature and immature fish released
 and recaptured at different times of the year. The choice of smoothing parameter used to produce
12 | ICES SCIENTIFIC REPORTS 2:89 | ICES

 the probability density surfaces followed the recommendation of Fotheringham et al. (2000) to
 define h_opt= (2/3n)^(1⁄4) sd, where n is the number of tag returns for a specific area (Northwest,
 Viking, South, 6.a.North) and sd is the standard distance measuring the dispersion of recaptures
 around the mean centre of recaptures for a given area. To capture the general pattern of move-
 ments of fish released in the considered areas (Figure 2.4), the probability density surfaces for
 50% and 95% of recaptures were generated and presented in Figure 2.5.
 The pattern of movements suggests that cod released in the southern subarea (Figure 2.4) were
 generally recaptured in the Eastern Channel, the Southern North Sea, and the Central North Sea
 but tend not to go further north (Figure 2.5). Cod released in the Viking region were mostly
 recaptured in the same unit, up to the boundary with Skagerrak, with some recaptures to the
 south-east of Shetland where overlap with the Northwest unit occurs. However, cod tagged in
 the Viking area were not recaptured in the Southern North Sea. Northwest cod were mostly re-
 captured in coastal waters of the northeast coast of Scotland and to the south-east of Shetland.
 Finally, cod released in the Northern Offshore region of 6.a were recaptured from the Outer
 Hebrides to the north of Shetland, with likely northern inshore cod entering the Moray Firth. The
 data presented is informative of the general movement patterns of cod released in the different
 areas considered, but caution is advised regarding some limitations of the analysis. Further work
 is needed to address the potential difference in the range of movements of juvenile and adults
 and to consider seasonal patterns of releases and recaptures for inferences of spawning/feeding
 migration. Further, spatiotemporal patterns in fishing effort are not accounted for in the analysis,
 which might result in an overrepresentation of some recapture locations.

 2.1.3 Summary
 Similar to patterns of cod movement observed throughout the North Atlantic (e.g. Robichaud
 and Rose, 2004), some cod groups in the North Sea are relatively sedentary (e.g. adult Viking
 cod, cod in Norwegian fjords of the Skagerrak, and Scottish coastal cod), but others migrate sea-
 sonally between foraging and spawning grounds (e.g. cod in the southern North Sea, 4.c).
 Tagged cod that were recaptured during the spawning season (quarter 1 and quarter 4) were
 typically caught within their release area, whereas recapture outside of their release area was
 much more common during the summer foraging season (quarter 2 and quarter 3). Adults were
 found to displace further than juveniles, moving north into 4.b and southwest into 7.d and 7.e.
 There is connectivity of cod between 4.c and 4.b, and from 4.c into 7.d–e, but cod tagged in 4.c
 rarely moved into 4.a. There is also some evidence of exchange between cod in 4.a and 6.a and
 6.a and 7.a. Future tagging research should address the lack of recent tagging data spanning the
 6.a–4.a boundary, limited tagging data in the central and northern parts of 4.b, and seasonal
 patterns of movement.
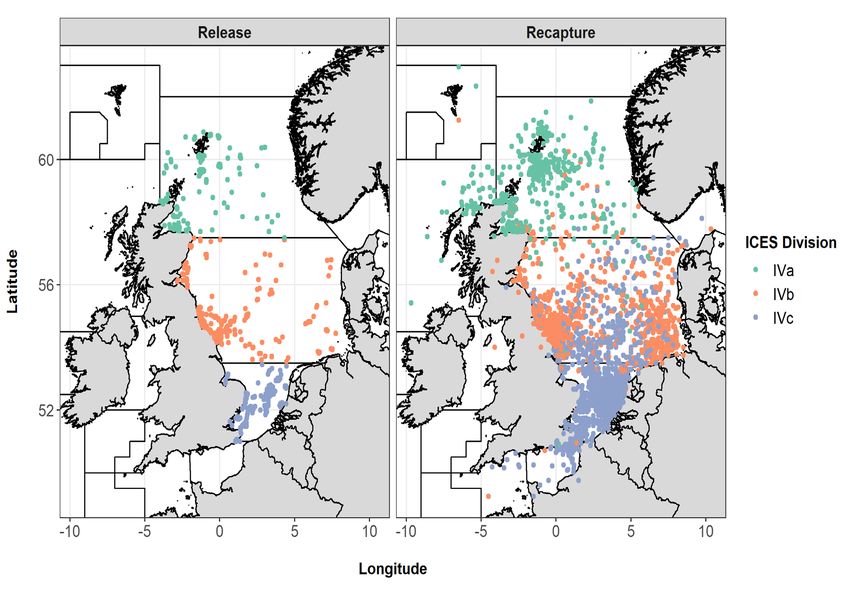
ICES | WKNSCODID 2020 | 13

 Figure 2.1. Releases and recaptures of cod with conventional tags at large at least 90 days by release areas in the North
 Sea, including recaptures of 818 releases from 4.a, 1884 releases from 4.b, and 3500 releases from 4.c.
14 | ICES SCIENTIFIC REPORTS 2:89 | ICES

 Figure 2.2. Observed residence within and movement among ICES Divisions in the North Sea by tagged cod at large at
 least 90 days (all: top left; by maturity, top right; by quarter-year, middle panels; and by decade, bottom panels).
ICES | WKNSCODID 2020 | 15

 Figure 2.3. Net displacement of tagged cod at liberty for ≥ 90days relative to latitude of release (see colour coding). Dots
 represent distribution of tag releases and lines show net displacement to recapture. Data from English and Scottish tag-
 recapture database 1963–2015.

 Figure 2.4. Release locations of cod tagged in 6.a.North (purple), the Northwest North Sea (blue), Viking (red), and the
 Southern North Sea (green).
16 | ICES SCIENTIFIC REPORTS 2:89 | ICES

 Figure 2.5. Probability density surfaces for 50% (light) and 95% (dark) of the recaptures for (a) the Southern subarea, (b)
 Viking, (c) Northwest North Sea and (d) 6.a.North. The number of recaptures are indicated.

 2.2 Scientific surveys (ToR 1 a.ii)
 Species distributions and abundance trends offer basic information for investigating stock struc-
 ture. Fishery-independent data in the North Sea offers high-resolution information on seasonal
 distributions of juveniles and adults, spawning grounds, nursery grounds, and seasonal move-
 ment patterns that are not constrained by fishing patterns (e.g. Pawson and Jennings 1996). Sev-
 eral analyses of survey catches of cod in the North Sea and adjacent areas were available. Most
 studies documented similar shifts in geographic distribution, and some offered interpretations
 on the factors and drivers causing shifting distributions.

 2.2.1 Review of Previous Studies
 Blanchard et al. (2005) tested the hypothesis of an ideal free distribution for North Sea cod, de-
 termining if young cod contract to optimal or near-optimal habitats as stock size declines. Tem-
 perature was used as a proxy for habitat suitability. Young cod followed the assumptions of the
 ideal free distribution model. During years of low abundance, cod concentrated in areas of high-
 est suitability, but cod were more widely dispersed and occupied areas of less suitable habitats
 during years of high abundance. The area of high suitability diminished as North Sea tempera-
 tures increased over the study period (1977–2002), which did not include the recent divergence
 in stock dynamics between northern and southern North Sea (Figure 1.1). One implicit assump-
 tion of the ideal free distribution is that there is no stock structure or barriers to movement, which
 does not appear to be valid for North Sea cod.
 Lewy and Kristensen (2009) quantified the spatial distribution of cod in the North Sea and Skag-
 errak. In contrast to the result for young cod reported by Blanchard et al. (2005), the concentration
ICES | WKNSCODID 2020 | 17

 of the stock did not increase when stock abundance decreased. The centre of gravity of the dis-
 tribution moved to the northeast, and the concentration of the stock was constant or declined,
 but the spatial correlation and dispersion of cod catches were relatively constant during winter
 throughout the period. The study demonstrates the changes in distribution within the North Sea
 and Skagerrak, which may reflect different trends in abundance among subareas.
 Rindorf and Lewy (2006) investigated potential causes of a shift in the distribution of cod, in-
 cluding climate, abundance, distributional history of cohorts, site fidelity and fishing mortality.
 The centre of gravity of North Sea cod moved north during a series of warm and windy winters
 that affected the distribution of eggs, larvae, and settlement. The model for spawners included
 effects for both displacements the previous year and displacement as juveniles, which could be
 interpreted as homing of adults to where they were spawned. The authors implied that the lack
 of conclusive genetic evidence for separate spawning populations at the time (Hutchinson et al.,
 2001) could follow from minor inaccuracies in homing that lead to genetic mixing. Warm tem-
 peratures could also have resulted in disproportionately large decreases in the survival of cod
 larvae in the south-eastern North Sea. The time-series analysis showed a spawning stock con-
 sisting of few age groups to be more susceptible to a lasting change in displacement over a
 greater range of parameter combinations. Fishing mortality at the scale of the North Sea was not
 directly correlated with displacement of any age groups but decreased the number of older fish
 and likely increased the sensitivity of the distribution to climatic changes. The models were fit
 to data on a North Sea scale, but the centre of gravity cannot explicitly represent local popula-
 tions or stock identity, which were not the aim of the study. The study provides some evidence
 and mechanisms for the displacement of early life stages shifting the distribution and homing of
 adults maintaining it. The time-series results suggest that the poor state of the stock has exacer-
 bated this shift, but no potential mechanisms are provided to explain this behaviour.
 Svedäng and Svenson (2006) evaluated the abundance and distribution of cod in the Eastern
 Skagerrak from coastal surveys to understand the degree of connectivity between cod subunits,
 and to identify structuring elements for cod relating to behaviour (e.g. juvenile dispersal, hom-
 ing) for explaining reproductive isolation in the absence of hydrographical boundaries. Survey
 data were analysed for 2000–2005, mostly May-October, from the Swedish Eastern Skagerrak
 coast, with age-length keys from the International Bottom Trawl Survey (IBTS), which may have
 biased ageing for local populations with different growth patterns). The cod resource along the
 eastern Skagerrak coast had a low number of adults despite a large abundance of juveniles. De-
 spite recruitment and reduction of fishing effort, no recovery was observed. The available liter-
 ature suggests homing behaviour in other cod populations in the Northeast Atlantic. Therefore,
 the loss of cod in the eastern Skagerrak may not result from a shortage of recruits but rather from
 a shortage of local recruits. These findings support a view on cod populations as essentially be-
 havioural entities with natal homing, whereas dispersal of early life stages may be less important
 as a structuring mechanism. Núñez-Riboni et al. (2019) concluded that the eastern Skagerrak is
 a boundary region for changes in thermal suitability of the habitat. Therefore, environmental
 conditions in the eastern Skagerrak may have changed over time and could have contributed to
 emigration.
 Núñez-Riboni et al. (2019) investigated the historical-geographical distribution of cod in the
 North Sea and the relationship to thermal habitat suitability. Models using climate change pro-
 jections were evaluated to determine future thermal habitat suitability for cod. Distribution of
 cod was based on quarter 1 North Sea IBTS data, and bottom temperature data were from quarter
 3. Thermal habitat suitability for cod generally improved in the northern areas and decreased in
 southern areas of the North Sea. These trends are predicted to continue in the coming decades
 under climate change scenarios. The Skagerrak, the central and northern North Sea, and the edge
 of the Norwegian trench are expected to remain thermally suitable for cod throughout the 21st
 century. The results indicate that the decadal displacement of North Sea cod can be explained
You can also read