CHERKASY REGION DEVELOPMENT STRATEGY 2020 - Invest In ...
←
→
Page content transcription
If your browser does not render page correctly, please read the page content below

CHERK ASY
   REGION
DEVELOPMENT
  STR ATEGY
    2020
ADDRESS TO CITIZENS
    Dear Cherkasy community.
    The history of independent Ukraine turned a new page last
year. The Revolution of Dignity supported by the people of Ukraine
has lead to the signing of the Ukraine-European Union Associa-
tion Agreement. This agreement gives our country the possibility
to move from partnership and cooperation to political association
and economical integration.
    Together we made an important choice to implement European
standards of life and social values.
    We understand that this goal cannot be reached immediately.
It requires tremendous efforts and consistent unanimous actions.
Only joint efforts with a clear roadmap will drive Cherkasy forward
to the European level of life.
    Cherkasy Region Development Strategy 2020 should become
such a roadmap for us. We created it together with you. This is not
an ordinary «government for the sake of government» strategy,
but a meaningful document written by community and for com-
munity.
    The Strategy is designed taking into account public opinion
and expert opinions of specialists, scientists and business repre-
sentatives. It was created based on the analysis of the results and
mistakes of previous policy documents.
    For the Strategy development we used the regional develop-
ment planning guidelines stated in the European Union Program
«Support to Ukraine’s Regional Development Policy».
    The Strategy concerns everyone. It determines such directions
of regional development that will promote creation of new work-
places, consolidation of the civil society, improvement of life qual-
ity in the cities and on rural territories.
    Local communities have a special role. The level and quality
of the Strategy implementation depends on the active position
of local communities, their participation in projects and actions
implementation. Strong and efficient local communities are a cor-
nerstone of prosperous Cherkasy region!
    We believe that Cherkasy development Strategy implementa-
tion is our joint responsibility. We are not afraid of difficulties. We
move on for the sake of well-being of present and upcoming gen-
erations.
    We are faced with the difficult task of the Strategy implemen-
tation.
    May we have success in achieving this goal!

   Head of Regional State
   Administration
CHERKASY
REGION
DEVELOPMENT
STRATEGY
2020
                     ABBREVIATIONS........................................................................................... 3

              1.     INTRODUCTION............................................................................................ 4

              2.     APPROACH, METHODS AND THE PROCESS
                     OF THE STR ATEGY DEVELOPMENT................................................. 6

              3.     SUMMARY OF THE REGIONAL
                     SOCIO -ECONOMIC DEVELOPMENT................................................12
              3.1.   General characteristics of the region......................................................13
CONTENTS      3.2.   Natural resources of the region................................................................. 14
              3.3.   Demography and workforce.......................................................................15
              3.4.   Infrastructure....................................................................................................18
              3.5.   Economy and business..................................................................................22
              3.6.   Finance and budget sector..........................................................................28
              3.7.   Ecology................................................................................................................29
              3.8.   Cherkasy region positioning among other regions of Ukraine.....30

              4.     MAIN FACTORS AND SCENARIOS
                     OF REGIONAL DEVELOPMENT..........................................................34
              4.1.   SWOT-analysis of the region.......................................................................35
              4.2.   SWOT-matrix of the region.........................................................................37
              4.3.   Comparative advantages, challenges and risks of the region......40
              4.4.   Substantiation of regional development scenarios..........................42

              5.     MISSION AND STR ATEGIC VISION
                     OF REGIONAL DEVELOPMENT..........................................................46

              6.     STR ATEGIC AND OPER ATIONAL GOALS
                     AND OBJECTIVES........................................................................................48
              6.1.   Strategic goal 1.
                     The improvement of the competitiveness of the region................ 51
                     Operational goal 1.1. Stimulating the investment attraction.......52
                     Operational goal 1.2. The improvement of energy efficiency .....54
                     Operational goal 1.3. The improvement of regional
                     development management.........................................................................56
                     Operational goal 1.4. The creation of favorable conditions
                     for the small and medium businesses development........................58
                     Operational goal 1.5. The development of tourism
                     and recreation industry................................................................................61
              6.2.   Strategic goal 2. The development of rural territories....................63
                     Operational goal 2.1.The diversification of agricultural
                     production structure and improvement
                     of products processing..................................................................................64
                     Operational goal 2.2.The development of rural territories
                     and suburbs around cities and towns.....................................................67
              6.3.   Strategic goal 3. Human capital development....................................68
                     Operational goal 3.1. The improvement of the population
                     adaptability to the needs of the labor market....................................70
                     Operational goal 3.2.The improvement of awareness
                     and social activity of the regional population....................................72
              6.4.   Strategic goal 4. Environmental safety and conservation.............75
                     Operational goal 4.1.The creation of conditions
                     for the improvement of environment..................................................... 76
                     Operational goal 4.2.The improvement of waste management..77
                     Operational goal 4.3.The development of the ecological..............79

2
network, nature reserve fund, conservation of biological
       and landscape diversity
       Operational goal 4.4.The improvement of the water objects
       and atmospheric air condition...................................................................80

7.     STR ATEGY IMPLEMENTATION AND MONITORING.............82

8.     CONSISTENCY OF THE STR ATEGY
       WITH POLICY AND STR ATEGIC DOCUMENTS........................88
8.1.   Consistency with State strategy of the regional development....89
8.2.   Consistency of the Strategy with the main aspects
       of regional development..............................................................................90

       SWOT –             the analysis of strengths and weaknesses,
                          favorable opportunities and threats                                                    ABBRE VIATIONS
       NPP –              Nuclear Power Plant
       AIC –              Agro-Industrial Complex
       RDA –              Regional Development Agency
       ATO –              Anti-Terrorist Operation
       ATR –              Administrative-Territorial Reform
       GDP –              Gross Domestic Product
       TEA –              Type of economic activity
       HEI –              Higher Educational Institution
       MIC –              the Military-Industrial Complex
       GRP –              Gross Regional Product
       HPP –              Hydropower Plant
       State
       Standards – State sanitary rules and norms
       NSRD –     National Strategy for Regional Development
       EU –       European Union.
       HCS –      Housing and Communal Services
       MM –       Mass Media
       GPFM –     General Practice of Family Medicine
       LU –       Law of Ukraine.
       IT –       information technology
       SMB –      small and medium businesses
       RSA –      Regional State Administration
       LSGB –     Local Self-Government Bodies
       UN –       United Nations
       HC –       Housing cooperative
       PSOB –     Public Self-Organization Body
       VEI –      vocational education institutions
       WG –       Workgroup
       DSA –      District State Administration
       SPP –      Solar Power Plant
       BE –       Business Entity
       TPP –      Thermal Power Plant
       MSW –      municipal solid waste
       NPE –      natural person-entrepreneur
       ASC –      Administrative Services Center

                                                                                                                             3
1 INTRODUCTION

The Revolution of Dignity and the struggle for the freedom of
                                                                          INTRODUC TION
Ukraine created a new social paradigm. Ukraine is moving into a
new period of its history and Ukrainian people have a chance to
turn Ukraine into a country of European standards.
   The processes of decentralization, change of approaches to re-
gional development are aimed at strengthening the role of local
communities and authorities. The tendency to use own resources
efficiently and improve local cohesion is becoming more and more
important.
   The main document of mid-term regional development is «Cher-
kasy Region Development Strategy 2020».
   The Strategy is developed on the basis of the Law of Ukraine
«On Stimulation of Regional Development», taking into account the
State strategy of regional development of Ukraine, the Strategy for
Sustainable Development «Ukraine – 2020» and other documents,
using the best European and Ukrainian experience and the expe-
rience of implementing «Cherkasy Region Development Strategy
2015».
   This Strategy was designed using the developments of local and
foreign science, public opinion, expert advice on solving the prob-
lems and reaching the goals of regional development. The Strategy
implementation is possible by involving public authorities, popula-
tion, business and social organizations.
   The Strategy is based on target-oriented and project-based ap-
proaches of solving the problems of the region.
   The development of the Strategy became an important tool of
establishing social partnership between the Regional State Admin-
istration (RSA), Regional Council, district administrations, city and
district councils, universities and institutes and a wide range of civ-
ic organizations. The fact that the Strategy has been arrived at by
involving all the stakeholders ensures the social support for the
implementation of the Strategy programs, actions and projects.
   The Strategy has an ambitious goal to turn Cherkasy region into
an example and model of regional reform, to create a harmonious
region of sustainable development, where innovative high-tech in-
dustry, ecological agriculture, recreational and historical tourism,
high quality of life and safe environment.
   The Strategy determines the goal, the vectors of social and eco-
nomic reforms, priorities, indicators of formation and development
of the region.
   The adoption of this document should become the basis for stra-
tegic planning in the region, for regional programs adjustment and
their harmonization with the prospects determined by the Strategy.

                                                                                     5
2   APPROACH,
    METHODS AND
    THE PROCESS
    OF THE
    STR ATEGY
    DEVELOPMENT
Strategic planning is a structural means for managing changes
and reaching consensus in the region, creation of common vision of                 2    APPROACH,
                                                                                        METHODS AND
                                                                                        THE PROCESS OF
future development, a constructive way of identifying the problems                      THE STR ATEGY
and harmonizing of the goals, tasks and strategies that need to be                      DE V ELOPMENT
implemented to solve them. Strategic planning is also a powerful
tool of uniting the efforts of both business and local authorities
for creating public-private partnerships. It has a positive effect on
local business sphere and competitive status of the community, in-
fluences solving other problems in relation to the living standards
of every citizen.
   The process of the Strategy development was of ascending char-
acter. It was outlined by the workgroup that defined the ways of
development and areas of implementation of actions.
   Terms of planning tools were determined on the basis of the
combination of a long-term strategic plan and medium-term cycles
of its implementation. Strategic goals and actions are determined
in such a way and they have character of long-term (6 years) ways
of development, while programs are aimed at the implementation
of high priority tasks (3 years). Actions are the key component of
the Strategy and determine scenarios and ways of reaching strate-
gic goals.
   Strategy development was based on the following principles:

Partnership                 The character of the strategic development is based on the results of both,
                            the varied consultations, aimed at reaching the consensus, and the reasonable
                            community expectations. All the stakeholders (authorities, businessmen, sci-
                            entific organizations, entrepreneurs associations, enterprises and community
                            members) were invited to take part in decision-making and developing the
                            strategic goals.
The principle of joint      It provides a broad social consensus and evident public support for the Strat-
participation of public     egy. All steps were worked out in the way excluding the excessive influence
and private sectors         of the development process members, involving specified persons, who adopt
                            decisions of the stakeholders, experts, members of social organizations etc.
Viability                   The basis of providing viability is to keep proper balance and consistency of
                            internal components of the Strategy (goals, actions). Another way of providing
                            viability is to develop comparative advantages determined according to the
                            SWOT-analysis results (developing of opportunities that soften evident flaws
                            and drawbacks). Besides, we apply the matrix of weak points and threats to
                            detect the synergy links between them that can negatively affect the viability
                            (for risk management).
Integration                 It was provided in two ways: 1) integration of common local needs on region-
                            al level based of territory and content. It means that achieving any regional
                            goal will also show on the local level. Integration is possible due to active
                            participation of stakeholders. 2) integration as a multidimensional plan of de-
                            velopment of high-priority sectors and areas of activity ensures elimination of
                            conflicts and negative effects. In such a way integration provides focusing on
                            compatibility and synergy of actions.
Innovation                  Applied as a principle in the process of projects identification and mostly con-
                            cerns suggested approach and the most efficient using of available resources.

                                                                                                          7
The hierarchy              Strategic plans of higher level have more general character and lay the foun-
of strategic plans         dation for lower lever actions to be determined.
The institutional memory   Creation of the project of the Strategy was based on the results achieved dur-
                           ing development of previous strategic documents, in particular, the Strategy
                           of Cherkasy regional development till 2015.
Subsidiarity               Determination of the strategic actions, starting from the lowest level (based
                           on the local communities needs), was carried out using the resources of re-
                           gional development.

                              STAGES OF THE STR ATEGY DE VELOPMENT
                              1. Organization of the work
                              Workgroup (WG) is a group of people that create the strategic
                           plan of regional development. During the sessions WG present and
                           discuss all areas of work and adopt appropriate decisions. In or-
                           der to arrange narrow specialization discussion they conducted fo-
                           cus-groups work (consisting mainly of WG-members).
                              2. Implementation of socio-economic analysis and SWOT-analysis
                              The starting point of the process of the Strategy development is
                           statistics inventory. The strategic analysis is more important than
                           examination of statistics indexes, as it implies estimation of struc-
                           tural, political, economical and social conditions. In this meaning
                           quantitative and empirical aspects have close relation to qualita-
                           tive aspects.
                              Considering Cherkasy region specificity socio-economic analysis,
                           comparative advantages, challenges and risks are the basis of the
                           strategic planning. They combine regional needs and ways of prob-
                           lems solving.
                              After analysis of the situation we commenced the potential anal-
                           ysis of Cherkasy region. This work was based on the SWOT-analysis.
                           In practice WG defined strengths of the region, ways of develop-
                           ment, weaknesses and external threats. During the sessions WG
                           conducted brainstorms aimed at defining the synergetic interaction
                           of factors within each SWOT-analysis components which was aimed
                           at defining of strategic orientation, comparative advantages and
                           providing of risk-management.
                              Detected strong and weaknesses, opportunities and threats set
                           the clear view of the current situation, problems and potentials of
                           the regional development, and therefore become a bridge between
                           socio-economic analysis and the Strategy. Moreover, the orienta-
                           tion of the Strategy and the main components of the strategic goals
                           become evident in the end of this stage.
                              The results of the implementation of the stage are the following:
                           1) The socio-economic analysis of Cherkasy region; 2) SWOT-anal-
                           ysis and SWOT-matrix; 3) Comparative advantages, challenges and
                           risks of the region; 4) the scenarios of regional development.
                              External and internal analyzes provide defining of main prob-
                           lems of the of the economical r4egional development and together
                           with the Regional Profile data serve for the formulation of the stra-
                           tegic directions and goals of development till 2020.

8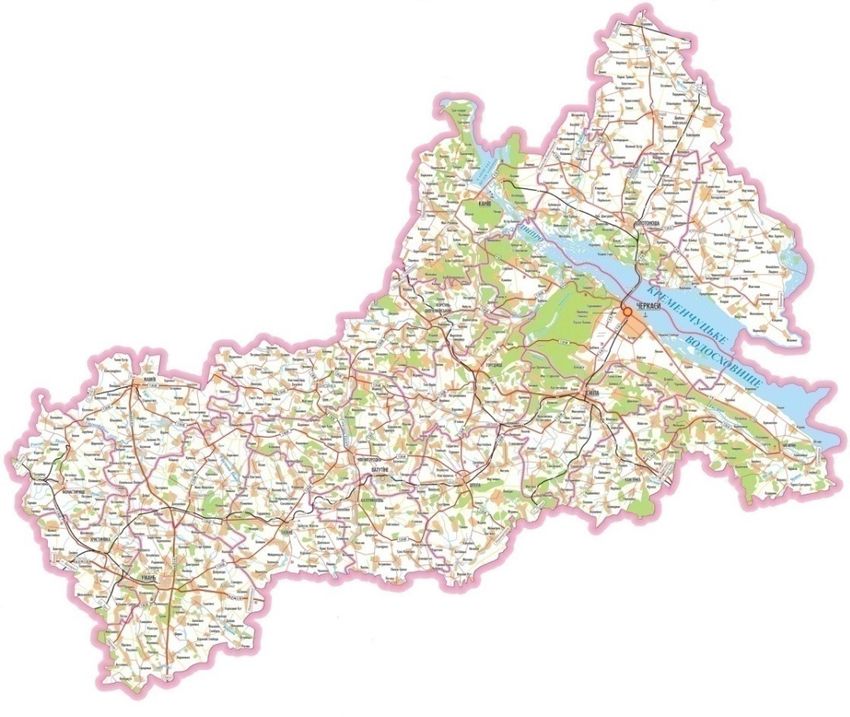
3. Defining of the strategic Vision
   WG define the strategic Vision of the regional development. The        2   APPROACH,
                                                                              METHODS AND
                                                                              THE PROCESS OF
Vision is an expected status of the socio-economic system in the              THE STR ATEGY
future that can be indicated by the specific date. The correct for-           DE V ELOPMENT
mulation of the Vision with precise indication of components of the
general goal of development is very important for the successful
implementation, further monitoring and estimation of its fulfill-
ment.
   The strategic Vision reflexes the status of the region achieved
as the result of the Strategy implementation and shows that very
specific result expected to happen in future.
   4. The formation of strategic and operational goals with appro-
priate actions
   The strategic goals were determined in the most general fea-
tures at least for 6 years. This term was defined to create the strate-
gic platform for cycles of implementation with duration of 3 years
each and to avoid necessity of repeating the process of the strategy
development for interim period and checking the plans viability in
the long-term prospect. The strategic goals were determined on
the basis of comparative advantages of the region taking into ac-
count the challenges, and possible obstacles and risks during the
development.
   Operational goals were determined as landmarks during achiev-
ing of the strategic goals that imply the implementation of neces-
sary actions.
   These actions were determined in order to achieve appropriate
strategic goals till 2020. Mentioned actions of the strategic goal are
bound to the operational goals in order to form the precise struc-
ture of all components of the Strategy. In general, actions consti-
tute the combination of the regional actions (development projects)
and reforms which create the basis for the further development of
the potential and achievement of goals.
   The most important result of the process of the Strategy build-
ing is: responsibility for Strategy at the regional and local levels,
improving of partner-groups capacity, their accountability and re-
sponsibility for implementation.
   The creation of the Plan of the Strategy implementation also
begins at this stage. The Plan is based on the determined strategic
and operational goals (after their adoption). Working subgroups co-
ordinate specific actions that should be taken in order to reach the
general and specific goals. Tasks imply defining of group members
liable for terms of the implementation and defining of the neces-
sary resources. The Plan of the implementation is developed ac-
cording to each strategic and operational goal and submits «the
goals tree». It is formed by the «general-to-specific» principle and
bears the high level of detalization.
   5. The public discussion and adoption of the Strategy
   Having the Strategy and the implementation Plan developed WG
initiate public auditions (or other forms of public discussions). After

                                                                                          9
CHERKASY a public discussion the revised Strategy is submitted and adoption
REGION to Cherkasy regional Council as the main document with the de-
DEVELOPMENT fined policy of the economic development of Cherkasy region.
STRATEGY 6. Monitoring and implementation
2020 It is necessary to create the system of monitoring of its imple-
mentation in order to provide the appropriate level of responsibility
for the Strategy implementation. Such a system should include the
Monitoring Authority, the Document (Regulations) about the sys-
tem of monitoring of the Strategy implementation.
In general, the Strategy is the basis for its implementation
through projects of regional development that emerges from the
operational goals of the Strategy, and the base for adoption of ad-
ministrative and budget decisions in the areas of regional develop-
ment.
103 SUMMARY
OF THE REGIONAL
SOCIO -ECONOMIC
DEVELOPMENTCherkasy region was founded on January 7, 1954. 3.1.
Cherkasy region is located in the central forest steppe part of GENER AL
Ukraine, in the middle reach of the Dnipro and Southern Bug. it CHAR AC TERISTICS
borders on Kiev region in the North (340 km length), Poltava region OF THE REGION
in the East (212 km length), Kirovohrad region in the South (388 km
length) and Vinnytsia region in the West (124 km length).
Fig.1. The map
of Cherkasy region
Cherkasy region area is 20.9 thousand sq. km. It is 3.5 % of the
territory of the State (18th place in Ukraine). The population is
1,259.9 thousand people.
The region is mainly flat and conditionally divided into two
parts: right-bank and left-bank. The vast part of right-bank is locat-
ed within the Dnipro Upland with the highest top of the region 275
m above sea level (near Monastyryshche). On the adjoining part of
the Dnipro we can find Irdyn-Tyasmyn swampy lowland and Kaniv
hills. The left-bank part of the region has lowland relief as it is sit-
uated within Dnipro Lowland.
According to the political division the region consists of 20 dis-
tricts, 6 cities of regional subordination (Cherkasy, Vatutine, Zoloto-
nosha, Kaniv, Smila, Uman), 10 cities of district level, 15 urban-type
settlements, 824 rural settlements.
The most populated localities within the region are the follow-
ing cities: Cherkasy (286ths. people), Uman (86 600 people), Smila
(68 700 people), Zolotonosha (29 300 people) and Kaniv (25 300
people).
13CHERKASY
REGION
DEVELOPMENT
STRATEGY
2020
Fig. 2. The political
division of Cherkasy
region
Part of the region refers to the zone of radioactive contamination
in consequence of the Chernobyl accident. This part includes 4 local-
ities listed to the unconditioned zone of obligatory resettlement, 99
localities listed as the zone of guaranteed voluntary resettlement.
3.2. Cherkasy region has temperate continental climate that means
NATUR AL mild winter with frequent thaws, warm summer. All this is favorable
RESOURCES for the development of agricultural production.
OF THE REGION The agricultural area makes up 1,486.9ths.ha of the 2,091.6ths.
ha of the general area of Cherkasy region. The farmland makes up
1,450.8ths.ha of the general area of the region (69.4% of the region
area). The agricultural land is of 338,600 ha. The built-up land of
the region makes up 84 500 ha. There are 15 500 ha of open land
with no vegetation or with a slight one. 138,800 ha are under wa-
ter. Open swampy land makes up 30,400 ha.
The soil cover is mainly formed of typical black and heavily de-
graded soils that occupy 53.7% of the soil. Thereby, the region has
the strongest background for the organic agricultural production
development.
The area of the region has deposits of fossil fuels, ore (metallic),
non-metallic minerals and mineral waters.
The region is rich in non-metallic minerals (granite, clay such as
bentonite, kaolin), quartz sand. The stock of coal and peat is the
main fuel resource of the region.
In Cherkasy region, there are 257 mineral deposits including 250
of local importance and 7 deposits of the State importance.
The forest of the region is of flat type and is listed to the forest
14steppe zone. In general, the climate of the region is favorable for
growing of a wide range of tree and shrub species and, first of all, 3 SUMMARY OF
THE REGIONAL
SOCIO -
high-performance oak and pines. ECONOMIC
Cherkasy region is located in two main Dnipro and Southern Bug DE V ELOPMENT
river basins: the Dnipro basin is 12 000 sq. km. and Southern Bug
basin is 8 900 sq. km. The density of the river network is well-de-
veloped and makes up 0.2-0.54 km./sq.km.
Fig.3. Map of mineral and
raw material resource ob-
jects of Cherkasy region
Fig.3.
The Map of mineral
biggest reservoirand raw material
is located resource
on the Dnipro. It isobjects of Cherkasy region
Kremenchug
Reservoir with the general area of water surface of 2 252 sq.km and
the full capacity of 13,520 million cu. m.
Natural areas of the region make up 527 territories and objects
of Nature reserve fund.
Public accounting includes 9,078 historical monuments, of
which: 7,169 in archaeology, 1,552 in history, 184 in architecture,
173 in monumental art. 93 monuments are of national importance
and the rest are of local importance.
On the territory of Cherkasy region there are 9 national and
state history and culture and natural funds, and National arbore-
tum «Sofiyivka».
Since the formation of Cherkasy region, the population had been in- 3.3.
creasing and fetched up its top figure of 1,531.6ths. persons in 1990. DEMOGR APHY
As of 01.01.2014 this number makes up 1,259.9ths. persons of which AND WORKFORCE
712.4 (56.5%) live in urban localities and 547.5 (43.5%) live in rural set-
tlements. The population density of the region is 60.3 people per sq.km.
15CHERKASY Despite some improvement the demographics stays complicat-
REGION ed. The general birth rate (9.6‰) is lower than average in Ukraine
DEVELOPMENT (11.1 ‰), and mortality rate is one of the highest in the country (in
STRATEGYFig.3. Map of mineral and raw material resource objects of Cherkasy region
the region 16.2‰, in Ukraine – 14.6‰).
2020
Fig.4. The total birth rate The determinative factor of population decrease is natural
in Ukraine in 2013 (per 1 reduction.
Fig.4. The total birth
thousand of population) rate in During
Ukraine 2013 the
in 2013 number
(per of population
1 thousand decrease
of population)
by 8,900 people (by natural reduction population decreased
by 8,400 people, by migratory reduction it decreased by 500
people).
According to Ukrainian Population Census the portion of Ukrain-
ians in the ethnic composition is 93.1%, so Cherkasy region is mo-
no-national.
The gender structure of the population is characterized by wom-
en prevailing under men. As of 01.01.2014 the number of wom-
an fetched up the number of 681,900 people (54.3 of the general
amount of the resident population), the number of men reached
574 400 people (45.7%).
The average age of the region is 42.1 that is higher than the av-
erage age in Ukraine (40.6).
During the last five years the level of employment of people at
the age of 15-70 grew from 57.3% in 2009 to 59.9% in 2013.
According to the methodology of the International Labor Or-
ganization, the level of unemployment of people at the age of
15-70 in the region decreased by 1.9% (from 10.8% in 2009 to
8.9% in 2013).
Cherkasy traditionally contributes to the development of the
system of scientific staff training. There are 8 institutions of
16higher education of III-IV levels of accreditation, 23 education-
al institutions of I-II levels of accreditation (5 universities, 3 3 SUMMARY OF
THE REGIONAL
SOCIO -
institutes, 17 colleges, 2 specialized schools, 4 technical col- ECONOMIC
leges). DE V ELOPMENT
Two universities are of national importance. At the beginning Fig.5. The total mortality
of 2013-2014 rate in Ukraine in 2013 (per
Fig.5. The academic year inrate
total mortality theinhigher educational
Ukraine institutions
in 2013 (per 1 thousand 1ofthousand
population)
of population)
there were 44,500 students: 33,700 students in the institutions of
Fig.5. The total mortality rate in Ukraine in 2013 (per 1 thousand of population)
Fig.6. The division of sus-
tainable population of the
region by gender and age
Fig.6. The division of sustainable population of the region by gender and age
17
Fig.6. The division of sustainable population of the region by gender and ageCHERKASY III-IV levels of accreditation, 10 800 students in the institutions of
REGION I-II levels of accreditation.
DEVELOPMENT Compared to neighboring regions (Vinnitsa, Kiev, Kirovograd and
STRATEGY Poltava), the highest number of scientific organizations is in Cher-
2020 kasy region, the lowest is in Kirovohrad region.
3.4. THE TR ANSPORT INFR A STRUC TURE
INFR A STRUC TURE The specific location of the region (Cherkasy is situated in the
geographical center of Ukraine, on the cross of international air,
transport ways and main railway junctions, near the main waterway
of the country the Dnipro River) introduces the possibility of the
transport structure development.
The region hosts international transport corridors «Crete number
9», which coincides with the highway M-05 (E-95) Kyiv – Odesa and
corridor «Baltic Sea – Black Sea», which coincides with roads M-05
Kyiv – Odessa and M-12 Stry – Ternopil – Kirovograd – Znamianka.
Fig.7. The map of the The sufficiency of roads per 100sq. m. area in the region is 293.6
Cherkasy region roads Fig.7.
km, Thethe
while mapaverage
of the Cherkasy region
for Ukraine roads
is 280.5 km.
The index of roads density in the region is 0.29 km per 1 sq.km
that is more than the average in Ukraine (0.28 km per 1 sq.km.).
As of 01.01.2014 the length of road network of Cherkasy re-
gion is 19 286.6 km, of which 13 143.8 km is the carrying length of
streets and communal roads in settlements, the length of public
roads is 6 142.8 km.
18Services of passenger traffic in the region are provided by 32
companies, serving 375 routes and 64 private entrepreneurs, serv- 3 SUMMARY OF
THE REGIONAL
SOCIO -
ing 176 routes. Passengers have the opportunity to use the services ECONOMIC
of one bus terminus, 30 bus stations and hundreds of bus stops, DE V ELOPMENT
which are located in the rural settlements and along the bus routes
of public use.
The services of railway transportation in the region are provided
by the Shevchenko management of railway transportation of the
Odesa Railway, Kozyatyn and Darnytsya management of transpor-
tation of the South Western Railway.
River transport is an important sector of the economy that has a
great potential in the region, especially in combination with other
branches of transport (air, road, river). The region hosts 150 kilom-
eters of operating navigable river ways.
Unfortunately, the field of air transport is in decline. However, dur-
ing 2010-2014 Cherkasy Airport is saved, which allows its full rehabili-
tation. The capacity of runway allows taking cargo aircraft IL-76.
THE ENERGY SEC TOR
The actual production of electricity in 2013 in the Cherkasy re-
gion was 2,1 bln. kWh. when consumed 3.1 billion. kWh. The biggest
part was produced by the Kaniv HPP (55.7%), the second powerful
energy company is Cherkassy CHP which produced 40.2%. Cherkasy
Fig.7. The
region is in the list of regions map of with
of Ukraine the Cherkasy region roads
energy shortage.
Fig.8. Map of location of
power generating capacity
of the Cherkasy region
Fig.8. Map of location of power generating capacity of the Cherkasy region 19CHERKASY Today, the existing power supply system in the region does not
REGION meet the reliability.
DEVELOPMENT Cherkasy region is among the five regions of Ukraine (together
STRATEGY
2020 with the Vinnitsa, Zhitomir, Khmelnitsky and Poltava), where there
are the most of existing small hydropower plants.
Since 2011, three solar power stations (SPS) were commissioned.
There also are 6 cogeneration plants in the region.
HOUSING AND UTILITIES
In Cherkasy region district heating services are provided by 19
thermal power plants.
There are 162 boiler houses: 130 local council boilers and 32 depart-
mental boiler houses. 471 boilers are operated in the field of municipal
heating boiler houses. 91% of boiler plants is running on natural gas.
The length of heating networks in double pipe calculation is
550.4 kilometers.
Losses in heating system pipelines are 13%. Total depreciation
of heat networks in the region is 70 percent.
The length of water supply networks area is 4 015.8 km, of which
853 km (21.3%) is in disrepair. In 2014 the emergency networkwere
decreased by 2%. Water sector facilities operate 528 pump units, 198
units of which (38%) are in emergency state and require replacement.
Water in most areas is from the underground sources, though, in
Zvenyhorodka and Korsun-Shevchenkivsky it is taken from the open
water reservoirs and in Cherkasy andUman there is mixed water
supply system.
The quality of drinking water in nine areas of the region (in Zolo-
tonosha, Vatutine, Kamenka, Horodyshche, Chyhyryn, Talne,Kat-
erynopil, Chornobay, Mankivka) does not meet the requirementsof
State Standards «Hygienic requirements to drinking water intended
for human consumption»2.2.4-171-10. Year after year, the terms of
permits of its supply with deviation from the existing standard are
prolonged but measures to improve this situation are not carried
out due to the large financial costs for their implementation.
The length of sewerage networks of the region is 1 166.5 km.
Total housing area of the region is 34 077.0ths. sq.m.
Today in the region there are 445 registered condominiums, rep-
resenting 11% of the total amount of multi-storey buildings.
CONSTRUC TION
There are 702 construction companiesin the region. In 2009-
2013 these companies made construction works which cost 3 312.2
million UAH and put 7267 facilitiesinto operation.
In 2013 the amount of put into operation housing was 129.7ths.
sq.km of total area. According to the pace of putting the dwell-
ingsinto operation (in 2013) the region took the 6th place among
the neighbor-regions and some regions which belong to the same
region typology.
87.1% of the total housing in cities and districts of the region is
made by individual developers, indicating a slight amount of multi-
family housing construction.
20EDUC ATION
At the end of 2013 the total number of educational institutions 3 SUMMARY OF
THE REGIONAL
SOCIO -
fetched up the number of 1,460 units – 30 higher (8 – III-IV levels ECONOMIC
of accreditation and 22 – I-II levels of accreditation), 23 vocational, DE V ELOPMENT
659 secondary, 55 establishments of additional education of chil-
dren and 693 pre-school educational institutions.
The percentage of coverage of all forms of pre-school education
for 3-7-olds has increased from 70% in 2009 to 97.7% in 2013 (27.7%).
At the end of 2013 642 secondary schoolsfunctionedin the re-
gion, which enrolled 109.3 ths. students (in 2009 – 685 secondary
schools and 125.5 ths. students).
Today there are 87 educational districts in the region (during
2009-2013 there were created 58 educational districts) where the
supporting educational institutions introduced an appropriate edu-
cational material base.
In 2013, educational institutions have been provided with 11 053
computers. All of the educational institutions of the region are con-
nected to the Internet.
The students’ transportation to place of study is provided by 168
school buses.
Since 2009 the network of establishments of additional educa-
tion for children has been reduced from 57 in 2009 to 55 in 2013.
Also there are 22 boarding schools.
Vocational education of the region during 2009-2013 is repre-
sented by 23 public vocational education institutions.
140 professions were licensed by vocational education institu-
tions of the region in 2013 (in 2009 – 121 professions). Training of
workers was conducted by a combination of 421 of the aforemen-
tioned professions (2009 – 408 professions).
Buildings of Education Fund are mainly in satisfactory conditions.
26 objects of the Educational Fund have been built or restored in
2009-2013.
HEALTH
Medical care in the region is currently available in 250 medical
institutions and their separate structural units, 226 of which pro-
vide outpatient care, and in 540 obstetric and paramedic stations.
The renovation of medical equipment in health facilities is relevant.
A consistent work on the development of primary health care
based on general practice of family medicine is carried out. In the
last five years there 40 new ambulatories of general practice and
family medicinewere started.
A municipal institution «The regional center of emergency medical
care and disaster medicine of Cherkasy regional council was created in
the region. This is the separate and the only legal entity responsible
for pre-hospital stage of emergency medical care in the region.
On the basis of offices of the municipal institution «Cherkasy
Regional Hospital of Cherkasy regional council» there was creat-
ed thoracic regional center and regional center of dental surgery.
As part of the therapeutic department of the municipal institution
21CHERKASY «Cherkasy Regional Hospital for disabled veterans of Cherkasy re-
REGION gional council» there was created the Rehabilitation Center for par-
DEVELOPMENT ticipants of anti-terrorist operations where50 beds can be fit. The
STRATEGY
2020 reconstructed clinic and emergency department and new– built in-
tensive care unit Kaniv central district hospitalwas opened.in Kaniv.
The provision of ambulance crews in the region is on average
0.79 to 10 ths. population to a standard 0.7.
During the period of 2009-2013 the health budget increased by
506.1 million. UAH (by 40%) and in 2013 amounted to 1 273.5 mil-
lion. UAH
The level of staffing of family doctors regular appointment by
legal entities is low and in 2013 amounted to 68.6%.
General and primary morbidity of the entire population of the
region, including rural areas, in general and in all age groups in
recent years has tended to decline.
Index of availability of beds in the hospitals of the region is al-
most at the average level (80.5) and is 81.0 to 10 ths. population.
CULTURE
740 libraries, 740 cultural centers, clubs, centers of culture and
leisure, 38 primary specialized art schools, 2 higher artistic educa-
tional institutions of I-II levels of accreditation, 2 theaters, 2 con-
cert facilities and 105 cinema facilities are functioning today.
Providing of the population with club and library facilities meets
current standards. But in general, the network of cultural institu-
tions and the approach to work and management of socio¬cultural
development need improvement to provide equal access for the
regional residents to cultural values and to create favorable condi-
tions for creative development. To solve these problems will favor
the development of other areas of economic and social life, includ-
ing the growth of the tourism industry.
SOCIAL SEC TOR
Social services in the region are provided in 27 regional centers.
As of 01.01.2014 176.3 ths.families (by 33.6 ths. families more
than in 2009) realized their entitlement to state social aid.
The total amount of charges of different types of state social aid
for 2013 amounted to 1 194.4 million UAH (by 710.8 million. UAH
more than in 2009).
Today Cherkasy region is home to about 500 ths. citizens who
according to the current law use privileges for housing and commu-
nal services, fuel, reduced fare.
Index of coverage of orphans and children deprived of parental
care by family education increased from 73.7% in 2009 to 88.4% in
2013 (by nearly 15%).
3.5. The index of physical volume of GRP (in comparative prices) for
ECONOMICS 2012 was 100.9%, which exceeds the Ukrainian average index by
AND BUSINESS 0.7%. In per capita this index is 24,558 UAH.
By the structure of the economy Cherkasy is industrially-agrar-
ian region. The share of industry in the structure of gross value
22added is 23.9% (including 0.7% – mining industry), the share of
agriculture – 21.8%, wholesale and retail trade, repair of motor 3 SUMMARY OF
THE REGIONAL
SOCIO -
vehicles and motorcycles, temporary accommodation and cater- ECONOMIC
ing – 13,3%, transport, storage, postal and courier activities, in- DE V ELOPMENT
formation and communication – 8.2%, education – 7.5%, public
Fig.9.and
administration Gross regional
defense, product area
compulsory and its
social share in–GDP
insurance UkraineFig.9. Gross regional prod-
5.3%,
health care and social assistance – 4.4%. uct area and its share in
GDP Ukraine
THE INDUSTRIAL POTENTIAL
The industry of Cherkasy region is represented by more than
550 major enterprises. In a cutaway of economic activities the
foundation of regional industry production is manufacture of food
products, beverages and tobacco products – 50.6%, chemicals and
chemical products – 16.5%, supply of power of steam and air con-
ditioning – 12.7%, engineering, except repairs and installation of
machinery and equipment – 5.2%.
By results of 2013 the volume of industrial production was 30.7
billion. UAH (2.5% of the national volume). By results of 2013 ac-
cording to the volume index of realized industrial production per
capita the region takes the 9th place among Ukraine’s regions.
Cherkasy region has formed a strong potential of food industry,
represented
Fig.10. Theby more than
dynamic 80 major
of creation companies. service
of agricultural The region produc- in the region
cooperatives
es nearly one third (32%) of the national volume of poultry meat,
almost 44% – alcoholic beverages, 13% – fat cheese.
Chemical industry is the leader in the production of fertilizers
in national volumes: 17.2% – urea (carbamide), 37.9% – ammoni-
um nitrate (saltpeter), 17.5% – anhydrous ammonia. The production
activity in the area is carried out by 9 companies. The head of the
industry is OJSC «Azot», employing more than 4 300 workers, with
the share in sales volumes is about 90%. More than 28% of its prod-
ucts is sold in foreign markets.
23CHERKASY Engineering is a strategically important sector of the regional
REGION industry, which includes 30 companies. In 2013, the automobile in-
DEVELOPMENT dustry produced: passenger cars – 12.9%, trucks – 22.6%, buses –
STRATEGY
2020 15.6% (of the national volume).
In recent years in almost 40% of industrial production are be-
ing provided by five largest industrial enterprises: OJSC «Azot», Pr-
JSC «Myronivka Poultry», OJSC «Cherkasyoblenergo» separate unit
«Cherkasy HPP” JSC «CherkasyKhimvolokno», AU «Automobile As-
sembly Plant №2» OJSC «Automobile Company «Bogdan Motors».
The high degree of depreciation of fixed assets in the industry
(from 40% to 90%) leads to reduce the competitiveness of prod-
ucts in domestic and foreign markets. Meanwhile, in the territory
of Cherkasy region there remains a significant amount of unused
space that could be a potential reserve for the industrial potential
increase.
AGRO -INDUSTRIAL COMPLEX
Agro-industrial complex of the region has potential for the
growth of gross agricultural production, and providing the popula-
tion with quality food products.
Agricultural production is carried out by 835 agricultural enter-
prises which cultivate 65% of the total area of arable land, 1 208
farms,regional
Fig.9. Gross which have in use
product more
area andthan 139 ths.
its share ha ofUkraine
in GDP arable land.
Fig.10. The dynamic of cre- Over the past five years, agriculture inCherkasy region is being
Fig.10.
ation of agricultural The dynamic of creation of agricultural service cooperatives in the region
service characterized as profitable.
cooperatives in the region
In 2009, the total net income of agricultural enterprises amount-
ed to 698.7 million. UAH, in 2010 – 811.2 million.UAH, in 2011 – 1
434.3 million.UAH, in 2012 – 1798 mln.UAH, in 2013 – 761.2 mil-
lion.UAH.
Per capita of the region there is 1.6 ha of agricultural land and
1.1 ha of arable land, which is by 64% more than the average in
Ukraine.
The volume of gross agricultural output over the last five years
increased by 3,137 mln. UAH and for 2013 it is 14.9 billion UAH. In
24the structure approximately 39.6% comes from livestock and 60.4%
from the plant growing. 3 SUMMARY OF
THE REGIONAL
SOCIO -
In the production of agricultural products per capita Cherkasy ECONOMIC
region takes the 1st place in Ukraine. DE V ELOPMENT
In the region there has been conducted work concerning the cre-
ation of agricultural service cooperatives.
Thus, in 2009 there were 21 ASC, in 2010 – 25 ASC, in 2011 – 53
ASC, in 2012 – 55 ASC, in 2013 – 65 ASC.
Grain crops (50%) and industrial crops (29%) prevailin the structure
of sowing, potatoes and vegetables make up 6%, fodder crops – 9%.
While analyzing vegetable and potato industry, there is the sta-
ble production of 329-350 ths. tons and 750-800 ths. tons respec-
tively. The highest yield capacity of fruits was observed in 2012 –
161 900 kg / ha of potatoes, in 2011 – 155 600 kg / ha.
For receiving the harvest of grain crops in the region, there are
32 crops receiving companies with a total capacity of about 1.8
mln. tons and stocks of agricultural crops with a total capacity of
1.3 mln. tons.
At the same time there is insufficient level of development of the
agricultural sector infrastructure – fruit and vegetable warehouse,
infrastructure of wholesale etc.
It is worth noting that in Cherkasy region there is a wide range
of institutions that perform scientific and technical work in the field
of agro-industrial complex.
INVESTMENT AC TIVIT Y
In recent years the main source of capital investments financing
is own funds of enterprises and population funds.
The largest share of capital investments in the region’s economy Fig.11. The total amount of
during 2013 was placed in the industry – 1 133.3 million. UAH (33.2%) foreign direct investment in
and agriculture, forestry, fisheries – 1 042.6 million. UAH (30.5%). the regional economy, mln.
USD
Fig.11. The total amount of foreign direct investment in the regional economy, mln. USD
25CHERKASY Territorial structure as well as the branches investing structure
REGION of the capital investment is uneven. At Kanev, Katerinopil districts
DEVELOPMENT there is no foreign investment.
STRATEGY
2020 For 01.01.2014 foreign direct investment amounted to 887.9 mil-
lion. USD that does not meet the potential of the region (by 0.61%
more investment than at the beginning of 2013), or 705.9 USD per
capita.
FOREIGN ECONOMIC AC TIVIT Y
During 2009-2013 the foreign trade turnover increased 2.2 times
and took place expansion of trade scope to the 116 countries, with
which the region has foreign economic relations.
However, in 2009-2013 due to the actions of Russian Federation
that concerned complications of the import of Ukrainian products,
foreign trade cooperation between enterprises of the two countries
tends to decrease.
In recent years, export of goods and services in Cherkasy region
increased. 2009-2013 is characterized by the increasing exports
due to the following groups of goods: grains, fats and oils of an-
imal or plant origin, machinery and equipment. At the same time
there was a decrease of exports of the main export product of the
region – fertilizer (10%).
Currently, there is a gradual shift from the traditional market of
Russia toward the countries of the European Union.
CONSUMER MARKET
The growth rate of retail trade in 2013 amounted to 108.8%
(in Ukraine – 108.7%). However, despite the high level of de-
velopment of the consumer market in the region, the main
problem, typical for the most regions of the country, is the
improvement of the system of commercial services, especially
in rural areas.
The infrastructure of the commercial and restaurant trade net-
work of the region has about 9.5 ths. objects of all types of prop-
erty, of which 71% – shops and drugstores, 16.7% – kiosks and gas
stations, 12.3% – restaurants facilities. If compared to 2009, com-
mercial network in 2013 increased by 830 units (by 11%).
A significant part in fulfilling of needs of the population in goods
belongs to markets, which share in the total sales of consumer
goods is more than 30 percent.
The provision of the total sales enterprises area for the popula-
tion – legal entities and individuals in 2013 was 345 sq. m. per 1 000
people, that exceeds the standard (323 sq. m. per 1 000 people).
ENTREPRENEURSHIP
According to the results of 2013 in the region there were 7 427
functioning small businesses, which employed 45 000 people. In
addition, the region recorded about 53 000 individuals-entrepre-
neurs.
Since 2011 there has been a tendency of increasing the number
of small businesses. Their number increased from 6 571 units in
2011 to 7 427 units in 2013 (by 11.5%).
26Fig.11. The total amount of foreign direct investment in the regional economy, mln. USD
Fig.11. The total amount of foreign direct investment in the regional economy, mln. USD
Fig.12.
During The number
the period of small regional
of 2009-2013 companies
there was in 2009
the growing – 2013, unitsFig.12. The number of small
number
of small companies to 10 ths. of present population from 43 com- regional companies in 2009
– 2013, units
panies in 2010 to 59 companies in 2013 (by 27.1%.).
The sales of products (goods and services) of small enterprises
fetched up 12.7 billion. UAH that is 21.1% of total sales.
Fig.12. The number of small regional companies in 2009 – 2013, units
Fig.13. Sales of products (goods and services) of small enterprises of the region in 2009 – 2013
Fig.13. Sales of products (goods and services) of small enterprises of the region in 2009 – 2013
As in previous years, the structure of main economic activities Fig.13. Sales of products
of small enterprises is dominated by wholesale and retail trade, (goods and services) of
small enterprises of the re-
repair of motor vehicles and motorcycles. However, while in 2009 gion in 2009 – 2013
55.6% of small enterprises was occupied in this area, by the end of
2013 their number was 25.5%. The number of small enterprises in
agriculture, forestry and fisheries increased from 10.9% in 2009 to
23.2% at the end of 2013.
TOURISM
The region has 207 registered travel agencies, including 19 tour
operators. There are 76 hotels and 758 restaurants facilities, 3 tour-
ist information centers.
Over 2013 historical and cultural sites of the region were visited
by more than 700 ths. tourists and sightseers, which is 25% higher
than the previous year index.
27CHERKASY However, the development of the tourism industry of the region
REGION does not correspond to its tourist and recreational potential, since
DEVELOPMENT there are historical and cultural reserves, monuments of history
STRATEGY
2020 and architecture. The number of tourist to the region is increasing
very slowly.
3.6. In recent years the tendency of increase in revenues to budgets
FINANCE of all levels was introduced in the region.
AND BUDGET The main source of own revenues of local budgets is tax on per-
SEC TOR sonal income, which is nearly 75%.
In terms of the budgetary provision per capita (1694 UAH) Cher-
kasy region is in better conditions than its neighbours (Kirovograd –
1670 UAH, Vinnitsa – 1491 UAH).
Fig.14. Dynamics of revenues to budgets of all levels in the region, mln. UAH
Fig.14. Dynamics of reve- Over the past five years the proportion of budget allocation
nues to budgets of all levels among the territories of the region has slightly changed. While in
in the region, mln. UAH
2009 the own revenues to budgets of 6 cities of regional impor-
tance exceeded revenues to budgets of 20 districts by 83.8 million.
UAH. (15.9%), in 2013, budgets of districts received revenues by 69
mln. UAH (by 7.2%).
An important component of socio-economic development of
each territory is revenue to the development budget. Its role in-
creases, but today it is insufficient enough to have a real impact on
the dynamics of economic processes in the region.
The greatest potential of revenues to the development budget is
concentrated at the budgets of cities of regional importance.
During the period 2009-2013 the real income of the people of
the region per capita increased by more than 70 percent, average
monthly salary – almost by 75 percent.
28 Fig.15. Dynamics of the budget structure of the region development by types of local budgetsFig.14. Dynamics of revenues to budgets of all levels in the region, mln. UAH
Fig.15. Dynamics of the budget structure of the region development by types of local budgets
Fig.15. Dynamics of the budget structure of the region development by types of local budgets
The natural vegetation of Cherkasy region has undergone signif- 3.7.
icant changes as a result of human activities. In order to preserve ECOLOGY
the biodiversity in the region the work on the protection of species
of plants and animals listed in the Red Book of Ukraine, and other
international conventions, was continued.
Over the past five years the amount of pollution emission into
the air from stationary sources in the region increased and in 2013
their amount fetched up to 73.1 ths. tons (1.7% of the emissions in
Ukraine); from mobile sources – 76.9 ths. tons (3.2% of the emis-
sions in Ukraine).
The region has 1037 rivers, the largest of which is Dnipro (its
length within the region is 150 km), 7 medium rivers – Ros, Tyas-
myn, Hnyly Tikych, Hyrsky Tikych, Supy, Yatran, Velyka Vys and
small rivers and streams.
According to statistics, the volume of polluted sewage water in-
creased more than 2 times (from 4.01 million cu.m. in 2012 to 8.29
million cu.m. in 2013).
During 2013 in the region 1.5 mln. tons of waste were produced.
Among them – about 1 mln. tons of industrial waste of I-IV haz-
ard classes (including 0.6 ths. tons of waste of I-III hazard classes.
99.9% of the total number is formed by wastes of IV hazard class)
and 490 ths. tons of solid waste.
By 01.01.2014 in the region there had appeared 4.3 million tons
of waste of I-IV hazard classes.
Allotted warehouses for storage of unsuitable or prohibited pes-
ticides are objects of potential environmental hazards in the region.
In the region there are 437 places of solid waste removal with
total area of 513.24 ha, a part of which is exhausted or exploited
with violations of environmental safety.
29CHERKASY
REGION
DEVELOPMENT
STRATEGY
2020
Fig.16. The
Fig. 16. The distribution of distribution of actual data
For effective of consumed
improvement ofwater
solidin waste
the region in terms of districts,
management it is
actual data of consumed mln.cu.m.
necessary to introduce separate collection of municipal waste at
water in the region in terms
of districts, mln.cu.m. the population level and construction of a solid waste sorting and
waste recycling facilities in order to reuse the resource of evalua-
tion component of municipal waste.
The most powerful enterprises engaged in environmentally haz-
ardous activity belong to the chemical industry, energetics and
agro-industrial complex.
3.8. According to the positioning of Cherkasy region among the re-
CHERK A SY gions of Ukraine, the assessment of the situation takes into account
REGION the comparison of its key indicators of development with the neigh-
POSITIONING boring regions and regions belonging to the same group.
AMONG Among a certain group of the neighboring regions and regions
OTHER REGIONS belonging to the same type (Kiev, Poltava, Kirovohrad, Vinnytsia,
OF UKR AINE Khmelnytsky, Zhytomyr regions), Cherkasy region rates third in
terms of per capita GRP.
In terms
Fig.17. of gross
Gross regional
regional product
product per in
per capita capita
2012,among
UAH the regions
of Ukraine Cherkasy region takes the 12th place. At the same time,
according to the rate of its growth over 2005-2012 the region occu-
pies a prominent place in the top three, giving the first and second
places to Kyiv and Dnipropetrovsk regions.
In 2013, the share of the region in the nationwide scope of the
realized industrial production (excluding changes of the main form
of economic activity on enterprises) is 2.2% (the 11th place among
the regions of Ukraine).
30Table 1. The comparative characteristics of Cherkasy region
Territory Area, Population, Urban Rural Natality GRP GRP per Share of
ths. ths. population, population, rate per (2012), capita the re-
sq. m. persons % % 1 ths. mln. (2012), gion
persons UAH UAH the GRP,
%
Ukraine 603.5 45426.2 68.7 31.3 -3.5 1459096 32002 100
Cherkasy 20.9 1260.0 56.3 43.7 -6.6 31265 24558 2.1
Zhytomyr 29.9 1262.5 58.6 41.4 -4.6 24849 19551 1.7
Rivne 20.1 1158.8 47.8 52.2 2.5 21795 18860 1.5
Khmelnytsky 20.6 137.0 55.8 44.2 -4.6 26237 19920 1.8
Kirovohrad 24.6 987.6 62.4 37.6 -6.0 22056 22082 1.5
Kyiv 28.1 1725.5 61.6 38.4 -3.9 69663 40483 4.8
Poltava 28.8 1458.2 61.7 38.3 -6.8 56580 38424 3.9
Vinnytsia 26.5 1618.3 50.4 49.6 -5.0 33024 20253 2.3
The amount of realized industrial production per capita is 23.4
ths. UAH (the 9th in Ukraine).
The share of gross agricultural production in the nationwide
Fig.16.
scope The distribution
is 5.9%, of actual data
which corresponds of consumed
to the 5th place water
among in the
the region
re- in terms of districts,
mln.cu.m.
gions of Ukraine.
Fig.17. Gross regional product per capita in 2012, UAH
In terms of amount of agricultural production per capita Cher- Fig.17. Gross regional
kasy region takes leading places among the regions of Ukraine (in product per capita in 2012,
UAH
the region – 11 821 UAH, in Ukraine – 5559 UAH).
The volume of capital investment per capita is 2 707.3 UAH, (the
20th place in Ukraine).
31You can also read