DEVELOPMENT REPORT 2020 / 2021 EDITION
←
→
Page content transcription
If your browser does not render page correctly, please read the page content below
DEVELOPMENT
REPORT
2020 / 2021 EDITION
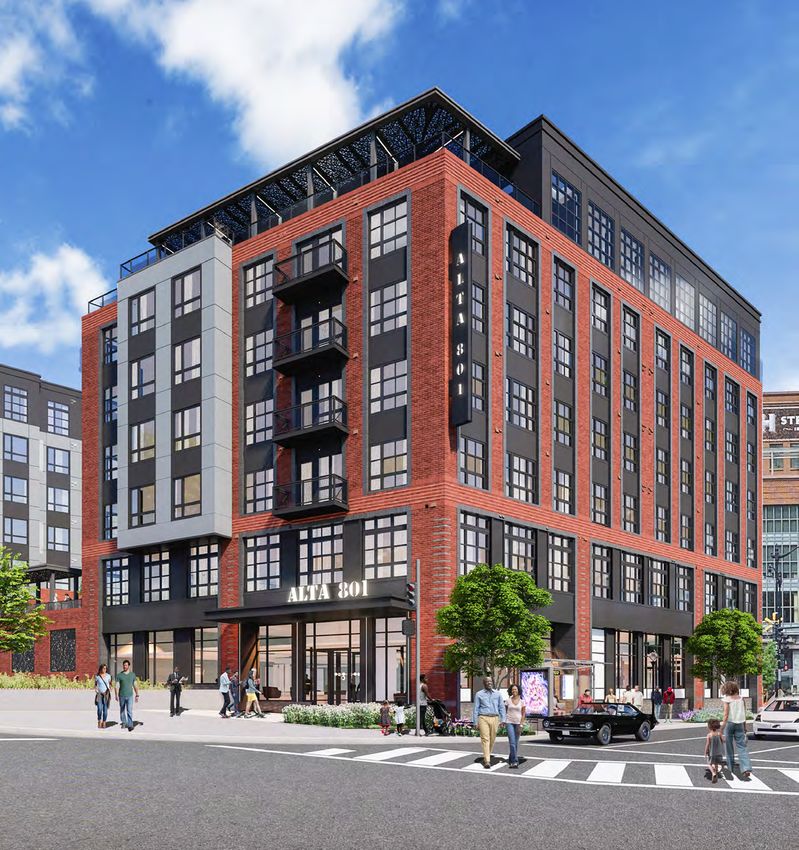
801 NEW JERSEY AVE NW | DESIGNED BY WDG | DEVELOPED BY WOOD PARTNERS
In Public-Private Partnership with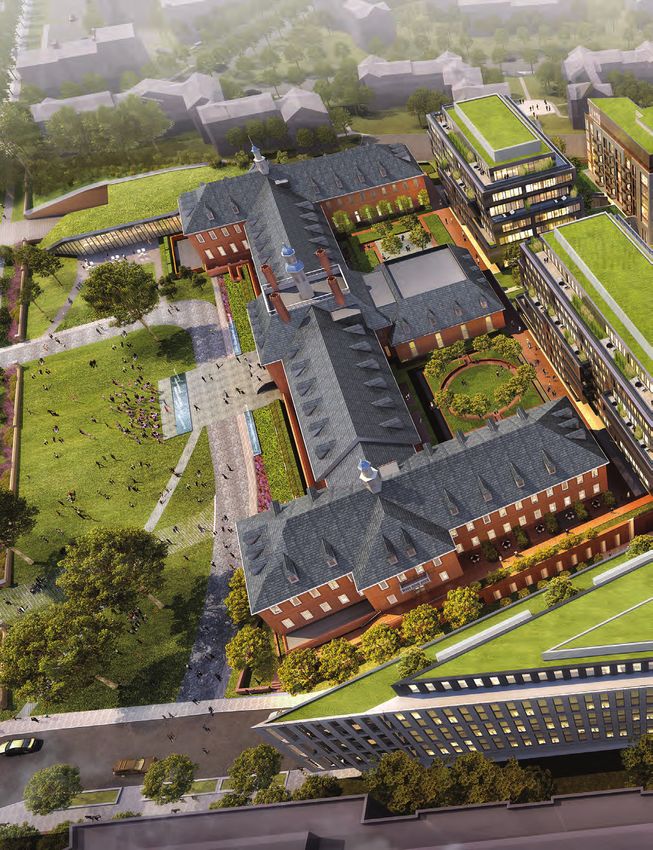
The Washington DC Economic Partnership would like to acknowledge our public and
 private sector board members whose continued financial support and guidance has
 made the Washington, DC Development Report 2020/2021 Edition possible.

 PUBLIC SECTOR PARTNERS

                                                                                     OFFICE OF THE CHIEF TECHNOLOGY OFFICER

 PRIVATE SECTOR PARTNERS

 BOARD MEMBERS

EXECUTIVE COMMITTEE                          Anitra Androh                                                         Angie Gates                                      Mike O'Hara
                                             Partner, Nelson Mullins                                               Director, DC Office of Cable Television,         Partner, Bohler DC
John Falcicchio / Co-Chair                   Joseph Askew                                                          Film, Music & Entertainment (OCTFME)             Lindsey Parker
Deputy Mayor,                                Vice President, Government Relations,                                 Dr. Brent Glass                                  Chief Technology Officer,
Office of the Deputy Mayor for               Verizon                                                               Executive Director,                              Office of the Chief Technology Officer (OCTO)
Planning and Economic Development                                                                                  National Building Museum
                                             Jack Boarman                                                                                                           William Rich
Donna Cooper / Co-Chair                      Managing Partner, BKV Group                                           Roslyn Hopkins-Fernandes                         President, Delta Associates
Region President, Pepco                      Steven Boyle                                                          Director of Account Management,                  Tara Scanlon
                                             Chief Development Officer, EDENS                                      Major Accounts & Public Sector Markets,          Partner, Practice Group Leader,
Richard Lake / Co-Chair Emeritus
                                                                                                                   UnitedHealthcare                                 Holland & Knight
Managing Principal,                          Jean-Luc Brami
Roadside Development                         Principal, Gelberg Signs                                              Emmanuel Irono                                   Shawn Seaman
                                                                                                                   President & CEO, Motir Services                  President, Hoffman & Associates
Omar McIntosh / Vice Chair                   Anita Butani
                                             Project Executive, HRGM Corporation                                   Stanley Jackson                                  Joseph Torraca
Regional Executive, Senior Vice President,
                                                                                                                   President & CEO, Anacostia Economic              Vice President of Sales &
Smoot Construction                           Emmanuel Irono
                                                                                                                   Development Corporation (AEDC)                   Business Development, RCN
                                             President & CEO, Motir Services
Kenneth Brewer / Secretary                                                                                         Caroline Kenney
                                             Ernest Chrappah                                                                                                        Andrew Trueblood
Executive Director,                                                                                                Managing Director for Public-Private Ventures,
                                             Director, Department of Consumer &                                                                                     Director, DC Office of Planning
H Street Community Development Corporation                                                                         Urban Atlantic
                                             Regulatory Affairs (DCRA)                                                                                              Mitch Weintraub
Timothy F. Veith / Treasurer                                                                                       W. Wolfgang Lewis                                Managing Partner, Cordia Partners
Regional President, United Bank              Brunson Cooper
                                                                                                                   Senior Director, Enterprise Services
                                             Managing Director,                                                                                                     Kristi Whitfield
                                                                                                                   for the Beltway Region, Comcast Business
Olivia Byrne / General Counsel               Corenic Construction Group                                                                                             Director, Department of Small & Local
Partner, K&L Gates                                                                                                 Lisa Mallory                                     Business Development (DSLBD)
                                             Colette Dafoe
                                                                                                                   CEO, DC Building Industry Association (DCBIA)
Keith J. Sellars / President                 DC Office Managing Partner, Nixon Peabody                                                                              Donna Woodall
                                                                                                                   Thomas Nida                                      Director of Citizenship & Public Affairs,
President & CEO,                             Josh Etter
                                                                                                                   Executive Vice President,                        Microsoft
Washington DC Economic Partnership           Director, Development, Foulger Pratt
                                                                                                                   City First Bank
Sybongile Cook /                             Jennifer Eugene                                                                                                        Karima Woods
                                                                                                                   Kristina Noell                                   Commissioner, DC Department of Insurance,
DMPED Representative                         Manager, Utility Sales,
                                                                                                                   Executive Director, Anacostia BID                Securities and Banking (DISB)
Director of Business                         Washington Gas
Development & Strategy,
                                                                                                                   Greg O'Dell
                                             Kim Dreux-Kelly
                                                                                                                   President and CEO, Events DC
Office of the Deputy Mayor for               Executive Director, Think Local First
Planning and Economic Development
WASHINGTON, DC
DEVELOPMENT
REPORT
2020 / 2021 EDITION
801 NEW JERSEY AVENUE
DESIGNED BY WDG ARCHITECTURE | DEVELOPED BY WOOD PARTNERS

A publication of the   In partnership with
WDCEP
The Washington DC Economic Partnership             based on
(WDCEP) is a non-profit, public-private            independent
organization whose core purpose is to              thinking and
actively position, promote, and support            objective insights.
economic development and business                  We stay one
opportunities in Washington, DC.                   step ahead
                                                   of the vibrant and evolving economic
Our mission is to promote DC’s economic
                                                   landscape by monitoring the pulse of
and business opportunities and support
                                                   DC’s developers, startups, entrepreneurs,
business retention and attraction activities.
                                                   and large and small businesses.
Through historical knowledge of the
city’s business and economic climate;              WDCEP Real Estate Services
accurate analytics, data, and research; and         • DC Real Estate Search tool
community partners and access, WDCEP is               (search.wdcep.com)
the central organization in Washington, DC          • Development Data
that connects public and private sectors,             (wdcep.co/dcdr)
neighborhoods, and communities to local,            • Local Market Intelligence
national, and international audiences.                (wdcep.co/neighborhoods)
                                                    • Maps (wdcep.co/maps)
WDCEP works with its partners in the city: to
                                                    • Site Location Assistance
facilitate dynamic relationships with technology
visionaries, artists, real estate entrepreneurs,   Learn more at wdcep.com or
non-profits, and global enterprise leaders         engage with us @WDCEP.

THE DC DEVELOPMENT REPORT
The DC Development Report is a summary             of projects is constantly being updated,
of the major development and construction          for the purposes of this publication all
projects in the District of Columbia. WDCEP        data reflect project status, design, and
tracks major developments throughout the           information as of December 2020.
year and performs an annual “development
census” in the month of December. This             Although every attempt was made to
involves soliciting contributions from             ensure the quality of the information
more than 80 developers, architects,               contained in this document, WDCEP and
contractors, and economic development              Delta Associates make no warranty or
organizations to provide updates to more           guarantee as to its accuracy, completeness,
than 300 projects. While our database              or usefulness for any given purpose.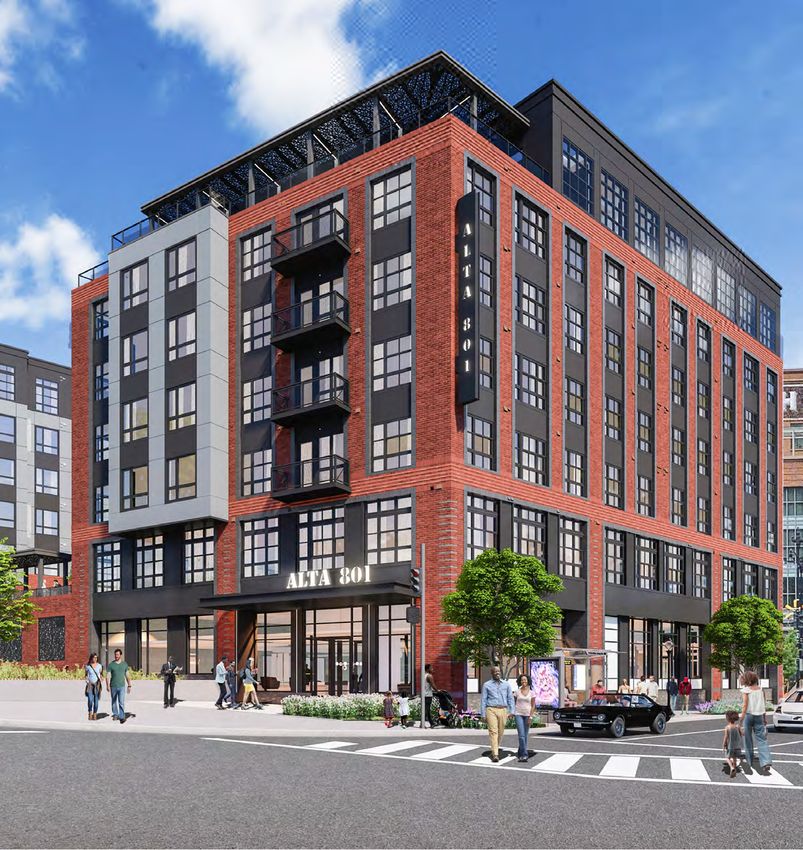
DEVELOPMENT OVERVIEW
4    ECONOMIC OVERVIEW
12   DEVELOPMENT OVERVIEW
14   20 YEARS OF GROWTH
16   MOST ACTIVE DEVELOPERS, ARCHITECTS & CONTRACTORS

DEVELOPMENT SECTOR
21   OFFICE
35   RETAIL
49   RESIDENTIAL
63   HOSPITALITY
75   QUALITY OF LIFE

NEIGHBORHOOD DEVELOPMENT
88   BUZZARD POINT
89   SAINT ELIZABETHS EAST

APPENDIX
92   METHODOLOGY
93   ACKNOWLEDGMENTS
DEVELOPMENT
   OVER

  ECONOMIC OVERVIEW
  DEVELOPMENT OVERVIEW
  MOST ACTIVE
VIEW
ECONOMIC
                                        OVERVIEW                                                                       By: Jonathan Chambers, Vice President, Delta Associates

U.S. ECONOMIC RECOVERY

The COVID-19 pandemic has wreaked havoc on the nation’s                                                   growth in the third quarter. Personal consumption, which has
economy since spring 2020. In perhaps the most economically                                               been the backbone of the nation’s economic growth over the
volatile year in American history, real GDP plunged by -31.4% in                                          last decade, was somewhat more stable, falling by -33.2% in the
the second quarter, but recovered by 33.1% in the third quarter,                                          second quarter and rebounding by 41.0% in the third quarter.
closing the year with annual growth of -3.5%—the weakest GDP                                              For all of 2020, personal consumption decreased -3.9%, while
growth since 1946. Economic growth was initially dragged                                                  business investment decreased -5.3%. The only positive growth
down by a precipitous decline in economic activity triggered                                              sector during the year was federal spending, increasing 4.4%.
by widespread “stay-at-home” orders related to the COVID-19                                               The pandemic-triggered recession ended the longest economic
pandemic but rebounded during the summer as businesses                                                    expansion in U.S. history, but the current focus is the strength of
reopened and new virus cases declined.                                                                    the economic recovery, which has waned in the fall.

Business investment has been on a wild see-saw ride, plunging                                             However, the economic fallout and subsequent pace of recovery
by -46.6% in the second quarter before recovering to 86.3%                                                have been stronger than many economists had expected. Despite

THE DISTRICT’S GDP YEAR-OVER-YEAR GROWTH RATE

      8.0%

      6.0%

      4.0%
                                                                                                                                                                     3.2%

      2.0%

      0.0%
                                                                                                                                                                     -0.9%
      -2.0%
                                                                                                                                                               -2.8%
                                                                                                                                                               -2.9%
                    2008 2009                       2010            2011           2012           2013   2014   2015      2016     2017      2018      2019 2020*
                                         DC Total                                      DC Public                     DC Private                     U.S. Total
Source: Bureau of Economic Analysis, Delta Associates; December 2020. *Q3 2019–Q3 2020 growth..

4       © 2021 WASHINGTON DC ECONOMIC PARTNERSHIP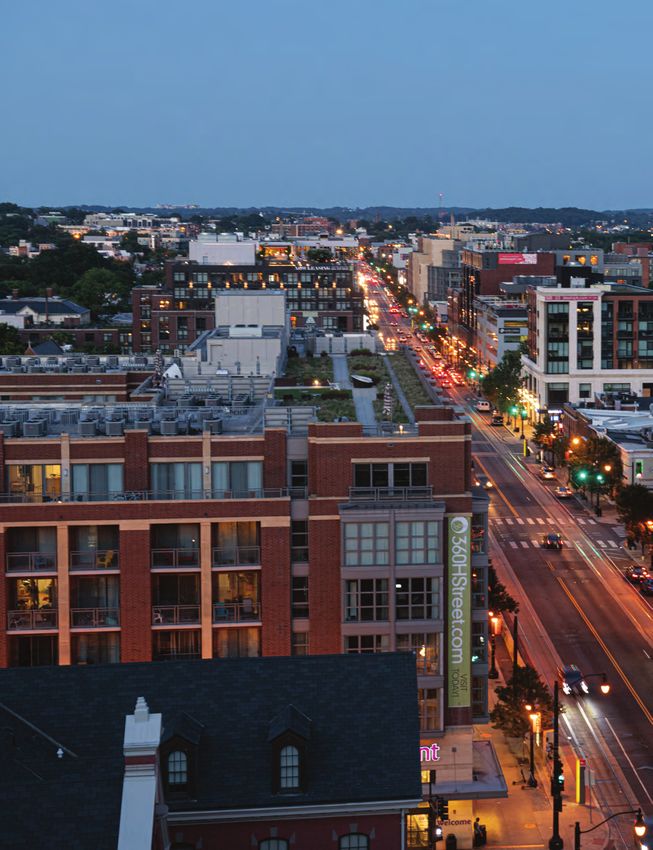
ECONOMIC
                                                                                             OVERVIEW

some economic recovery over the summer, it appears that               mid-2021. Even after the vaccines become widely available at
both economic output and employment could hit a ceiling and           pharmacies and supermarkets, the majority of Americans will
stabilize at lower levels than they would have remained in the        likely not be inoculated until summer.
absence of the pandemic. That gap could take several years to
close, especially in more vulnerable industry sectors such as         DISTRICT OF COLUMBIA
leisure/hospitality.
                                                                      ECONOMIC RECOVERY
Consumer spending was the primary and most consistent
driver of economic expansion during the last recovery period          Following a year of renewed economic growth, the Washington
but fell precipitously during the initial stages of the pandemic.     metro area economy was upended by the COVID-19 pandemic
The good news is that this critical pillar of the economy has         in March, when most private business in the region came
bounced back. Although consumer sentiment remains about               to a virtual standstill. Many area businesses were forced to
20% lower than a year ago as of December, outstanding                 dramatically reduce the size of their active workforce, to closer
consumer credit has rapidly expanded over the summer and              match costs to the drop in revenue, although service firms
home and auto sales are booming thanks to lower interest              were able to continue operating remotely. While much of the
rates. The bad news is that stimulus policies that included           businesses initially affected have reopened or switched to remote
checks issued to every household and significantly increased          operations, there is still a long way to go before the regional
unemployment benefits have long been exhausted in most                economy returns to full output.
cases and there is serious concern of the cycle restarting absent
additional federal government intervention (which has not             The decline in local business transactions can be directly traced
been forthcoming as of early December).                               to pandemic social distancing efforts, including stay-at-home
                                                                      orders in the spring. In April and May, the amount of time that
Economic growth in 2021 and beyond, including whether the             District residents stayed at home increased over 20% compared
ideal “V-shaped” recovery can be sustained, will continue to          to January, but the time difference has steadily shrunk to just
depend heavily on two factors: 1. The Federal Government              16% as of November. Retailers, restaurants, transit stations,
and 2. Control of the COVID-19 pandemic (via vaccination and          and workplaces saw foot traffic reduced by over -60% in April,
social distancing policy). The former inaction of the federal         although the deficit has shrunk to about -50% for retailers/
government in the provision of additional financial relief to         restaurants and workplaces and -65% for transit stations as of
residents and businesses last fall threatened to deal a significant   November. The decrease in foot traffic has caused the number
blow to the economic recovery. However, as economic conditions        of open businesses in the District to decline by -45% as of
worsened Congress finally passed a stimulus package in                November compared to January. Total business revenue has also
December, with additional economic assistance likely under the        fallen by -44% in the District since February as of December.
Biden administration.
                                                                      In the second quarter of 2020, at the onset of the pandemic,
As of mid-December, distribution was underway of highly               total economic output in the District of Columbia plunged at
effective COVID-19 vaccines developed by Pfizer and Moderna,          an annual rate of -20.4%. This was significantly better than
while three other vaccines developed by AstraZeneca/Oxford            the national economic nosedive of -31.4%, but well short of
University, Johnson & Johnson, and Novavax were also                  the District’s 1.6% annual rate of growth in 2019. Leisure/
contenders for securing emergency FDA approval. Realistically,        Hospitality was hit hardest of all major economic sectors, both
a slow return to “normal” is unlikely to begin until at least         in the Washington region and the nation. The sector’s two main

                                                                                        DC DEVELOPMENT REPORT • 2020 / 2021 EDITION     5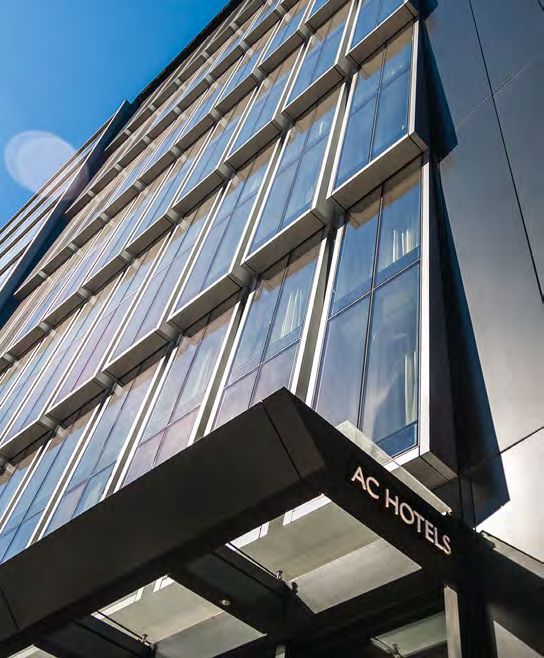
ECONOMIC
                               OVERVIEW

UNEMPLOYMENT RATE

    15.0%

    12.0%

    9.0%

    6.0%

    3.0%

    0.0%
                             2015                                2016               2017                     2018                            2019                 2020
                       U.S.                            District of Columbia                Washington MSA                              New York MSA                 Chicago MSA

                              Boston MSA                                Los Angeles MSA                 San Francisco MSA                             Dallas/Fort-Worth MSA

Source: Bureau of Labor Statistics, Delta Associates; December 2020.

industry components—Arts/Entertainment/Recreation and                                            PROJECTED JOB GROWTH (THOUSANDS)
Accommodation/Food Services—both saw economic output                                              WASHINGTON
                                                                                                   MSA TOTAL:                      130.0                          47.0
in the District plunge by over -90% in the second quarter.
                                                                                                            150
Unsurprisingly, the Federal Government is the only local
economic sector that has maintained positive growth through
the pandemic. Between Q3 2019 and Q3 2020, the District ‘s GDP                                              120
declined -0.9%, but this outperformed the national GDP decline                                                                        35.0

of -2.8% over the same period.
                                                                                                            90

There is still a great deal of uncertainty on what the “new
normal” will even look like when the pandemic is over and the                                                                         55.0
                                                                                                            60
dust settles, in terms of how many businesses will remain, how
many jobs will return, and what permanent behavioral and
                                                                                                                                                                  15.0
spending patterns will persist in the workplace and at home.                                                30
The good news is that the Washington metro area remains better                                                                        40.0                        25.0
positioned than virtually every other region to weather the
                                                                                                                                                                   7.0
current economic downturn.                                                                                   0
                                                                                                                                     2021                         2022

                                                                                                              District of Columbia            Northern Virginia     Suburban Maryland

                                                                                                 Source: Delta Associates; December 2020.

6       © 2021 WASHINGTON DC ECONOMIC PARTNERSHIP
ECONOMIC
OVERVIEW
ANNUAL JOB GROWTH (THOUSANDS)
2020 ANNUAL AVERAGE (2010–2019)
DISTRICT OF DISTRICT OF
WASHINGTON MSA U.S. WASHINGTON MSA U.S.
COLUMBIA COLUMBIA
Education/Health Services -9.6 -31.2 -1,198.0 2.2 9.0 465.9
Federal Government 4.6 9.2 52.0 -0.7 -0.1 3.1
Financial Activities -2.2 -4.8 -51.0 0.3 1.6 106.2
Information -2.0 -4.5 -241.0 0.2 -0.5 14.0
Leisure/Hospitality -29.4 -83.5 -3,616.0 2.2 8.1 381.9
Professional/Business Services -8.9 -11.1 -876.0 2.6 10.7 497.8
Retail Trade -0.8 -6.6 -347.1 0.6 1.8 129.6
State/Local Government 0.2 -26.8 -1,298.0 0.6 3.3 14.0
other -4.0 -18.5 -1,570.9 2.0 7.1 613.1
Total -52.1 -177.8 -9,146.0 9.9 41.0 2,225.6
Source: Bureau of Labor Statistics, Delta Associates; December 2020.
While economic growth during the boom period lagged many more regionally, the metro area is outperforming its Northeastern
high-growth metros in the South and West, the Washington area peers by a wide margin, particularly New York and Boston which
ranked second in GDP growth and fourth in payroll job growth have seen total employment shrink by over 10%. While no sector
among the 30 largest metro areas in the nation during the Great of the region’s economy (except Federal Government) has fully
Recession. The region again looks to be better prepared than recovered from the initial job losses caused by the pandemic, most
its peers for the gloomy days ahead. As of December 2020, the have recorded at least some positive job growth in recent months.
Washington metro area’s unemployment rate was 5.6%, 300 basis
points higher than a year prior, but significantly lower than most Despite the strong job growth in the summer, there was some
every other major metro areas. deceleration in the fall, and most sectors remained in the red for
all of 2020. The Federal Government will continue to provide a
WASHINGTON METROPOLITAN strong positive boost to the region’s workforce, which will offset
some of the private sector declines. We anticipate that job growth
AREA’S LABOR MARKET in the rebound will rebound in 2021, with approximately 130,000
net additions through the year. The economic cornerstones of
Positive monthly job growth through the summer and fall each substate: tech and federal contracting in Northern Virginia,
brought back much of the Washington region’s jobs that life sciences in Suburban Maryland, and the Federal Government
were initially lost in the spring, but job growth for all of 2020 in the District will continue to be well insulated from negative
remained sharply negative at -177,800. This compares to the shocks in the period ahead.
all-time low figure of -315,700 for the 12 months ending May
2020. The District accounted for about a quarter of job losses in Leisure/Hospitality
the region, with 52,100 positions shed in 2020. Unfortunately,
the bulk of job losses occurred in lower-wage sectors, including The Washington area’s Leisure/Hospitality sector experienced
Leisure/Hospitality and Transportation/Utilities. the largest net loss of jobs in 2020 at -83,500. Although Leisure/
Hospitality has also been the worst performer nationally, the
Among large metro areas, Washington remained in the middle Washington region has a relatively high exposure to shocks in
in terms of both absolute and employment growth. However, the sector. The District is one of the top 10 tourist destinations
DC DEVELOPMENT REPORT • 2020 / 2021 EDITION 7ECONOMIC
OVERVIEW
in the country and the metro area boasts the nation’s largest A new presidential administration and Congress is mostly good
concentration of hospitality headquarters. Many large news for the Washington region heading into 2021, especially
local hotel properties have had to wind down operations or in the midst of the current pandemic. A new set of spending
shutter entirely, including the Washington Four Seasons and priorities, initiatives, and new residents at the beginning of a new
Hay-Adams Hotel in the District. administration provides a boost to the region’s economy. With
Democratic in control of both the House and the Senate (the
Although leisure travel picked up nationally through latter by a tie-breaker), the region has likely avoided being in the
the summer, economically lucrative business travel has midst of a political tug-of-war that could have resulted in budget
continued to be virtually nonexistent. In addition, targeted sequestration, debt ceiling battles, government shutdowns and
self-quarantine restrictions have placed a damper on travel even mass layoffs.
to the region. Tourist destinations such as museums,
stadiums, parks, and theaters were prohibited from Professional and Business Services
opening or required to operate at very low capacity.
The Professional/Business Services sector was the strongest
Restaurants in the region (particularly in the District and performing sector in the last economic cycle and we expect that
Maryland) that were forced to close their seating areas for trend to continue in the current recovery. Net job growth in
months during the spring, were allowed to re-open in the the sector in 2020 was -11,000, but we expect growth to quickly
summer with very limited indoor seating or outdoor dining turn positive in 2021. Demand for services remains high and the
only. Many restaurants and bars have attempted to adapt white-collar office using nature of the sector has allowed most
to the restrictions with new or enhanced carry-out and firms to continue operating remotely. The sector will bounce
delivery options. In response to a local rise in COVID-19 back much quicker than others and continue to be the primary
cases, new restrictions lowering indoor dining capacity private job creation source in the region in the long term.
from 50% to 25% were put in place in early December.
The tech industry has ballooned in the Washington region in
Federal Government recent years, primarily in Northern Virginia, but also in the
District and Suburban Maryland. Amazon’s growing HQ2
Unlike every other economic sector, the federal presence in Arlington County is the obvious regional juggernaut,
government has maintained positive employment growth but many other tech companies have planted stakes or expanded
through most of the pandemic, as expected. In fact, the in the region in 2020 including NGP VAN and EveryAction in the
4,900 positions added in August was the highest monthly District and Microsoft in Northern Virginia. Nationally, the tech
total in just over 10 years. However, monthly job growth industry has been largely insulated from the negative economic
trended slightly negative in the fall, as temporary census effects of the pandemic, and some industry sectors such as
workers left the workforce. Nevertheless, for all of 2020 videoconferencing and cloud services has seen demand swell.
the Federal Government sector has the highest 12-month However, not every business is immune. Commercial clients have
employment tally at 9,200. The strong performance in the shrunk IT budgets, which has weighed on tech revenue. Smaller,
sector is obviously good news for the Washington metro undercapitalized companies (particularly startups) have been
area as the federal government is the region’s largest especially vulnerable to cash-flow challenges. In addition, IT
employer and economic bread and butter, despite recent companies have to contend with the same supply chain, travel,
diversification efforts. and workforce disruptions as every other industry.
8 © 2021 WASHINGTON DC ECONOMIC PARTNERSHIPECONOMIC
OVERVIEW
POPULATION GROWTH
Retail Trade The District’s population grew by more than 3,000 or 0.5%
in 2019 to 705,749, extending its positive growth streak to 19
Job growth in the beleaguered Retail Trade sector remains in straight years. Population growth in the District was due to a net
the red, but the sector has experienced a remarkably strong natural increase of about 3,800 and international migration of
resurgence in recent months, especially compared to most other approximately 2,600. However, net domestic migration remained
sectors. Net employment growth in 2020 was -6,600 in the metro negative at approximately 2,200. The District’s median age,
area and -700 in the District. This was a dramatic improvement which has been steadily but very slowly trending upwards for
from the -31,900 (metro area) and -2,700 (District) 12-month job nearly a decade, accelerated in 2019 to 34.3. Younger households,
growth figures recorded in May. especially those seeking to buy homes, have been increasingly
priced out of the District in recent years.
Many nationwide and regional retailers have been repositioning
for survival amid online shopping by belt-tightening, closing The COVID-19 pandemic has triggered unplanned relocations
low-performing stores, and increasing efficiency overall, so nationwide for several reasons including perceived safety, school
they happened to be better situated in advance of the pandemic closures, and loss of employment. One of the purported relocation
compared to businesses in other sectors. The grocery store trends that has dominated headlines since March is a supposed
industry has been a major bright spot in the sector as most food mass migration from large cities and dense urban areas to more
retailers have recorded very strong sales through the pandemic suburban and rural areas. With the majority of white-collar
and have accordingly increased their workforces to meet workers working remotely from home, square footage has become
demand. The COVID-19 recession has unfortunately claimed more important while proximity to the workplace has become less
multiple victims in the sector, particularly higher-end national important. While much of the discussion is based on speculation
chains. Most recently IT’SUGAR, Tailored Brands (Jos. A. Bank/ and anecdotal evidence, there has been some data that would
Men’s Wearhouse), and Lord & Taylor have declared bankruptcy. indicate the trend could be existent at some level in certain areas.
WASHINGTON METRO CRE INVESTMENT VOLUME (2019 vs. 2020)
Office
Industrial
Retail
Apartment
Land/Dev. Site
-100% -80% -60% -40% -20% 0%
Source: Real Capital Analytics, Delta Associates; December 2020.
DC DEVELOPMENT REPORT • 2020 / 2021 EDITION 9ECONOMIC
OVERVIEW
According to a Pew Research Center survey conducted in any major city in the nation (according to C2ER’s Cost of Living
June, due to the pandemic: 3% of Americans have relocated, Index), the data is not surprising. That said, comprehensive, hard
6% had someone move into their household, and 14% know evidence of any migration still won’t be available until Census
someone who relocated. Note that this survey does not identify population figures are released in 2021.
the geographic origin or destination of those who moved.
Many people have been forced to relocate within the same Given that the District of Columbia is a coastal city with a high
community for economic reasons, despite a pause in evictions cost of living, there has been speculation on whether the city-to-
in most states. The surging housing market—one of the few suburbs trend has manifested here. According to HireaHelper
economic components that has thrived through most of the data, this might in fact be the case. The District experienced
pandemic—has also been interpreted as evidence of a wave of 58% more move-outs than move-ins between March and June.
pandemic-related relocations, but rock-bottom interest rates Interestingly, Alexandria and Arlington County in Northern
likely play a major role as well. Virginia experienced an even greater discrepancy at 63% and
78%, respectively.
Data from moving companies do present a more
geographically-specific, but still somewhat vague, picture MLS data on regional home sales (primarily resales) between
on where out-migrations may be occurring. Two cities in March 2020 and October 2020 compared to the same period
particular, New York and San Francisco, seem to be epicenters in 2019 seems to mostly confirm this trend. Home sales during
of this trend. the period in the urban core of the District, Arlington, and
Alexandria, as well as the Inner Suburban Ring, were less than
According to HireAHelper’s records of its clients, over 1% higher than a year prior. Meanwhile in the Outer Suburban
80% more people sought help to move out of a home in San Ring and Exurban Ring, sales ballooned 11.8% and 20.8%,
Francisco and New York than to move in between mid-March respectively. It remains to be seen how this trend will play out
and the end of June. Given that New York City and San in the long-term, especially as the pandemic abates and area
Francisco have the highest and third-highest costs of living of residents return to the workplace.
20
THE DISTRICT’S CHANGE IN BUSINESS REVENUE SINCE JANUARY 2020
0
-20
-33%
-40 -41%
-43%
-44%
-60
-80
-88%
-100
February March April May June July August September October November December
Total (All Businesses) Transportation Professional/Business Services
Education/Health Services Leisure/Hospitality
Source: Womply via Economic Tracker, Delta Associates; December 2020.
10 © 2021 WASHINGTON DC ECONOMIC PARTNERSHIPECONOMIC
OVERVIEW
COMMERCIAL REAL ESTATE
INVESTMENT
The U.S. commercial real estate investment market has types, particularly office and hotel, that could be in store for
been hammered by the COVID-19 pandemic, but the effect potentially major market restructurings. Some opportunistic
has varied considerably among different property types investors are also waiting for the dust to settle before they
or geographic locations—a key difference from the Great swoop in and acquire distressed assets. For offshore investors,
Recession. The total volume of all commercial real estate the U.S. remains the most attractive location to park their
properties sold in the U.S. was 32% lower than in 2019. Trade capital, primarily due to the relative stability of the market.
volume is deeply negative year-over-year across all sectors.
However, the greatest disparity between property types was in The District has not been immune to the greater CRE market
pricing. While prices of warehouse, apartment, and suburban struggles, despite the stabilizing presence of the federal
office properties increased 7.4%, 8.5%, and 6.6% on average government. Total CRE trade volume was down -51% in
respectively, CBD office, retail, and hotel prices fell -0.2%, 2020 compared to 2019. Based on the limited number of
-6.7%, and -6.8%, respectively. transactions, office prices in the District declined -10.5% in
2020, while apartment prices declined -3.3%. It’s also worth
CRE investors stepped back to await further guidance and noting that for most deals sellers are still realizing positive
certainty on investment risk. Specifically, the lack of comparable long-term gains on their investments, the obvious exception
transactions and extremely high uncertainty during the global being distressed asset sales (which are predicted to increase
pandemic has made underwriting assets and tracking pricing in coming quarters). Cap rates nationally have budged little
trends challenging. This is especially true for certain property from a year ago, except for hotel properties.
THE DISTRICT’S POPULATION GROWTH BY AGE (2018–2019)
5,000
4,128
4,000
3,000
1,911
2,000
687
1,000
0
-1,000
-1,070
-2,000
-2,362
-3,000
Under 18 years 18–24 years 25–39 years 40–64 years 65 years and over
Source: Census Bureau, Delta Associates; December 2020.
DC DEVELOPMENT REPORT • 2020 / 2021 EDITION 11DEVELOPMENT
OVERVIEW
THE DISTRICT'S DEVELOPMENT GROUNDBREAKINGS (DECEMBER 2020, SF IN MILLIONS)1
15 14.4
13.4 13.9
12.7
12.0 11.8 11.9
12
10.4 10.6 10.5 10.5
10.2 10.2
9.8
9
7.5 101
89 90 92 6.5
86 81
80 80 77 79 76
6 69
65 65
4.3 4.3
50
45 41
3
0
2004 2005 2006 2007 2008 2009 2010 2011 2012 2013 2014 2015 2016 2017 2018 2019 2020
No. of Projects Total SF
SUMMARY OF PROJECTS (DECEMBER 2020)
PROJECTS SF ESTIMATED VALUE ($B)
Completed 1,573 216,478,505 $72.0
2001 – 2010 803 109,678,947 $31.0
2011 – 2020 770 106,799,558 $41.1
2011 54 5,489,253 $2.3
2012 68 7,848,994 $2.5
2013 80 11,619,129 $4.8
2014 71 11,533,842 $4.6
2015 70 6,224,685 $2.6
2016 99 12,870,149 $4.5
2017 85 13,276,702 $5.3
2018 80 11,236,779 $4.1
2019 88 13,443,702 $6.0
2020 75 13,256,323 $4.4
Under Construction 110 20,427,917 $10.3
2021 delivery 83 9,867,709 $4.8
2022 delivery 23 8,833,673 $3.8
2023+ delivery 4 1,726,535 $1.7
Pipeline 444 120,394,407 $37.1
Near Term 197 29,633,149 $8.8
Long Term 247 90,761,258 $28.3
Source: Washington DC Economic Partnership
1. Includes new construction and major renovations.
12 © 2021 WASHINGTON DC ECONOMIC PARTNERSHIPDEVELOPMENT
OVERVIEW
PROJECTS COMPLETED (2001–2020)
# OF PROJECTS SQ. FT. UNITS ROOMS
¢ Office 305 65,467,061 -- --
¢ Retail
¢ Residential
478
785
9,933,705
90,046,217
--
91,524
--
--
216.5 MILLION
¢ Hospitality 141 21,628,536 -- 21,193 Square Feet Completed
¢ Quality of Life 323 24,492,561 -- --
Total Estimated Value of Projects: $72.0 billion
PROJECTS UNDER CONSTRUCTION (DECEMBER 2020)
# OF PROJECTS SQ. FT. UNITS ROOMS
¢ Office 20 2,776,597 -- --
¢ Retail
¢ Residential
46
70
1,093,947
12,898,040
--
13,777
--
--
20.4 MILLION
¢ Hospitality 18 1,910,949 -- 1,414
Square Feet Under Construction
¢ Quality of Life 19 1,535,662 -- --
Total Estimated Value of Projects: $10.3 billion
PIPELINE PROJECTS
# OF PROJECTS SQ. FT. UNITS ROOMS
¢ Office 104 31,931,477 -- --
¢ Retail
¢ Residential
203
294
4,896,392
59,485,705
--
66,498
--
--
120.4 MILLION
¢ Hospitality 47 3,515,819 -- 5,867 Square Feet in the Pipeline
¢ Quality of Life 59 5,283,661 -- --
Total Estimated Value of Projects: $37.1 billion
Despite the health pandemic more than 4.6 million SF of projects broke ground between March and December 2020. During this time
the month of August experienced the most project starts with five, totaling just over one million SF. The vast majority of projects were
multifamily residential showing the continued investor interest in this sector.
PROJECTS STARTED DURING COVID-19
(MARCH–DECEMBER 2020)
# OF PROJECTS SQ. FT. UNITS ROOMS
4.6 MILLION
¢ Office 4 188,600 -- --
¢ Retail 8 183,581 -- --
¢ Residential 22 3,699,686 4,007 --
Square Feet Under Construction
¢ Hospitality 6 418,403 -- 472
¢ Quality of Life 4 38,215 -- --
DC DEVELOPMENT REPORT • 2020 / 2021 EDITION 13YEARS OF
GROWTH
Over the past 20 years, the District has Howard University, U Street, Shaw, and
experienced 216.5 million SF of new Union Market, New York Ave., NE/Ivy City.
development resulting in 65.5 million SF
of new and modernized office buildings, The neighborhoods that have experienced the
91,500 housing units, 21,200 hotel rooms, largest share of development have also seen
and nearly 10 million SF of retail space.1 the most residential construction during the
past 20 years with the Capitol Riverfront (10,770
The two preceding decades have seen similar units), DowntownDC, Mt. Vernon Triangle,
development levels, with 109.7 million SF of Northwest One (10,263), and H Street NE,
deliveries between 2001–2010 and 106.8 NoMa, Union Station (7,812) leading the way.
million SF from 2011–2020. Construction
in the 2000s was concentrated in the As development continues to head east, current
DowntownDC, Mt. Vernon Triangle, Northwest hotspots of construction will continue
One neighborhood cluster where nearly a to see growth and new areas such as
quarter of the District’s development took St. Elizabeths (8 M SF), Anacostia, Barry Farm
place. However, the 2011–2020 development (4.5 M SF), and Minnesota & Benning
cycle expanded and intensified into other (2.6 M SF) anticipated to experience
neighborhoods such as Capitol Riverfront, significant investment over the next decade.
SELECT NEIGHBORHOOD DEVELOPMENT (SF IN MILLIONS)
COMPLETED
NEIGHBORHOOD(S)* 2001–2010 2011–2020 UNDER PIPELINE
CONSTRUCTION
1. DowntownDC, Mt. Vernon Triangle, Northwest One 25.6 13.8 1.6 12.7
2. H Street NE, NoMa, Union Station 8.2 9.1 2.8 15.3
3. Capitol Riverfront 9.2 10.6 2.1 9.9
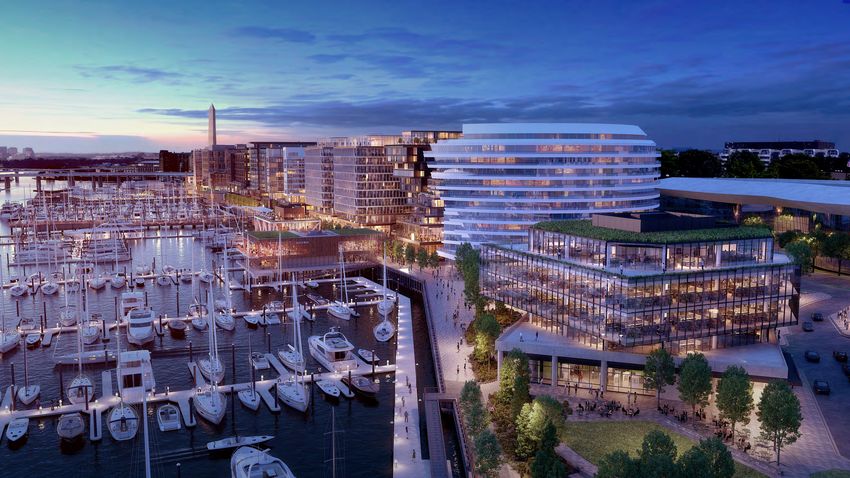
4. Buzzard Point, Southwest Waterfront, The Wharf 8.0 9.3 2.5 11.6
5. Eckington, North Capitol, Rhode Island Ave., NE/Brentwood 1.6 4.0 1.7 11.2
6. Union Market, New York Ave., NE/Ivy City 0.9 3.8 1.5 6.3
7. Capitol Hill 1.3 2.7 0.1 5.8
8. Congress Heights/St. Elizabeths 0.6 1.9 0.3 8.0
9. Anacostia, Barry Farm 0.9 0.9 0.2 4.5
10. Minnesota & Benning 0.6 0.4 0.0 2.6
*Boundaries are based on the Office of Planning's Neighborhood Clusters. Names are based on WDCEP's Neighborhood Profiles and Office of Planning's Neighborhood Clusters.
1. Includes major renovations
14 © 2021 WASHINGTON DC ECONOMIC PARTNERSHIPYEARS OF
GROWTH
COMPLETED DEVELOPMENT PROJECTS COMPLETED DEVELOPMENT PROJECTS
(2001–2010) (2011–2021)
TOTAL SF TOTAL SF
■ n/a ■ n/a
■ < 2.5 M SF ■ < 2.5 M SF
■ 2.5–5 M SF ■ 2.5–5 M SF
■ 5–10 M SF ■ 5–10 M SF
■ > 10 M SF ■ > 10 M SF
DEVELOPMENT PROJECTS UNDER DEVELOPMENT PROJECTS IN THE
CONSTRUCTION (DECEMBER 2020) PIPELINE (DECEMBER 2020)
TOTAL SF TOTAL SF
■ n/a ■ n/a
■ < 500,000 SF ■ < 2.5 M SF
■ 500,000–1 M SF ■ 2.5–5 M SF
■ 1 M–2 M SF ■ 5–10 M SF
■ > 2 M SF ■ > 10 M SF
DC DEVELOPMENT REPORT • 2020 / 2021 EDITION 15DEVELOPMENT
OVERVIEW
The figures below list the developers, architects, and contractors that have been the most ¢ Completed
active in contributing to DC’s development activity since 2015.
¢ Under Construction
¢ Pipeline
MOST ACTIVE DEVELOPERS SINCE 2015 (# OF PROJECTS)4
JBG Smith1
16 2 13 31
Douglas Development Corporation
20 6 26
Brookfield Properties 2
11 1 11 23
WC Smith
11 3 5 19
MRP Realty
6 5 6 17
If measured by square feet the most active developers include JBG Smith (11.0M SF), Urban Atlantic (10.3M SF),
Brookfield Properties (10.0M SF), Akridge (6.9M SF), and MRP Realty (6.5M SF).
MOST ACTIVE ARCHITECTS SINCE 2015 (# OF PROJECTS)4
Bonstra | Haresign Architects
17 5 21 43
Shalom Baranes Associates
13 6 16 35
Torti Gallas + Partners3
11 9 15 35
WDG Architecture
22 5 7 34
Hickok Cole
18 3 12 33
Eric Colbert & Associates
If measured by square feet the most active architects include Shalom Baranes Associates (18.4M SF), WDG Architecture (13.5M SF),
Perkins Eastman DC (13.2M SF), Torti Gallas + Partners (12.2M SF), and SK+I Architectural Design Group (11.6M SF).
MOST ACTIVE GENERAL CONTRACTORS SINCE 2015 (# OF PROJECTS) 4
Clark Construction Group
38 4 4 46
MCN Build
23 4 3 30
James G. Davis Construction Co.
20 4 24
Gilbane Building Company
16 4 4 24
Hamel Builders
14 4 4 22
If measured by square feet the most active contractors include Clark Construction Group (15.5M SF), Balfour Beatty (6.9M SF),
Donohoe Construction (6.8M SF), James Davis Construction Corporation (5.6M SF), and CBG Building Company (5.5M SF).
1. Includes projects developed as The JBG Companies. 2. Includes projects developed as Forest City Washington. 3. Includes Torti Gallas Urban projects 4. Projects completed since January 2015, under construction or in the pipeline as of
December 2020 (excludes government agencies and colleges/universities). Only companies with 10 or more projects since 2015 are included in SF calculations.
16 © 2021 WASHINGTON DC ECONOMIC PARTNERSHIPArchitecture. Planning. Interiors.
AC HOTEL BOATHOUSE
2100 L
801 NEW JERSEY PARC RIVERSIDE II
1331 MARYLAND
www.wdgarch.com Washington DC Dallas TXDEVELO
PMENT
 BY SECTOR

     OFFICE
     RETAIL
     RESIDENTIAL
     HOSPITALITY
     QUALITY OF LIFE

                  Image courtesy of Roadside Development
Welcome to the future of community development!
TIS Foundation is building a modern transformational center for civic engagement
and innovation focusing on the health, economic, and social advancement of at-
risk children and families in the Washington, DC area. The first step is to bring
institutional stakeholders together for a Private, Public, Philanthropic Partnership.
Workforce Development Education Health & Wellness
Do not wait... Join our mission today! Contact TIS Foundation at: 202.872.8333
www.tisfoundation.org
“ALONE WE CAN DO SO LITTLE, TOGETHER WE CAN DO SO MUCH” - HELEN KELLEROFFICE DEVELOPMENT
IN WASHINGTON, DC
Image courtesy of BrookfieldBy: Jonathan Chambers, Vice President, Delta Associates
While the long-term nature of leases in the
office sector have provided better protection
from the COVID-19 shock compared to other
sectors such as hospitality and multifamily, it
has not escaped unscathed.
OFFICE INVENTORY 1 NET ABSORPTION 1 DIRECT VACANCY RATE 1 AVERAGE FACE RENT 1
111.1 M
SQUARE FEET (Q4 2020)
430 K
SQUARE FEET (2020)
13.9%(Q4 2020)
$56.69
PER SQUARE FOOT (Q4 2020)
Office vacancy has climbed virtually across the board nationwide definitively assess their future space needs in the post-COVID
and rent growth has turned negative, yet the full impact of world. Renewals and subleases have dominated since the start of
the economic dip on the office market remains in flux as the the pandemic, while new leases have dwindled. Nationwide, the
pandemic persists. The current damper in office demand will inventory of sublease space has increased by at least 25% through
likely continue in the short-term as most tenants are unlikely to the year. In the District, sublease space increased by about 20%
move forward with major moves or expansions until they can since February according to Transwestern data.
GROWTH OF OFFICE-USING EMPLOYMENT SECTORS IN THE DISTRICT (2010–2020)
TOTAL: 8,300 -600 5,000 -4,900 -1,400 5,600 4,700 -1,100 700 7,100 -9,200
8,000
6,000
4,000
2,000
0
-2,000
-4,000
-6,000
-8,000
-10,000
2010 2011 2012 2013 2014 2015 2016 2017 2018 2019 2020
Federal Government Financial Activities Information Professional & Business Services State/Local Government
Source: BLS, Delta Associates; February 2021.
1. REIS, Delta Associates; February 2021 (does not include owner-occupied buildings)
22 © 2021 WASHINGTON DC ECONOMIC PARTNERSHIPOFFICE
DEVELOPMENT
The District's office market had a solid year of growth in The pandemic’s effect on office asking rents has been adverse
2019, but the pandemic-triggered recession brought a halt but minimal. Average asking rent growth in the District in 2020
to positive momentum in early 2020. On the surface, net was 0.3%. There have also been isolated stories of property
absorption for 2020 remained positive at 430,000 SF, but owners slashing rents to fill large blocks of vacant space.
this figure includes nearly one million SF of pre-leased new Lease concessions have skyrocketed, with the average tenant
construction space that delivered during the year. Removing improvement (TI) package for new deals reaching triple digits for
pre-leased space that delivered in 2020, net absorption the first time in history. TI allowances for new first-generation
totaled -745,000 SF. space have climbed even higher as developers seek to quickly
stabilize their assets. Meanwhile, lease terms for new deals have
Office vacancy in the District has steadily trended upward fallen over the past year by roughly 10% to 5.9 years on average—
over the year from 12.7% in Q4 2019 to a new record high of the lowest in nearly a decade. These generous terms could end up
13.9% in Q4 2020. Class A vacancy has also increased from a weighing on property valuations over the longer term, even in the
rate of 13.1% in Q4 2019 to 13.9% as of Q4 2020. unlikely event that teleworking doesn’t markedly affect demand.
DISTRICT OFFICE LEASING CONCESSIONS METRICS (CLASS A/B/C BUILDINGS)
$102.50
8.0 $100.00
7.0
6.0 5.9
TIME (MONTHS/YEARS)
$80.00
5.0
$ PER SQ. FT.
4.0
3.7
3.0
$60.00
2.0
1.0
0.0
Q1 2017 Q2 2017 Q3 2017 Q4 2017 Q1 2018 Q2 2018 Q3 2018 Q4 2018 Q1 2019 Q2 2019 Q3 2019 Q4 2019 Q1 2020 Q2 2020 Q3 2020 Q4 2020
Avg. Months of Free Rent Avg. Lease Term (years) Avg. Tenant Improvement Package/SF
Source: REIS, Delta Associates; February 2021.
DC DEVELOPMENT REPORT • 2020 / 2021 EDITION 23OFFICE
DEVELOPMENT
Unlike its suburban neighbors (where most construction has If a significant number of current office tenants decide to
been for pre-leased space), there has been a lot of speculative commit to a telework-heavy operational model, this could heavily
construction in the District for the greater part of a decade. crater office demand and trigger a long-term depression in the
While a little over two million SF of space delivered over market. However, there has been no hard evidence of such a
the past year, there is still another 2.8 million SF of space major structural change being imminent. None of the largest
currently being constructed or under extensive renovation/ tenants in the District have yet committed to shedding most or
rebuild. We anticipate that the construction boom has all their physical office presence and pivot to remote operations,
come to a grinding halt, with very few (if any) speculative although a handful in the suburbs have, as well as smaller
groundbreakings for at least the duration of the pandemic. tenants in the District. Still, roughly a third of employers in the
metro area plan to shift at least a portion of their workforce to
With the exception of the Federal Government, job growth permanent telework after the pandemic is over, and more than
among the primary office-using employment sectors have 80% of employers plan to allow for greater telework flexibility,
plunged in the District, including the lucrative bread and according to the Capital COVID-19 Snapshot.
butter Professional & Business Services sector. The good
news is that none of these sectors have been among the If employers do follow through with plans to shift workers off-
worst performers, and all have regained a significant share site, it will likely be a slow, gradual change, especially for tenants
of the lost positions. Unfortunately for office owners, the locked into long-term leases or occupying their own space.
bulk of the workforce at most of these tenants are working Natural demand generated by economic growth will also offset
remotely as their space sits under-utilized. In the District some of the demand deficit. It is also worth noting that dedicated
only about one-quarter of workers continue to work on-site.2 office space provides value to both employers and workers that
extend beyond simple productivity measures.
NET ABSORPTION BY QUARTER (2020)
TOTAL: 1,364,000 -620,000 1,196,000 -349,000
1,500,000
N 1,200,000 372,000
99,000 468,000
900,000
SQUARE FEET
600,000
893,000
749,000
300,000
180,000
0 -125,000 -21,000
-121,000 -317,000
-300,000
-374,000 -212,000
-600,000
-900,000
Q1 2020 Q2 2020 Q3 2020 Q4 2020
District of Columbia Suburban MD Northern VA
Source: Delta Associates; February 2021.
2. Capital COVID-19 Snapshot: Safe Return to Work survey sponsored by the Metropolitan Washington Council of Governments (MWCOG) and Greater Washington Partnership, August 2020.
24 © 2021 WASHINGTON DC ECONOMIC PARTNERSHIPOFFICE
DEVELOPMENT
Regardless of future teleworking trends, the pandemic is Tenants may reconsider densification and open-work spaces,
prompting office developers, owners, managers, and tenants to although open floorplans, which foster in-person interaction
rethink how they provide, manage, and consume space. In the and collaboration—a key advantage of the physical office
near-term, the pandemic will likely lead lease agreements and environment—will likely persist.
office contracts to incorporate a reassessment of liability under
emergency circumstances. The rapid expansion of coworking firms in the Washington
region has likely come to an end. Even prior to the pandemic
In addition, long-term contingency plans will need to be there was concern over the risk that the coworking industry
more clearly defined by building managers, who are already, brought to office investors, especially since the industry has not
promoting safe and comfortable environments through a yet proven how well it could weather an economic recession.
variety of measures such as temperature checks, motion- So far it already appears that these fears were at least partially
sensing hand sanitizer stations, HVAC/air filtration upgrades, valid as leasing activity has not only dried up (in concert with
operable exterior windows, mandatory mask policies, the overall market trend), but tenants have been actively
ultraviolet lighting, elevator and building circulation controls, reducing their footprints across the nation.
and robust and frequent cleaning/disinfecting schedules.
TOP NEW OFFICE LEASES (2020)
TENANT LOCATION SUBMARKET SQ. FT. INDUSTRY TIMEFRAME
DC Government (Dept. of General River East
322 40 St., NE
th
250,000 Local Government Q2 2020
Services) (Minnesota & Benning)
Wiley Rein LLP 2050 M St., NW Central Business District 166,000 Legal Q2 2020
Non-Governmental
National Endowment for Democracy 1201 Pennsyvania Ave., NW East End 82,000 Q2 2020
Org.
Wells Fargo 1700 K St., NW Central Business District 69,000 Finance Q1 2020
American Trucking Association 80 M St., SE Capitol Riverfront 60,000 Trade Assoc. Q1 2020
Mintz 701 Pennsylvania Ave., NW East End 57,000 Legal Q4 2020
DC Government (Dept. of Employment
400 Virginia Ave., SW Southwest 56,400 Local Government Q3 2020
Services-Labor Standards Bureau)
DC Government (Dept. of Housing and
1909 Martin Luther King Jr. Ave., SE River East (Anacostia) 55,000 Local Government Q2 2020
Community Dev.)
McGuireWoods 888 16 St., NW
th
Central Business District 50,600 Legal Q1 2020
Morning Consult 1025 F St., NW East End 49,000 Tech Q4 2020
Texas A&M University School of
1620 L St., NW Central Business District 47,400 Education Q3 2020
Government Public Sevice
GSA (Treasury Inspector General
370 L'Enfant Plz., SW Southwest 38,000 Federal Government Q2 2020
for Tax Admin.)
The Atlantic 610 Water St., SW Southwest 35,000 Information Q4 2020
EveryAction 655 15 St., NW
th
East End 35,000 Tech Q1 2020
NGP VAN Inc. 655 15th St., NW East End 34,000 Tech Q2 2020
Axinn, Veltrop & Harkrider LLP 1901 L St., NW Central Business District 33,900 Legal Q2 2020
Media Matters for America 800 Maine Ave., SW Southwest 31,400 Advocacy/Lobbying Q2 2020
NAEYC 1401 H St., NW East End 28,000 Advocacy/Lobbying Q1 2020
Hickok Cole 301 N St., NE NoMa 25,000 CRE/Architecture Q2 2020
Source: Delta Associates; February 2021.
DC DEVELOPMENT REPORT • 2020 / 2021 EDITION 25OFFICE
DEVELOPMENT
Coworking industry giant WeWork was wrestling with its at weathering a downturn, thanks primarily to its
own financial challenges before the year even began, and the heavy reliance on federal tenants, which are unlikely
pandemic has only compounded its troubles. WeWork is the to drastically decrease their physical presence in the
largest private sector tenant in many coastal gateway cities, city, whether due to large-scale teleworking or agency
including the District, where it occupies over one million SF. relocations to other regions. The longstanding uncertainty
In 2020 WeWork placed 56,000 SF of its 100,000 SF Dupont surrounded the federal sector has evaporated somewhat
Circle space on the market for sublease and closed three of following the election of President Joe Biden and unified
its oldest locations in the District totaling about 100,000 party control of Congress. The results of the recent
SF of space. Another three locations in the District totaling elections will almost certainly have an outsized impact
over 200,000 SF are slated for closure in 2021. WeWork’s on future federal spending, and indirectly the local office
sudden reversal in fortunes hits the District particularly hard market. The growing GSA backlog of leases in extension
in comparison to its suburban neighbors, as WeWork has or holdover status, the large-scale shift from leased space
accounted for more net positive office absorption in the city to federally-owned properties, the recent trend of moving
over the last few years than any other private sector tenant, by federal agencies to other regions, and historically weak
a wide margin. WeWork isn’t alone in reducing its footprint, federal hiring, could all be resolved or reversed in the
Regus, MakeOffices, and spaces have all closed locations in District’s favor with a new Democratic government in
the District or completely shut down operations altogether. power.
Despite the somewhat bleak and uncertain overall outlook,
the District’s office market is better prepared than most
THE DISTRICT’S AVAILABLE OFFICE SPACE FOR SUBLET (DECEMBER 2019–DECEMBER 2020)
2.0
1.9
1.8
1.7
MILLIONS OF SQ.FT.
1.6
1.5
1.4
1.3
1.2
1.1
1.0
Dec-19 Jan-20 Feb-20 Mar-20 Apr-20 May-20 Jun-20 July-20 Aug-20 Sept-20 Oct-20 Nov-20 Dec-20
Source: Transwestern, Delta Associates; December 2020.
26 © 2021 WASHINGTON DC ECONOMIC PARTNERSHIPOFFICE
DEVELOPMENT
OFFICE DEVELOPMENT GROUNDBREAKINGS COMPLETED PROJECTED
(DECEMBER 2020, OFFICE SF, IN MILLIONS) PRIVATE GOVT PRIVATE GOVT PRIVATE GOVT
2004 4.9 0.4 5.3 2004 2.0 1.2 3.2
2005 2.8 1.4 4.2 2005 3.6 3.6
2006 3.8 0.4 4.1 2006 4.4 1.5 5.9
2007 4.7 4.7 2007 3.7 0.6 4.3
2008 3.0 0.5 3.5 2008 2.0 1.2 3.2
2009 0.9 1.1 2.0 2009 5.6 0.4 6.0
2010 0.7 2.8 3.4 2010 2.7 0.7 3.4
2011 1.3 0.4 1.7 2011 1.2 0.8 2.0
2012 1.3 0.4 1.7 2012 0.8 1.0 1.8
2013 1.1 0.2 1.2 2013 2.0 2.1 4.1
2014 3.0 0.9 3.9 2014 0.9 1.0 1.9
2015 1.8 0.7 2.4 2015 0.6 0.1 0.7
2016 2.7 0.3 3.0 2016 2.0 0.3 2.2
2017 2.6 0.2 2.8 2017 1.3 0.8 2.1
2018 1.2 1.2 2018 2.9 0.3 3.1
2019 1.8 0.2 2.0 2019 3.4 0.5 3.9
2020 0.3 0.1 0.3 2020 1.6 0.2 1.8
2021* 1.3 0.2 1.4
2022* 1.2 0.1 1.2
*projections based on targeted delivery dates of projects under construction as of December 2020
OFFICE DEVELOPMENT (DECEMBER 2020)
PROJECTS OFFICE SF
COMPLETED (SINCE 2001) 305 65,467,061
2010 10 3,408,455
2011 8 1,987,719
2012 9 1,818,359
2013 20 4,127,439
2014 11 1,925,674
2015 4 651,500
2016 19 2,211,006
2017 11 2,125,785
2018 15 3,139,202
2019 18 3,897,360
2020 7 1,766,846
UNDER CONSTRUCTION 20 2,776,597
2021 DELIVERY 14 1,427,435
2022 DELIVERY 5 1,217,162
2023+ DELIVERY 1 132,000
PIPELINE 104 31,931,477
NEAR TERM 41 5,859,577
LONG TERM 63 26,071,900
TOTAL 429 100,175,135
80 M Street, SE addition
DC DEVELOPMENT REPORT • 2020 / 2021 EDITION 27■ COMPLETED
■ UNDER CONSTRUCTION
■ PIPELINE
17
SO
UT
M
A
H
SS
DA
A
CH
KO
CO
U
TA
SE
NN
TT
AV
S
EC
GEORGIA AVE
E
AV
TIC
E
ROCK
UT
CREEK
AV
PARK
E
14TH ST.
VE
DA
U ST. LAN
E IS
OD VE
RH
KA
OR
WY
GE
NE
OR
GE
W
AS
HI
G
TO
N
N
M
E
M
O
RI
14
AL
4
PK
W
Y
3 21
8
6 5 7 1
12 19 18
H ST.
29 2
VIRGINIA
UNION
22
66
STATION
16 24
NATIONAL MALL E. CAPITOL ST.
VIRGINIA
U.S. CAPITOL
28 27
20 FORT DUPONT
26 15 PARK
11 9 M ST.
NATIONALS
13
PARK
PE
NN
SY 10
LVA
M NIA
AV
395
30 E
25
M
E.
OFFICE
1
AV
JR.
M
M A RTIN LUTHER KING
M NATIONAL
AIRPORT
23
Alexandria
E
A AV
BAM
ALA
All project locations
are approximate.DEVELOPMENT
PIPELINE
EST. VALUE
PROJECT WARD LOCATION DEVELOPER(S) OFFICE SF DELIVERY2
($M) 1
TOP OFFICE PROJECTS COMPLETED (Q4 2019–Q4 2020)
1 Sentinel Square III 6 45 L St., NE Trammell Crow Company 545,000 $250 Q2 20
2 250 Massachusetts Avenue 2 250 Massachusetts Ave., NW Property Group Partners 507,764 $275 Q4 19
3 2050 M Street 2 2050 M St., NW Tishman Speyer 353,200 Q1 20
4 1900 N 2 1900 N St., NW JBG Smith 259,000 $230 Q4 19
5 1901 L Street 2 1901 L St., NW The Meridian Group 202,000 Q1 20
6 2100 L Street 2 2100 L St., NW Akridge / Argos Group 182,000 $47 Q3 20
7 888 16th Street 2 888 16 St., NW
th
Trammell Crow Company / Meadow 150,000 Q4 19
Partners
8 1050 17th Street 2 1050 17th St., NW The Lenkin Company 148,610 Q2 20
9 1 M Street 6 1 M St., SE Monument Realty 129,536 Q1 20
10 Shops at Penn Branch (Phase I) 7 3200 Pennsylvania Ave., SE Jair Lynch Real Estate Partners 17,000 $25 Q4 19
TOP OFFICE PROJECTS UNDER CONSTRUCTION
11 The Wharf (Phase II) 6 Southwest Waterfront Hoffman & Associates / Madison Marquette 547,000 $1,150 Q3 22
12 2100 Pennsylvania Avenue 2 2100 Pennsylvania Ave., NW Boston Properties / George Washington 423,562 $360 Q2 22
University
13 1275 New Jersey Avenue 6 1275 New Jersey Ave., SE Brookfield Properties 296,176 Q4 21
14 Signal House 5 1255 Union St., NE Carr Properties 214,000 $135 Q1 21
15 250 M at Canal Park 6 250 M St., SE WC Smith 180,600 $133 Q1 21
16 H. Carl Moultrie Courthouse 2 500 Indiana Ave., NW DC Superior Court 176,000 $97 2021
17 City Ridge 3 3900 Wisconsin Ave., NW Roadside 170,000 $715 Q2 22
18 699 14th Street 2 699 14th St., NW Lincoln Property Company / Cara Real 149,000 Q1 21
Estate
19 The Milken Center for 2 1501–1505 Pennsylvania Akridge / Milken Family Foundation 132,000 2024
Advancing the American Dream Ave., NW & 730 15th St., NW
20 80 M Street 6 80 M St., SE Columbia Property Trust 112,000 Q4 21
TOP OFFICE PROJECTS IN THE PIPELINE
21 2100 M Street 2 2100 M St., NW Meadow Partners / Network Realty Partners 369,097 2022
22 600 5th Street 2 600 5th St., NW Stonebridge Associates / Rockefeller Group 355,000 $300 2025
23 Saint Elizabeths East (Parcel 17) 8 Saint Elizabeths East Campus Redbrick LMD / Gragg Cardona Partners 267,000 $170 2023
Northeast Heights 7 Minnesota Ave. & Cedar Realty Trust / 265,000 $420 2022–28
24
Benning Rd., NE Trammell Crow Company
25 Reunion Square (Building 4) 8 Shannon Place & W St., SE Four Points / Curtis Development 229,859 2023
26 5 M Street 6 5 M St., SW JBG Smith 226,132
27 Cannon House Office Building 6 27 Independence Ave., SE Architect of the Capitol 206,500 $188 2022
Renewal (Ph III)
28 300 7th Street 6 300 7th St., SW Jair Lynch Real Estate Partners 203,414 $122
29 615 H Street 2 615 H St., NW Monument Realty 69,000 $55
30 MLK Gateway II 8 1909 Martin L King Jr Ave., SE Menkiti Group 60,000 2022
1) may include non-office components & pipeline values may include additional phases ($ in millions)
2) delivery date may reflect phase I delivery or final phase delivery .
DC DEVELOPMENT REPORT • 2020 / 2021 EDITION 29DEVELOPMENT
HIGHLIGHTS
Image courtesy of CoStar
WARD 6 WARD 2
1 M STREET 1050 17TH STREET
LOCATION: 1 M Street, SE LOCATION: 1050 17th Street, NW
DEVELOPER(S): Monument Realty DEVELOPER(S): The Lenkin Company
ARCHITECT(S): HOK ARCHITECT(S): Gensler
CONTRACTOR(S): Lendlease CONTRACTOR(S): Clark Construction Group
LEED: Gold LEED: Gold
STATUS: Completed STATUS: Completed
TARGETED DELIVERY: Q2 2020 TARGETED DELIVERY: Q2 2020
SPECS: 1 M Street is an 11-story, 131,000 SF office building with 4,100 SF of SPECS: 1050 17th Street is a new 12-story, 153,000 SF office building with 4,300 SF
ground-floor retail space. It is the new headquarters for the 150-employee of retail space. The building features a 3,600 SF fitness center, a 4,700 SF rooftop
National Association of Broadcasters (NAB). NAB purchased the building for lounge, 200 parking spaces in four below-grade levels, and a "triple-scrubbed"
$63 million in 2019. fresh air delivered to each occupied space via a Dedicated Outdoor Air System,
exchanging 100% of the air every 55 minutes.
Photo by Alan Schindler (courtesy of WDG Architecture)
Image courtesy of Boston Properties
WARD 2 WARD 2
2100 L STREET 2100 PENNSYLVANIA AVENUE
LOCATION: 2100 L Street, NW LOCATION: 2100 Pennsylvania Avenue, NW
DEVELOPER(S): Akridge / Argos Group DEVELOPER(S): Boston Properties / George Washington University
ARCHITECT(S): WDG Architecture / Martinez & Johnson ARCHITECT(S): Pelli Clarke Pelli Architects / WDG Architects
CONTRACTOR(S): James G. Davis Construction Corporation CONTRACTOR(S): Balfour Beatty
LEED: Platinum LEED: Gold EST. VALUE: $360 million
STATUS: Completed STATUS: Under Construction
TARGETED DELIVERY: Q3 2020 TARGETED DELIVERY: Q2 2022
SPECS: 2100 L Street is a 10-story, 190,000 SF trophy office building with 8,000 SPECS: 2100 Pennsylvania Avenue will be an 11-story, 454,000 SF trophy office
SF of retail space. The building offers floor-to-ceiling glass, a two-story lobby, an building with up to 30,000 SF of neighborhood-serving retail. The building will
art gallery with private outdoor terraces, a penthouse conference center, and an have two wings interconnected by a central atrium space and about 325 parking
outdoor pocket park. spaces. WilmerHale is the anchor tenant, leasing about 288,000 SF of office space.
30 © 2021 WASHINGTON DC ECONOMIC PARTNERSHIPYou can also read


