TWO RIVERS URBAN PARK: A PROPERTY MARKET POTENTIAL ANALYSIS - Western Cape Government
←
→
Page content transcription
If your browser does not render page correctly, please read the page content below
TWO RIVERS URBAN PARK:
A PROPERTY MARKET POTENTIAL ANALYSIS

                            FINAL REPORT

                            Prepared for:
    Western Cape Government in partnership with The City of Cape Town

                             20 May 2016
Table of Contents

Table of Contents .................................................................................................................................... 1
Glossary of Terms..................................................................................................................................... i
Executive Summary................................................................................................................................. ii
1. Introduction ........................................................................................................................................ 3
2. Report Structure ................................................................................................................................. 3
3. Brief and Scope of Work ..................................................................................................................... 4
4. Methodology and Sources of Data ..................................................................................................... 5
5. Overview of the TRUP Site .................................................................................................................. 6
6. Legislative and Regulatory Context..................................................................................................... 8
   6.1 Introduction .................................................................................................................................. 8
   6.2 Relevant Regulations, Policies and Legislation ............................................................................. 8
      6.2.1 National Development Plan 2030 ......................................................................................... 8
      6.2.2 Draft Western Cape Provincial Spatial Development Framework 2014 ............................... 9
      6.2.3 Provincial Land Disposal Policy............................................................................................ 10
      6.2.4 CoCT Integrated Development and Human Settlement Plans ............................................ 10
      6.2.5 City of Cape Town SDF (2012) (CTSDF)................................................................................ 11
      6.2.6 Cape Town Central City Regeneration Programme (CTCCRP) ............................................ 12
      6.2.7 The Table Bay District Plan (2012) ...................................................................................... 13
      6.2.8 The Two Rivers Urban Park Contextual Framework (2003) ................................................ 14
7. Socio-Economic and Demographic Profile of the Population in the Study Area .............................. 16
   7.1 Aligning the Study Areas and Available Statistics ....................................................................... 16
   7.2 Limitations of the Demographic Analysis ................................................................................... 17
   7.3 Socio-Economic and Demographic Profile ................................................................................. 17
      7.3.1 Socio‐Demographic Profile of the Study Area Population .................................................. 17
      7.3.2 Population Analysis ............................................................................................................. 18
      7.3.3 Analysis of Education Levels................................................................................................ 18
      7.3.4 Analysis of Age Levels.......................................................................................................... 19
      7.3.5 Analysis of Household Income Levels ................................................................................. 21
      7.3.6 Employment and Skills Level Analysis ................................................................................. 21
      7.3.7 Formal and Informal Sector Employment ........................................................................... 22
      7.3.8 Dwellings and Tenure Status ............................................................................................... 23
   7.4 Economic and Employment Base of the City of Cape Town ....................................................... 24
8. The SA Property Market .................................................................................................................... 28
   8.1 Mega-Trends ............................................................................................................................... 28
   8.2 The Long Office-, Industrial- and Residential Property Cycles ................................................... 29
      8.2.1 The Office and Industrial Property Cycles ........................................................................... 30
      8.2.2 The Residential-Property Cycle ........................................................................................... 33
   8.3 Building Plans Completed at Various Levels ............................................................................... 34
   8.4 Industrial Property Market ......................................................................................................... 37
      8.4.1 Introduction......................................................................................................................... 37
      8.4.2 Recent Industrial-Vacancy and Rental Trends in the Cape Peninsula................................. 37
      8.4.3 Historical Industrial-Rental Growth Rates in the Cape Peninsula ....................................... 39
      8.4.4 Current Industrial Rentals ................................................................................................... 40
   8.5 Office Property Market ............................................................................................................... 41
      8.5.1 Introduction......................................................................................................................... 41
      8.5.2 Current Size and Vacancy Rates of the Cape Town Office Property Market ...................... 41
      8.5.3 Historical Office-Rental Growth Rates ................................................................................ 43
      8.5.4 Current Office Rentals ......................................................................................................... 43
8.6 Residential Market...................................................................................................................... 44
8.6.1 Current Market Conditions ................................................................................................. 44
8.6.2 Recent Trends in Cape Town House Prices ......................................................................... 45
8.6.3 Trends in Flat Rentals .......................................................................................................... 47
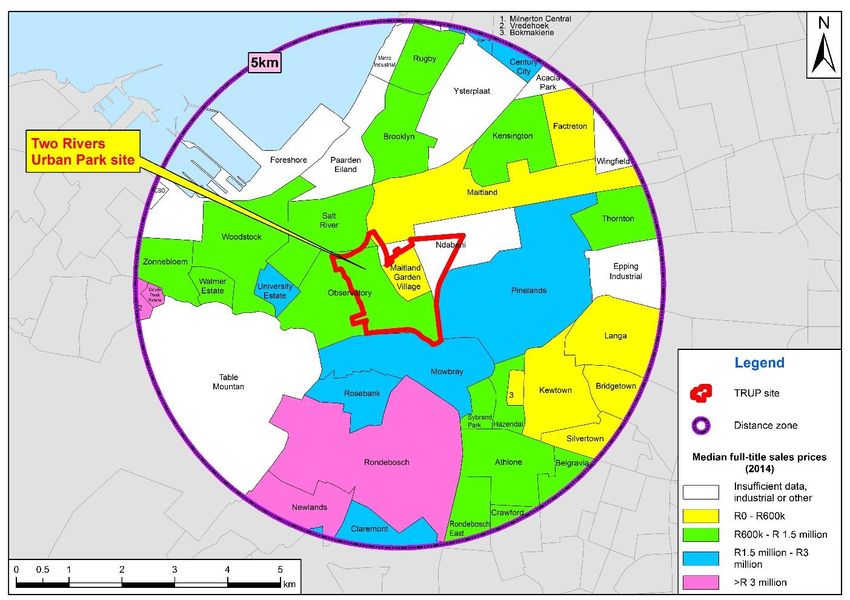
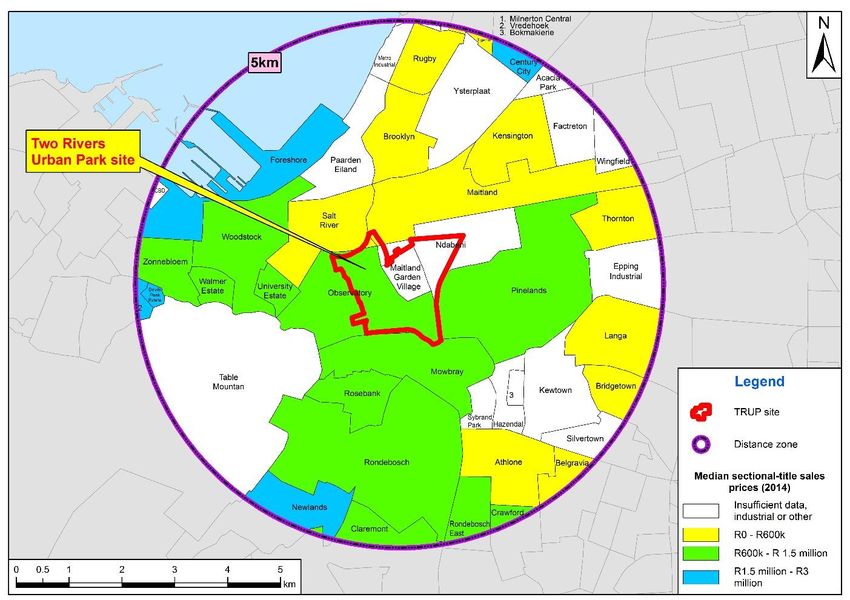
8.6.4 Residential Transfers in the Study Area .............................................................................. 49
8.6.5 Housing Affordability........................................................................................................... 54
8.7 Retail Analysis ............................................................................................................................. 55
8.8 Student Housing Potential .......................................................................................................... 58
9. Property Market Forecasts ............................................................................................................... 60
9.1 Introduction ................................................................................................................................ 60
9.2 Office Market Forecasts ............................................................................................................. 62
9.2.1 Forecast of Office Vacancies and Rentals in Cape Town..................................................... 62
9.2.2 Office Demand and Take-up for the TRUP Site’s Vicinity .................................................... 64
9.3 Residential Market Forecasts ..................................................................................................... 65
9.3.1 Forecast of House Prices and Flat Rentals .......................................................................... 65
9.3.2 Forecast Demand for Residential Property in the Vicinity of TRUP ................................ 66
9.4 Factors Affecting Our Forecasts and the Impact of the “New Economy” .................................. 69
10. SWOT Analysis of the TRUP Site ..................................................................................................... 73
11. Conclusions ..................................................................................................................................... 75
12. References ...................................................................................................................................... 78
Annexure A: Contextualising Urban Transformation and Land Values .................................................. 1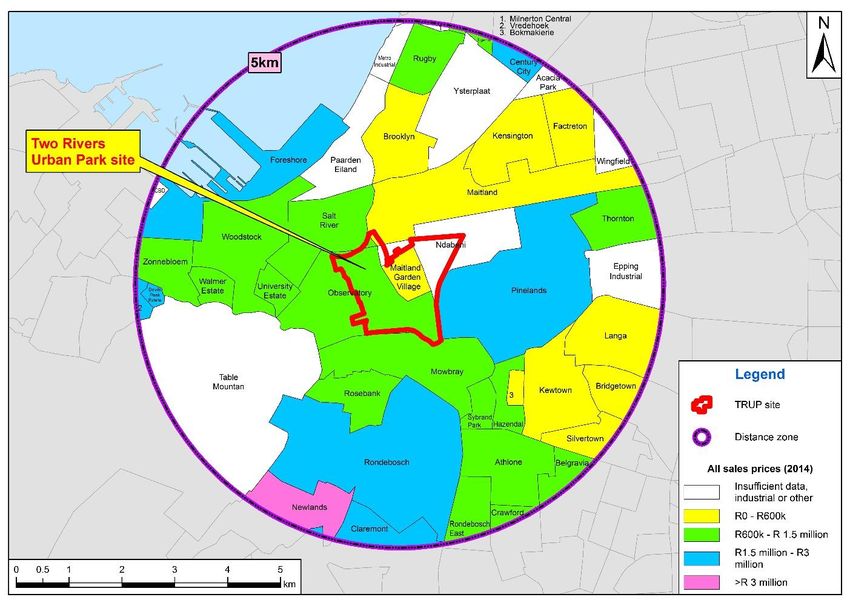
i

Glossary of Terms

BER      Bureau for Economic Research
BCI      Building Cost Index
CFR      Conceptual Framework Review
CBD      Central Business District
CoCT     City of Cape Town
CTSDF    City of Cape Town SDF (2012) (CTSDF)
EIMZ     Environmental Impact Management Zones
CTCCRP   Cape Town Central City Regeneration Programme
GDPR     Regional Grow Domestic Product
GLA      Gross Lettable Area
IDP      Integrated Development Plan
NSDP     National Spatial Development Perspective
PGDS     Provincial Growth & Development Framework
PSDF     Provincial Spatial Development Framework
PRP      Provincial Regeneration Programme
SACSC    South African Council for Shopping Centres
SDF      Spatial Development Framework
TMNP     Table Mountain National Park
TRUP     Two Rivers Urban Park
WCG      Western Cape Government
ii

Executive Summary

The report provides an analysis of the short and long term market conditions which
are expected to influence the TRUP project in the Cape Town metropolitan area.
The analysis adopts a top-down approach which starts with mega trends and the
future needs of a built environment in a ‘new economy’. It then moves to an analysis
at metropolitan and site specific characteristics. It also considers how TRUP could
respond to a policy framework which places a strong emphasis on the social trans-
formation of the urban environment.

The report suggests that the highest and best use of land must be seen from financial
and social perspectives as well as the overall complexities associated with the site.
The market analysis is based on primary and secondary catchment areas of 5 and
10km radii respectively. The demand and supply analysis is considered in the context
of present and future market trends. Special attention is given to other public sector
driven projects that could influence future uses associated with the TRUP project.

The market study concludes that the TRUP project offers an opportunity to deliver
housing in the affordable housing market (namely between R600,000 and
R1,500,000) and to deliver mixed use and mixed income environment supported by
public sector uses; these would complement existing uses on the site.

The report suggests that based on existing market trends TRUP could absorb some
160 housing units per annum and 2,800 sqm of office space per annum and retail
facilities in the order of 10,000 sqm over a ten-year period. Opportunities could also
exist for urban manufacturing.

It is important that the analysis provided in this report should be seen as a market
estimate based on market trends. The study does not attempt to test the marketabil-
ity or financial viability of specific highest and best use scenarios and the develop-
ment proposal for TRUP.
3

1. Introduction
This report provides a market overview of the urban precinct in which the Two Rivers
Urban Park (TRUP) is located. The project is a partnership between the City of Cape
Town (CoCT) and the Western Cape Government (WCG), which is located in the Ta-
ble Bay District of the CoCT. The overarching vision of the TRUP programme is to en-
sure that the development is able to play a meaningful role in furthering the quality of
the built environment serving the Cape Town Metropolitan area.

The research is based on the proposition that the TRUP has the potential to create an
environment that reflects the needs of a broad range of income groups. It is also
based on the proposition that the site must be seen within the context of other devel-
opments being proposed in the broader metropolitan area. This also suggests that it
would be unrealistic to suggest that the TRUP should be developed to its highest
commercial highest and best use.

2. Report Structure
This report is structured in the following manner:

Section 3:  Setting the scene by describing the brief and indicating the scope of
            work;
Section 4: An overview of the methodology utilised and the sources of data in the
            compilation of the report;
Section 5: Providing a brief description of the study area, i.e. contextualising the ‘lie
            of the land’;
Section 6: Presenting an introduction into the legislative and regulatory context at
            national, provincial, and local level that may impact on the site;
Section 7: Analysing and discussing the socio-demographic profile of people and
            households in the vicinity of the TRUP site;
Section 8: Describing the importance of the property market cycle and providing a
            property market overview of the site’s hinterland;
Section 9: Providing property market forecasts where appropriate;
Section 10: A SWOT analysis; and lastly,
Section 11: Conclusions.
4
3. Brief and Scope of Work
This report provides a property-market potential analysis of the TRUP site located in the
Table Bay District of Cape Town (see Figure 1). Specifically, the report provides an
analysis and assessment of property market activities appropriate to the site, given the
vision for TRUP and includes the following aspects:
Assessment of the socio-economic context, extent, trading areas, performance
for various property market segments including offices, retail, accommodation,
and industrial;
Identification of competitive areas for each identified property market seg-
ment;
Identification of the disposable income and potential buying/purchasing pow-
er of residents where applicable;
Provide an evidence-based property market analysis showing past trends and
forecasts for the next five years; and
An understanding of the future demand for space based on the understanding
of economic fundamentals.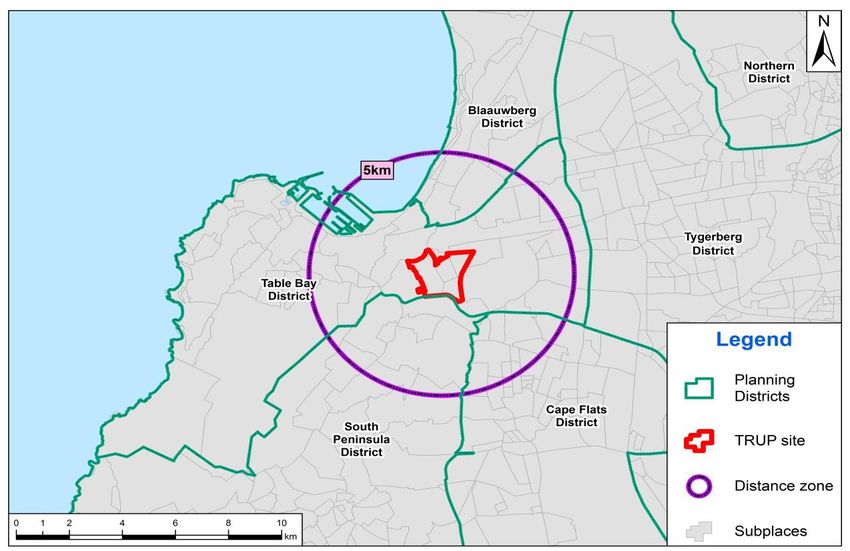
5
4. Methodology and Sources of Data
In fulfilling the study objectives stated above, the methodology utilised is outlined be-
low. The methodology is based on a top down approach which may be summarised
as follows:
Analysis of mega trends (STEEP);
Analysis of the national economy;
Analysis of the metropolitan economy;
Analysis of the economic and demographic base of the relevant catchment
area;
Analysis of the demand for property;
Analysis of the supply of property; and
Calculation of the market gap.
This work is also based on the following:
Review of relevant government policy and previous studies;
Analysing Census 2011 data;
Determining where we are in the economic cycle. This was sourced from
Rode’s SA Property Trends (June 2015), an in-house publication compiled
through Rode & Associates’ own primary research;
Interrogating Rode & Associates’ in-house database and also analysing SAPOA
data to ascertain the prevailing market conditions (rentals and vacancy rates)
for the industrial, office nodes and residential areas closest to the subject prop-
erty, and to perform forecasts of key variables. Regarding the residential mar-
ket, we also sourced residential sales prices and trends from Lightstone and
PropStats; and
Conducting structured interviews where required with property specialists.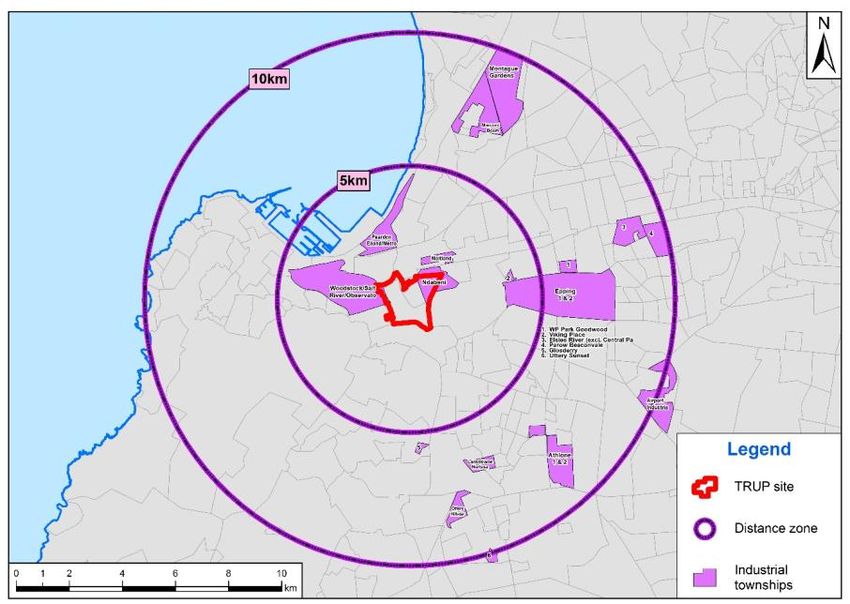
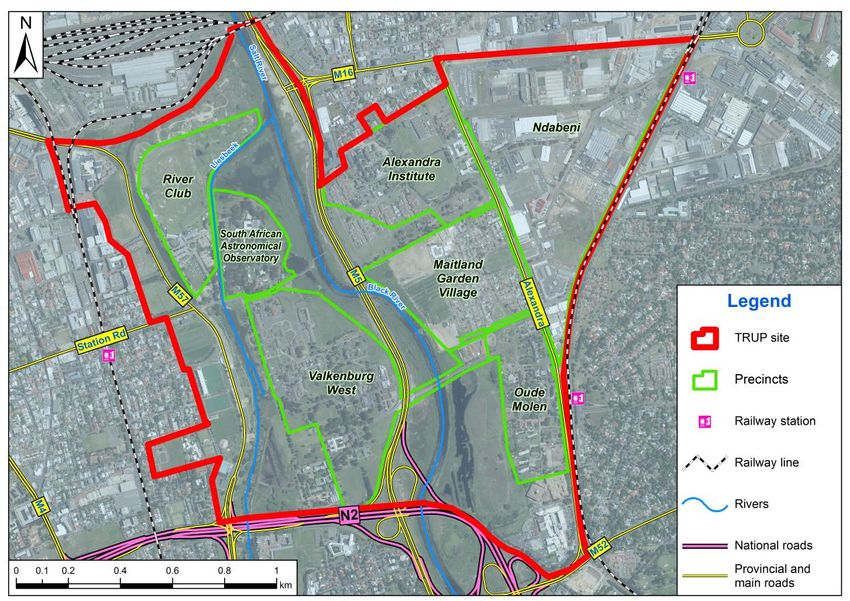
6

5. Overview of the TRUP Site
The TRUP site is located about 8km from the Cape Town CBD at the intersection of the
N2 and M5 freeways and at the confluence of the Black and Liesbeek Rivers (see Fig-
ure 1). The site is well located in terms of proximity to the CBD and the northern as well
as southern suburbs of Cape Town. The site is about 300 hectares in extent and is sur-
rounded by various residential communities (of mainly middle-income to lower-middle
income households), industrial areas, retail and health facilities, schools and tertiary
educational institutions (CityThinkSpace 2012: 17).

Natural and man-made barriers formed by the rivers and the M5 motorway split the
site in various unconnected sectors. There are unfortunately no generally accessible
major roads that link these segments and rapid internal movement between the vari-
ous areas on the site is thus not possible. Several off-ramps and flyovers leading from
the M5 and crossing the river network would greatly improve ease of internal access.
Other than the M5, the site is intersected and bordered by various other important
roads which are depicted in Figure 1. These are the M57 (Liesbeek Parkway), the M16
(Berkley Road), Alexandra Road and the M52 (Forest Drive). External access to the site
is thus relatively easy both from all directions. There are also two railway lines on the
eastern and western boundaries of the site and three train stations (Ndabeni, Obser-
vatory and Pinelands) in the vicinity.

  Figure 1: Location of Two Rivers Urban Park in the Table Bay District of the City of Cape Town
7
The TRUP site includes various precincts and areas with diverse and mainly un-related
functions. These precincts are:
River Club (currently privately owned);
South African Astronomical Observatory (owned by the WCG);
Valkenburg West Precinct (owned by the WCG);
Alexandra Precinct (owned by the WCG with Alexandra hospital as the primary
tenant);
Maitland Garden Village (a local residential suburb with public amenities and
facilities);
Oude Molen Precinct (owned by the WCG and includes a wide range of uses
in the old hospital buildings such as private schools, lodges, restaurants, etc.);
Ndabeni Precinct (this is mainly an industrial area. However, there are proper-
ties in this precinct which are owned by the CoCT and that present develop-
ment opportunities); and
Floodplains and wetlands forming the Liesbeek and Black River Green Corri-
dors. Land within these corridors are mainly owned by the CoCT.
Many of these precincts are occupied by long-established tenants. The relatively
permanent and functionally fragmented occupancy of the site also complicates
management and future planning.
Although it is located within an urban setting, the TRUP is inextricably tied to the natu-
ral environment as well. The natural elements include the scenic views of Devil’s Peak
and the Table Mountain range, the Black and Liesbeek Rivers and associated
Raapenberg, Valkenburg and Vincent Pallotti wetlands, the topography of the land-
scape which includes middle ridges river floodplains, depressions, and valley bottoms
which spatially divide the TRUP (CoCT 2003: 11). These natural amenities are major as-
sets as they afford the site a unique character which should be preserved.
Additionally, the TRUP has significant heritage value in that it was one of the earliest
places of human settlement during the pre-colonial and colonial eras.
It is thus apparent that the TRUP site is complex and fragmented in nature and any
development on a precinct of the site would potentially present a developer with
many challenges. The site’s respective strengths, weaknesses, opportunities and
threats drawn from the body of this report are summarised in a SWOT analysis (see
Section 10). The overall challenge is to ensure that the site plays an optimal role within
the metropolitan area.8
6. Legislative and Regulatory Context
6.1 Introduction
It is important to note that the individual, recognisable benefits of a project conceal
the true benefits if the project diminishes benefits elsewhere in the area. The econom-
ic desirability is therefore essential to determine whether the proposed development
complements economic planning as reflected in spatial development planning. It is
not sufficient that the development results in some positive spin‐offs if it is not compat-
ible with planning guidance designed to maximise the overall economic potential of
an area. Regulatory policies and guidelines are central to economic development
planning and are prepared in order to guide overall development of an area, industry
or a subindustry in a direction that local and provincial authorities see as desirable.
In order to place the potential TRUP development in the correct regulatory perspec-
tive, various legislative frameworks, policies, guidelines and district plans are consid-
ered in the context of the TRUP site. These discussions are ordered according to the
geographic scale that each document addresses i.e., national scale to site level.
6.2 Relevant Regulations, Policies and Legislation
6.2.1 National Development Plan 2030
This National Development Plan 2030 (NDP) was the result of work performed by the
National Planning Commission to assess the country’s achievements and shortcom-
ings since 1994 and culminated in a draft national plan released in November 20111.
The TRUP project may assist in fulfilling some of the objectives of the plan – mainly con-
tained in Chapter 3 (Economy and Employment) and Chapter 8 (Transforming Human
Settlements).
The TRUP is of substantial size, centrally located in Cape Town and close to a number
of transport routes. Should it be successful, a development on the TRUP site, theoreti-
cally allows the realisation of the following NDP Chapter 3 objectives:
Reducing the unemployment rate by creating jobs;
Increasing the number of adults working and the labour force participation
rate;
Increasing the GDP; and
Broadening ownership of property assets to disadvantaged groups.
Chapter 8 of the NDP addresses urban inefficiencies in the space economy and the
housing market:
1 National Planning Commission. N.d. National Development Plan 2030: Our future – make it work. p. 25.9
Entrenched spatial patterns across all geographic scales that exacerbate so-
cial inequality and economic inefficiency;
Imbalances between location of jobs and people;
Land markets do not operate effectively for the poor to support urban liveli-
hoods;
The growth of property value has led to an overall average house price that
has made housing unaffordable to many South Africans, and has further ex-
cluded participation in the property market by historically excluded groups.
The growth has largely benefited middle- and higher-income groups;
There is a growing ‘gap market’ as many households with an income above
the threshold for receiving a subsidised house have neither access to a private
bond nor adequate government support;
Inadequate attention is paid to rental accommodation across income bands.
There is insufficient incentive for public and private investors to invest in rental
housing. The government lacks operational capacity to manage rental stock;
and
Despite efforts to transform South Africa’s urban areas, many housing projects
do not create socially and economically sustainable urban spaces.
A strategically chosen catalytic intervention such as the TRUP site may assist (albeit in
a small way) in the densification of Cape Town and contribute to equitable resource
allocation to promote better located and more affordable housing and settlements.
Spatial transformation in a manner that supports locally driven spatial governance will
thus be facilitated. The social and environmental function of land could also be
properly acknowledged over and above the value of land as a marketable com-
modity.
6.2.2 Draft Western Cape Provincial Spatial Development Framework 2014
The themes of the Draft Western Cape Provincial Spatial Development Framework are
grouped according to four inter-related themes, namely:
Introducing a transversal system of spatial governance;
Sustainable use of the Western Cape’s spatial resources;
Opening-up opportunities in the provincial space-economy; and
Developing integrated and sustainable human settlements.
There are various policies stemming from each theme. Of these themes, the space-
economy and settlements themes are perhaps the most important for the TRUP site.
The space-economy theme is high on the provincial agenda as a dynamic space-
economy can stimulate livelihood and income-earning opportunities, draw private
investment, and encourage inclusive growth, while human settlements that address
informality, poor accessibility, inadequate housing delivery, low urban densities, exclu-
sion and inefficient urban land markets.10
6.2.3 Provincial Land Disposal Policy
The Government Immovable Asset Management Act No 19 of 2007 stipulates that
when an immovable asset is acquired or disposed of, best value for money must be
realised. Best value for money has been defined as “...the optimization of the return
on investment in respect of an immovable asset in relation to functional, financial,
economic and social return, wherever possible…” and as such is not restricted to a
“money related” definition only. However, the social return is not normally factored
into calculating the best value for money. The transfer of State Land2 to municipalities
is governed by clear legislative and operational processes, albeit cumbersome when
used.
Consideration of government-owned land disposal (and/or development) must be a
citywide rather than a project-level intervention. This will facilitate, inter alia, inter-
governmental cooperation and effective monitoring of urban transformation. In this
regard, the local municipality will be a key role-player, if not in the initial stage of con-
ceptualising the development, then in the decision-making regarding land-use
change, infrastructure and erection of structures.
6.2.4 CoCT Integrated Development and Human Settlement Plans
The City of Cape Town’s Integrated Development Plan (IDP)3 provides the strategic
framework that guides the municipality’s planning and budgeting over the course of
each political term. The CoCT sets out to do this by means of building on the five key
pillars of:
• The opportunity city;
• The safe city;
• The caring city;
• The inclusive city and
• The well-run city.
A development at TRUP could address several of these strategic focus areas. The
“opportunity city” is aligned with the WCG’s goal of creating growth and jobs while it
is also linked to several national government outcomes. In the “opportunity city” the
core focus is to create an enabling environment for economic growth and job crea-
tion. The city sets itself the goal of maintaining social and economic infrastructure to
ensure infrastructure-led economic growth and development, whilst also leveraging
the city’s assets to drive economic growth and sustainable development. Various
programmes are identified to accomplish these objectives.
The “caring city” strategic focus area is aligned with the WCGs goal of developing
integrated and sustainable human settlements as well as several national government
2 State land is land which is held by the national and provincial governments, but which excludes local-authority and
parastatal land.
3 City of Cape Town. 2012. Integrated Development Plan 2012 – 2017: 2014/2015 review. Cape Town: City of Cape
Town.11
goals. One particularly important objective of the “caring city” is to ensure increased
access to innovative human settlements for those who need it. Identifying land and
planning housing developments along the city’s development corridors, and the city’s
integrated human settlements and densification programmes are essential elements
to achieve this objective.
The Integrated Human Settlement 5-Year Strategic Plan4 contains the following state-
ments that:
Greater efficiencies regarding densification need to be achieved in dealing
with vacant land inside the urban edge;
Such land be used to its maximum potential through infill initiatives, the release
of unused land belonging to other state departments, and mixed-use retail and
residential development along key development nodes and transport corri-
dors; and
Where urban edge development cannot immediately be undertaken, the land
needs to be banked for future use.
The issues of acquisition, transfer and reservation of land is also discussed in the con-
text of creating new living environments. In this regard, it is recommended that with
the delivery of low-cost housing, the focus must shift towards addressing settlement
inefficiencies. This can be achieved through the development of integrated human
settlements that contribute to a more compact settlement form by providing a range
of inclusionary housing opportunities, combined with community and socio-economic
opportunities for those who will occupy them5.
6.2.5 City of Cape Town SDF (2012) (CTSDF)
The aim of the Cape Town Spatial Development Framework (CTSDF)6 is to guide the
future growth of the city. Several of the most important goals of the CTSDF are to:
Align the city’s spatial development goals, strategies and policies with those of
the national and provincial spheres of government;
Indicate areas best suited to urban development, the areas that should be
protected, and the areas where development may occur if it is sensitively
managed;
Indicate the desired phasing of urban development;
Guide changes in land-use rights;
Guide proposals contained in the more detailed District Spatial Development
Plans;
Help spatially guide, co-ordinate, prioritise and align public investment infra-
structure and social facilities in the City’s 5-year Integrated Development Plan;
Provide guidance to direct decision making on the nature, form, scale, and lo-
cation of urban development, land use change, etc.; and,
4 City of Cape Town. 2012. Integrated Human Settlement 5-Year Strategic Plan: 2013/14 review, p. 18.
5 Ibid, p. 34.
6 City of Cape Town. 2012. Cape Town Spatial Development Framework: Statutory Report. p. 8.12
Ensures that nobody is exempted from their rights and obligations in terms of
the zoning scheme and other legislation.
The CTSDF contains three key strategies. The first broad strategy is to “plan for em-
ployment and improve access to economic opportunities”. Here the sub-strategies
that relate to TRUP are promoting inclusive, shared economic growth and develop-
ment; addressing spatial economic imbalances; and integrating land use, economic
and transport planning are imperative.
The second key strategy is to “manage urban growth, and create a balance be-
tween urban development and environmental protection”. Sub-strategies relevant to
TRUP are facilitating urban development and encouraging a more compact form of
development.
The third key strategy is to “build an inclusive, integrated vibrant city”. The transfor-
mation of the apartheid city; proactively supporting publicly-led land reform and new
housing delivery; and encouraging integrated settlement patterns are the sub-
strategies that warrant mention from the perspective of TRUP.
It is also important to note the CTSDF’s relevance to planning decisions. Under the
new legislative regime, a development application needs to be consistent with the
CTSDF unless there are site-specific circumstances preventing this.
6.2.6 Cape Town Central City Regeneration Programme (CTCCRP)
The WCG aspires through the Cape Town Central City Regeneration Programme
(CTCCRP) to:
Unlock Cape Town’s potential to become a city that serves the needs of all its
citizens as one of the best cities in the world;
Leverage private sector investment, capacity and expertise;
Refurbish and achieve savings in the operation and maintenance of its proper-
ties; and
Generate an income stream to finance provincial property development and
maintenance.
The goal is that the CTCCRP will engender economic growth and generate job op-
portunities. In addition, it will facilitate access to urban resources, improve social co-
hesion and enable environmental sustainability and energy efficiency. To this end,
several provincially-owned properties within the TRUP site are being explored for de-
velopment as part of the CTCCRP7.
7CityThinkSpace. 2012. The Two Rivers Urban Park local area sustainable neighbourhood: High-level development and
urban design concept. p. 4.13
6.2.7 The Table Bay District Plan (2012)
The Table Bay District Plan8 consists of eight documents developed for each of the
planning districts of the CoCT, all of which are informed by the citywide Cape Town
Spatial Development Framework (CTSDF). The district plan is medium-term strategy
with an approximate ten-year planning frame guiding spatial development processes
with each district.
The strategic actions it pursues are the following:
Supporting and enabling the implementation of the National Spatial Develop-
ment Perspective (NSDP), Provincial Growth and Development Strategy (PGDS)
and Spatial Development Framework (PSDF), Cape Town’s Integrated Devel-
opment Plan (IDP) and Cape Town SDF within the district;
Carrying out part of a package of decision support tools to facilitate land use
and environmental decision-making processes;
Delineating fixes and sensitivities as informant to statutory decision-making pro-
cesses;
Providing clear guidance to the form and direction of areas for new urban de-
velopment in the district in a way aligned with the principles and policies of
higher-level planning frameworks;
Offering a foundation for land-use change inside the current footprint as well as
strategic public and private investment initiatives facilitating the achievement
of the principles and policies of higher-level planning frameworks; and
Informing the establishment of priorities for more specific local-area planning
analyses and frameworks providing detailed direction to land-use manage-
ment and public and private investment.
With the above underpinning strategic activities as a background, the TRUP features
in some key areas of the Table Bay District Plan. These are:
It forms part of “Strategy 2: Manage a sustainable form of urban growth and
create a balance between urban development and environmental protec-
tion” of the District Plan. The TRUP site forms a key natural structuring element at
the district scale in that it can provide sport and recreation facilities as part of
the open space network. It can also form part of a coast-to-coast green sys-
tem within the CoCT;
As TRUP is regarded as an “other structuring open space” spatial planning cat-
egory, there are district development guidelines applicable to it. Important
guidelines are:
o Avoidance of development that would compromise open space link-
age;
8City of Cape Town. 2011. Table Bay District Plan: Spatial Development Plan & Environmental Management Frame-
work. Cape Town: City of Cape Town.14
o Development bordering open spaces should be focussed towards the
open space to stimulate the utilisation and passive surveillance of these
areas;
o Passive surveillance of open space interfaces can be improved by 2-3
storey medium-density developments adjacent to them; and
o Small-scale commercial activities may enhance open space where ap-
propriate to the setting;
In terms of the District Plan, TRUP is also considered a nature-based “destination
place”. Some of these areas’ key development guidelines include:
o The promotion of greater tourism and recreational opportunities where
potential exists for significant improvement;
o Development opportunities could be realised from these improvements
in abutting urban areas; and
o The maintenance and enhancement of the character of the natural,
heritage and recreational aspects of valuable recreational and tourism
nodes. Small, valuable natural special places should also be maintained
as they contribute to human quality of life, recreation, tourism and there-
fore the social sustainability of the precinct.
The TRUP forms part of several Environmental Impact Management Zones
(EIMZ) in the Table Bay district, for example Hydrological Zone, and Conserva-
tion and Biodiversity Priority Zone. These zones are homogeneous areas with
similar attributes and must be considered in planning, development and envi-
ronmental and land management decisions.
6.2.8 The Two Rivers Urban Park Contextual Framework (2003)
The Conceptual Framework Review (CFR)9 strongly emphasises the need to conserve
the environmental attributes of the Two Rivers Urban Park. While the point is made that
the TRUP is well located within the metropolitan economy, the potential broader so-
cio-economic benefits of the site, receives little attention in the conceptual frame-
work.
The CFR 2003 emphasises:
The need to rehabilitate, protect, secure and enhance the intrinsic ecological
qualities of the site;
The need to conserve the unique cultural landscape that it provides;
The possibility to use the site to encourage environmental education;
To maximise opportunities for all people; and
To promote sustainable development.
The policy statement in the CFR recognises that the site is adjacent to dense residen-
tial, commercial and industrial land uses and is characterised by excellent access.
9City of Cape Town. 2003. Two Rivers Urban Park Conceptual Framework and Phase 1 Environmental Management
Plan. Cape Town: City of Cape Town.15
Yet, the relationship between the TRUP and its role in the surrounding economy seems
to have received very little further analysis.
In considering the opportunities and constraints associated with TRUP, mention is
made of the potential for mixed use developments, the optimisation of existing land,
and the scope for developments on the edges of the development. But a warning is
also given that future developments could have a negative impact on the natural
environment.
The CFR highlights certain constraints that would impact on future developments and
the economic role that the site could play:
It only proposes developments on under-utilised land which will assist in giving
form and clarity to the Park;
Developments are primarily considered on the edges of the Park; and
While the point is made that “mixed use’’ developments have a role to play in
ensuring the sustainability of the TRUP, little attention is given to the potential
take-up and the characteristics of this take-up.
From a socio-economic perspective the most important gaps of the CFR 2003 are as
follows:
Little attention is given to the socio-economic benefits (benefits beyond envi-
ronmental considerations) that the TRUP project could provide to the local
community;
Although the point is made that the site is located adjacent and is part of a vi-
brant urban built environment, the relationship is not considered to any degree;
and
The parameters which will influence the long term financial sustainability of
TRUP receive very little attention.
Additionally, little attention is given in the CFR (2003) to:
A socio-economic analysis of the catchment area in which the site is located;
Market and economic dynamics and take-up rates; and
The broader socio-economic context and the positive impact that the site
could have in enhancing the urban environment and thus quality of life.16
7. Socio-Economic and Demographic Profile of
the Population in the Study Area
7.1 Aligning the Study Areas and Available Statistics
The approach adopted for the preparation of the socio‐economic and demographic
profile of communities within the area that surrounds the TRUP site entailed analysis of
Census 2011 sub-places within a 5 km concentric circle from the centre point of the
TRUP site. This approach was used owing to the need to understand the socio-
demographic impact of residents within the immediate vicinity of the site. Our choice
of the 5km zone as a study area is based on our observations of population distribu-
tion, economic activities and likely sources of procurement and labour in the areas
surrounding the proposed the TRUP development. We have also included data for the
Table Bay District of Cape Town City of Cape Town for purposes of comparison. We
believe that our approach offers a realistic socio-demographic and economic profile
of the population most likely to be affected by the proposed TRUP development as
well as the potential that it could offer to underpin the demand for space at TRUP.
Figure 2 is a depiction of the TRUP site’s location, the various planning districts sur-
rounding the site (including the Table Bay District), Census 2011 sub places and the 5
km concentric zone.
Figure 2: CoCT Planning Districts and the 5 km Concentric Zone as Applied to the Area
Surrounding the Proposed TRUP Development17
7.2 Limitations of the Demographic Analysis
We identified a number of limitations that constrain the analysis:
Socio‐demographic and economic statistics for specific sub-areas of Cape
Town are outdated; and
Comparisons are seldom possible between the 1996, 2001 and 2011 census
years due to changes in the enumeration areas.
Thus, the 2011 data is not necessarily representative of the current demographics of
the area given presumed population growth over the past four years. Despite the
constraints noted above, the approach adopted for the assessment offers a relatively
accurate indication of the socio‐economic and demographic profile of the popula-
tion residing in the specified zones in 2011.
7.3 Socio-Economic and Demographic Profile
7.3.1 Socio‐Demographic Profile of the Study Area Population
The following socio‐demographic profile of the various areas surrounding the study
area is based on data from the 2011 National Population Census Survey. A summa-
rised socio‐demographic profile is presented in Table 1 for the 2011 census year.
Table 1:
A socio‐demographic profile of the study areas based on the 2011 Census
5km zone Table Bay District CoCT
Population
Number % Number % Number %
group
Black 88 148 39.1% 86 469 41.9% 1 444 939 38.6%
Coloured 87 104 38.7% 53 505 25.9% 1 585 286 42.4%
Asian 6 391 2.8% 4 657 2.3% 51 786 1.4%
White 37 294 16.6% 54 981 26.7% 585 831 15.7%
Other 6 285 2.8% 6 685 3.2% 72 184 1.9%
Total 225 221 100% 206 298 100% 3 740 026 100%
Gender Number % Number % Number %
Male 110 330 49.0% 100 859 48.9% 1 830 699 48.9%
Female 114 891 51.0% 105 439 51.1% 1 909 327 51.1%
Total 225 221 100% 206 298 100% 3 740 026 100%
Age classifica-
Number % Number % Number %
tion
0-18 59 421 26.4% 47 273 22.9% 1 161 374 31.1%
19-30 61 984 27.5% 58 147 28.2% 926 123 24.8%
31-40 34 465 15.3% 35 440 17.2% 592 673 15.8%
41-50 26 239 11.7% 24 004 11.6% 454 916 12.2%
51-65 27 512 12.2% 25 444 12.3% 415 435 11.1%
Over 65 15 600 6.9% 15 990 7.8% 189 505 5.1%
Total 225 221 100% 206 298 100% 3 740 026 100%18
It is apparent both the 5 km zone and the Table Bay District have similar population
sizes, namely around 225 000 and 206 000 respectively. The population of the CoCT
was estimated at 2 892 243 in 2001 and 3 740 026 in 2011, representing an average
annual growth of 2.6%. An analysis based on the 5 km concentric zones suggests that
over 83% of the population residing within this area are non-white. Within the Table
Bay District, the greatest proportion (42%) of people are Black, with White comprising
the second largest group at 27%, and Coloured a close third at 26%. In the CoCT al-
most 39% are Black, slightly more than 42% Coloured, and nearly16% White. Males and
females are almost equally split in the 5 km zone, the Table Bay District and the CoCT.
It is evident in the 5 km zone that over half (about 54%) of the population is below 30
years of age, while this figure is closely mirrored in the Table Bay District at 51%. The
other age cohorts are largely similar for both these study areas. In the CoCT almost
56% are below 30 years of age.
7.3.2 Population Analysis
Table 2 provides an alternative breakdown of the population distribution of residents
within 5 km of the site and inside the Table Bay District in 2011. The findings suggest
that about 6% of the CoCT population live within 5 km of the TRUP, while a slightly low-
er percentage of people reside in the Table Bay District. The relatively small number of
people living in the Table Bay District may seem somewhat surprising given that there
are only eight such districts, however, a very substantial part of its area comprises the
Table Mountain National Park. An analysis of the breakdown per population groups
indicates that Black residents living within 5 km of the site comprises 2.4%, of the total
CoCT population – a figure that is mirrored in the Table Bay District. Coloureds and
Whites in the 5km zone respectively contribute 2.3% and 1% to the total CoCT popula-
tion, while in the Table Bay District these population groups respectively provide 1.4%
and 1.5% to the total CoCT population.
Table 2: Breakdown of the population in the Table Bay District and the 5km zone
Black Coloured Asian White Other Total
Population within 5km zone 88 148 87 104 6 391 37 294 6 285 225 221
Contribution to the CoCT popula- 2.4% 2.3% 0.2% 1.0% 0.2% 6.0%
tion
Population within Table Bay District 86 469 53 505 4 657 54 981 6 685 206 298
Contribution to the CoCT popula- 2.3% 1.4% 0.1% 1.5% 0.2% 5.5%
tion
CoCT population 1 444 939 1 585 286 51 786 585 831 72 184 3 740 026
7.3.3 Analysis of Education Levels
An analysis of education levels in the study areas for 2011 is provided in Table 3. The
results indicate that 1% of persons living within 5 km of the site had no schooling (in-
cluding those under the school age), while a similar fraction of the population in the
Table Bay District had no schooling in 2011. The assessment further suggests that al-
most 70% (nearly 63% in the Table Bay District) of persons living within 5 km of the site
received Grade 1 to Grade 12 schooling or a technical qualification, diploma or cer-19
tificate, whereas approximately 13% (more than 17% in the Table Bay District) ob-
tained Matric with a higher diploma or degree qualification. Apparent from Table 3 is
that the CoCT has proportionally less people with post-matric qualifications than both
study areas.
Table 3: Education levels for the population per specified zone in 2011
Table Bay City of
5km zone
Education level District Cape Town
Total % Total % Total %
No schooling 3 270 1% 2 684 1.3% 80 207 2.1%
Grade 0 4 916 2% 4 100 2.0% 97 934 2.6%
Grade 1 / Sub A - Grade 12 / Std 143 48 64% 116 496 56.5 2 663 296 71.2
NTC I / N1/5 NIC/ V Level 2 - N6 /
10 / Form 2 5043 1% 2 193 1.1% % 43 288 1.2% %
Certificate/diploma
NTC 6 with less than 1 105 0% 1 126 0.5% 13 997 0.4%
Certificate/diploma
Grade 12 with Grade 12 9 039 4% 9 720 4.7% 113 758 3.0%
Higher Diploma 7 918 4% 10 139 4.9% 99 149 2.7%
Bachelor’s Degree 8 170 4% 10 293 5.0% 75 333 2.0%
Bachelor’s Degree and Post grad- 3 183 1% 4 189 2.0% 27 944 0.7%
Honours degree - Higher Degree
uate Diploma 8 522 4% 11 328 5.5% 65 679 1.8%
Other
Masters / PhD 1 062 0.5% 1 364 0.7% 13 905 0.4%
Not applicable 32 050 14% 32 665 15.8 445 536 11.9
Grand Total 225 100 206 298 100% 3 740 026 100%
221 % % %
7.3.4 Analysis of Age Levels
An analysis of the age levels among the population within 5 km, the Table Bay District
and the CoCT is intended to provide an indication of the population that could be
considered economically active i.e., persons between the ages of 19 and 65. The
analysis that follows provides a broad indication of age categories for 2011. The find-
ings are provided in Figure 3 and are based on the zones specified for the analysis.
Figure 3: An Assessment of Percentage Contributions to Age Levels for 2011
The findings depicted in Figure 3 indicate that 26% of the population within 5 km of the
site are below 19 years of age, a slightly higher figure than the 23% for the Table Bay
District. The CoCT has 31% of people in this age cohort. Our analysis also suggests that
67% of the population within 5 km from the site are in the working age category of
between 19 and 65 years of age, while the working cohort in the Table Bay District20
represents 69% of the total population. The assessment indicates that every two per-
sons who would normally be considered economically active i.e., between 19 and 65
years of age, could support another person that is not economically active within 5
km of the site. For the City of Cape Town this dependency ratio is 1.8 and for the Table
Bay District it is 2.3.
A more detailed deconstruction of the population presented in Figure 4 indicates that
Black and Coloured residents under 19 years of age respectively represent 40% and
43% of the total population within 5 km, while the White population group 18 years or
younger represents 10% of the total population living within this zone.
(a) (b)
(c)
Figure 4: Age Cohorts for Various Areas (a) 5km Zone from the TRUP Site, (b) Table Bay
District, (c) City of Cape Town
An analysis of dependency factors suggests that among the Coloured population
residing within 5 km of the site, 1.7 persons that have the potential to be economically
active could support another economically inactive person (i.e. younger than 19
years and older than 65 years of age). The dependency figures for the other popula-21
tion groups are 2.3 for Black African and 2.1 for White residents. The unusually high
dependency figure for White residents can possibly be explained by the high number
of retirees in the 5 km zone.
7.3.5 Analysis of Household Income Levels
Table 4 provides the income ranges for households as defined by various areas perti-
nent to the TRUP site. Of households that disclosed their income, 13.8% of the house-
holds residing within 5 km of the proposed development had no income, 41% earned
less than R76 401 per annum (excluding households with no income) and 6.5% of
households earn more than R614 400 annually.
Within the Table Bay District, 12.5% of the households do not have an income, 34.6% of
the households have an annual income of less than R76 401, whereas 9.6% of house-
holds declared an income of more than R614 400 per annum.
Table 4: Distribution of annual household income for each specified area in 2011
5km Table Bay District CoCT
Income category
No % No % No %
No income 9 291 13.8% 8 752 12.5% 146 517 13.7%
R 1 - R 4800 1 300 1.9% 1 324 1.9% 29 374 2.7%
R 4801 - R 9600 1 781 2.6% 1 744 2.5% 42 418 4.0%
R 9601 - R 19 600 6 367 9.4% 5 010 7.1% 113 276 10.6%
R 19 601 - R 38 200 8 782 13.0% 7 699 11.0% 170 824 16.0%
R 38 201 - R 76 400 9 425 14.0% 8 517 12.1% 154 427 14.5%
R 76 401 - R 153 800 9 779 14.5% 10 114 14.4% 139 348 13.0%
R 153 801 - R 307 600 9 559 14.2% 11 066 15.8% 126 625 11.8%
R 307 601 - R 614 400 6 849 10.1% 9 187 13.1% 92 860 8.7%
R 614 001 - R 1 228 800 3 133 4.6% 4 597 6.6% 38 018 3.6%
R 1 228 801 - R 2 457 600 875 1.3% 1 393 2.0% 9 749 0.9%
R 2 457 601 or more 387 0.6% 768 1.1% 5 065 0.5%
Unspecified 2 0.0% 6 0.0% 73 0.0%
Grand Total 67 529 100% 70 176 100% 1 068 573 100%
In the CoCT as a whole, 13.7% of the households have no income, 47.8% of the
households earn less than R76 401, while only 4.9% of households earn more than R614
400 per annum.
7.3.6 Employment and Skills Level Analysis
An employment perspective for the different zones in CoCT is provided in Table 5 with
specific reference to the number of employed, unemployed and not‐economically
active persons per population group.
Table 5 indicates that only 2.7% of Whites residing within 5 km of the site are unem-
ployed compared to 13.7% Blacks and 6.5% Coloureds. Similar low unemployment22
figures for Whites also prevail in the Table Bay District and the CoCT. Unemployment
figures for Blacks are 13.4% and 16.1% in the Table Bay District and CoCT respectively.
Unemployment statistics for Coloureds in the Table Bay District are 5.9% and in the
CoCT 9.5%. An assessment of the dependency ratios for the various areas is based on
the premise that for each person who is employed, a factor of people are unem-
ployed or economically inactive.
The findings of the research for the various areas suggest a very similar dependency
ratio of 0.99, 1.11 and 0.99 for the population within 5 km, the Table Bay District and
the CoCT, respectively. This implies that every employed resident in the various areas
has to support one unemployed or economically inactive person.
Table 5: Employment by population group for specific areas
5km zone
Employment category Black % Coloured % Indian % White % Other %
Employed 27 084 30.7% 31 178 35.8% 2 635 41.2% 17 136 45.9% 2 471 39.3%
Unemployed 12 069 13.7% 5 683 6.5% 204 3.2% 997 2.7% 356 5.7%
Economically inactive 26 849 30.5% 23 314 26.8% 2 017 31.6% 8 383 22.5% 1 618 25.7%
Not applicable 22 146 25.1% 26 928 30.9% 1 535 24.0% 10 779 28.9% 1 840 29.3%
Total 88 148 100% 87 103 100% 6 391 100% 37 295 100% 6 285 100%
Table Bay District
Employment category Black % Coloured % Indian % White % Other %
Employed 26 430 30.6% 20 108 37.6% 1 990 42.7% 28 611 52.0% 2 547 38.1%
Unemployed 11 609 13.4% 3 138 5.9% 129 2.8% 1 123 2.0% 332 5.0%
Economically inactive 27 329 31.6% 14 420 27.0% 1 571 33.7% 10 261 18.7% 2 060 30.8%
Not applicable 21 101 24.4% 15 839 29.6% 966 20.7% 14 987 27.3% 1 745 26.1%
Total 86 469 100% 53 505 100% 4 656 100% 54 982 100% 6 684 100%
City of Cape Town
Employment category Black % Coloured % Indian % White % Other %
Employed 441 911 30.6% 512 551 32.3% 21 369 41.3% 287 029 49.0% 31 379 43.5%
Unemployed 233 126 16.1% 150 263 9.5% 2 350 4.5% 14 173 2.4% 6 078 8.4%
Economically inactive 349 834 24.2% 415 642 26.2% 14 724 28.4% 108 062 18.4% 15 721 21.8%
Not applicable 420 068 29.1% 506 831 32.0% 13 343 25.8% 176 567 30.1% 19 006 26.3%
Total 1 444 939 100% 1 585 287 100% 51 786 100% 585 831 100% 72 184 100%
7.3.7 Formal and Informal Sector Employment
In Table 6 a further assessment of employment levels is provided by economic sector
and by population group for the economically-active population residing in specific
areas.
Table 6: Classification of the economically active population in various areas per economic
sector and population group in 2011
Formal sector
5km Table Bay CoCT
Population group
No % No % No %
Black 21 734 26.7% 21 047 25.9% 317 785 24.6%
Coloured 27 731 34.1% 17 748 21.8% 435 487 33.7%
Indian 2 340 2.9% 1 708 2.1% 18 529 1.4%
White 15 266 18.8% 25 364 31.2% 253 801 19.6%
Other 2 065 2.5% 2 096 2.6% 21 841 1.7%
81.1%
Subtotal 69 136 85.0% 67 963 83.6% 1 047 44323
Informal sector
Black 2 531 3.1% 2 316 2.9% 53 897 4.2%
Coloured 2 125 2.6% 1 214 1.5% 44 712 3.5%
Indian 156 0.2% 118 0.1% 1 520 0.1%
White 1 034 1.3% 1 726 2.1% 19 332 1.5%
Other 225 0.3% 200 0.2% 4 877 0.4%
Subtotal 6 071 7.5% 5 574 6.9% 124 338 9.6%
Private households
Black 2 779 3.4% 3 048 3.8% 61 214 4.7%
Coloured 1 452 1.8% 1 235 1.5% 29 751 2.3%
Indian 163 0.2% 163 0.2% 1 388 0.1%
White 1 526 1.9% 3 016 3.7% 23 328 1.8%
Other 219 0.3% 262 0.3% 4 205 0.3%
Subtotal 6 139 7.5% 7 724 9.5% 119 886 9.3%
Total 81 346 100% 81 261 100% 1 291 667 100%
The findings applicable to the 5 km zone suggest that 85% of this population are em-
ployed in the formal sector, followed by the informal sector at 7.5%. In the Table Bay
District, the formal sector employs 83.6% of the economically active population, fol-
lowed by the informal sector with 6.9%. Our assessment also indicates that 81.1% of
the people in the CoCT are employed in the formal sector, and 9.6% in the informal
sector.
7.3.8 Dwellings and Tenure Status
An examination of Table 7 reveals that 12.2% of households in the 5 km zone live in
informal housing10, while almost 87% reside in formal housing11. A slightly smaller per-
centage (11.3%) of households in the Table Bay District live in informal housing and
nearly 88% in formal housing. Compared to these two areas, the CoCT has a substan-
tially larger proportion (almost 21%) of people living in informal housing and as a result
a smaller percentage staying in formal housing (about 78%). Regarding tenure, it is
apparent that 44% (40.4% of which live in formal dwellings) of households in the 5km
zone rent their dwellings. In the Table Bay District this figure rises to almost 47% of which
about 44% reside in formal dwellings. Interestingly, in the CoCT only about 30% of
households rent their homes (24.5% of whom live in formal dwellings).
10Informal housing includes caravan/tent; Informal dwelling (shack; in backyard); informal dwelling (shack; not in
backyard; e.g. in an informal/squatter settlement or on a farm); traditional dwelling/hut/structure made of traditional
materials.
11 Formal housing includes cluster house in complex; flat or apartment in a block of flats; house or brick/concrete block
structure on a separate stand or yard or on a farm; house/flat/room in backyard; room/flatlet on a property or larger
dwelling/servants quarters/granny flat; semi-detached house; townhouse (semi-detached house in a complex).You can also read