ADVANCING
CHILD SAFETY IN INDIA:
Implementation is the key
A Report by NIMHANS
←
→
Page content transcription
If your browser does not render page correctly, please read the page content below
ADVANCING CHILD SAFETY IN INDIA: Implementation is the key A Report by NIMHANS
NATIONAL INSTITUTE OF MENTAL HEALTH & NEURO SCIENCES

Title                                Advancing Child Safety in India - Implementation is the Key

Copyright                            NIMHANS

ISBN                                 978-81-941838-0-8
Year of Publication                  2019
Suggested Citation                   Gururaj G., Gautham M. S. Advancing Child Safety in India - Implementation is
                                     the Key. Bengaluru, 201-9. National Institute of Mental Health & Neuro Sciences,
                                     Publication Number: 161

Address for                          Dr. Gururaj G.
Correspondence                       Senior Professor of Epidemiology and Dean - Neuro Sciences
                                     Department of Epidemiology
                                     Center for Public Health
                                     WHO Collaborating Centre for Injury Prevention and Safety Promotion
                                     National Institute of Mental Health & Neuro Sciences
                                     Bengaluru - 560 029, India
                                     Email: epiguru1@gmail.com, guru@nimhans.ac.in

                                     Dr. Gautham M. S.
                                     Associate Professor of Epidemiology
                                     National Institute of Mental Health & Neuro Sciences
                                     Bengaluru - 560 029, India
                                     Email: drgauthamms@nimhans.ac.in
Keywords                             Child Safety, Injury Prevention, School Safety, Road Safety, Child Mortality, Fire
                                     Safety, Trauma Care, Rehabilitation, Safety Policies, Legislations

Designing                            STIR

Acknowledgments                      We sincerely acknowledge Prof. B. N. Gangadhar, the Director and Dr. Sekar,
                                     Registrar of NIMHANS for all support towards completing the study. Our sincere
                                     thanks to the team Underwriters Laboratories for funding and support.
                                     Our thanks to Dr. Anaurene Roy (Project Co-ordinator) and Ms. Kavya Nadig
                                     (Project Officer) for assistance in data collection, collation and co-ordination
                                     of the project activities. Thanks to Mr. Shivanna K.V., Mr. Anand B.C., and Mr.
                                     Raghavendra J., Mr. Prakash, Mr. Mahendra, Mr. Ganesh (Field Information
                                     officers, Dept. of Epidemiology) for their support in data collection.

                                     Sincere thanks to the Dept. of Education, Govt. of Karnataka for their support in
                                     conducting safety appraisal in schools.

Opinions expressed in this report are those of the authors alone. This publication is published by NIMHANS which is a WHO
collaborating Centre, and it is not a publication of WHO. The institution/authors are responsible for the views expressed in this
publication, and they do not necessarily represent the views of the World Health Organization.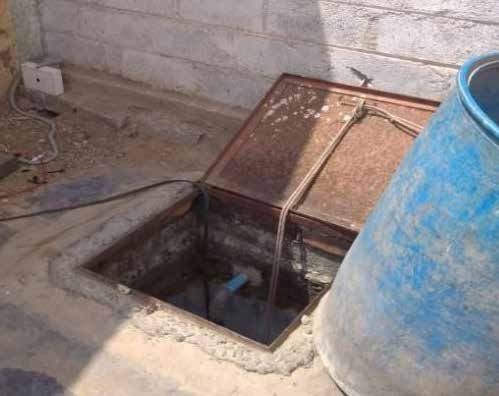
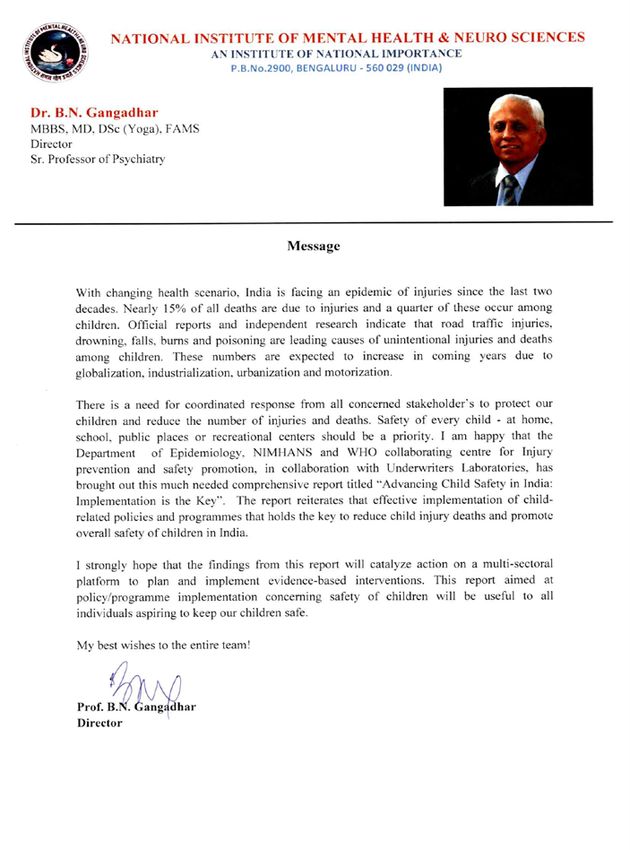
Message
Message

          Underwriters Laboratories is a non-profit organization that is
          committed to making the world a safer, more secure and sustainable
          place. Over the years, we have built long-standing partnerships with
          various Government bodies, research organizations and leading
          academic institutions to conduct rigorous independent research,
          share knowledge through safety education and public outreach
          initiatives and develop standards to ensure safer environments across
          domains. In India, a large part of our focus has been on furthering
          education and awareness about best practices in safety.

          Our latest initiative in this regard has been a comprehensive research
          project on ‘Child Injury Prevention’. Undertaken in association with the
          National Institute of Mental Health & Neuro Sciences (NIMHANS) - a
          leading academic institution, this research aims to not only sensitize
          various audiences about the pressing need to implement safety
          practices in and around schools, but also intends to identify measures
          to implement the same. This report is designed to offer an in-depth
          view into the current scenario with regard to child injuries in school
          environments as well as educate the reader about the many preventive
          measures that parents, students and school authorities can resort to,
          in order to minimize injuries among children. While this report is a
          consolidated document comprising data mined from various national
          and international sources, on-ground research results and insights,
          and recommendations on safety practices; several versions of the
          same (infographics, safety toolkits, etc.) will be disseminated in the
          course of the next few months to schools, policy makers, and others
          to ensure that the learning gained by virtue of this exercise are put
          into practice.

          I would like to sincerely thank NIMHANS for spearheading this
          research, the schools that participated in this research, as well as our
          field teams for helping bring our vision of safer school environments
          to fruition.

                                                Lakshmi Nair
                                                Program Manager - Public Safety Mission
                                                Underwriters Laboratories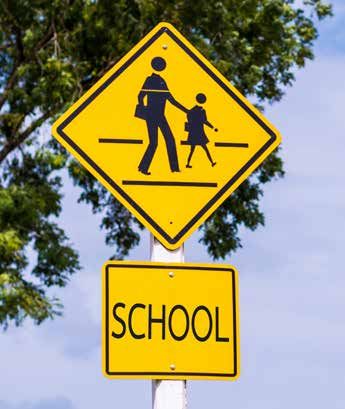
Preface
With nearly 548 million children aged less than 18 years in India, child safety and injury prevention are a vital
investment. Unintentional injuries accounted for nearly 7.2% of all causes of deaths and 6.3 million DALYs
among children

Table of contents
Messages
Preface
Executive summary
List of abbreviations
List of tables, charts and figures
Section 1: Child safety scenario                                1
Introduction                                                    1
Scope and objectives of the present report                      6
Methodology                                                     6
Injury as a public health problem among children                8
Road traffic injuries                                           20
Fire related injuries                                           27
Drowning                                                        31
Fall injuries                                                   34
Poisoning                                                       37
Section 2: School Safety - An Appraisal                         40
Summary                                                         40
Introduction                                                    42
Importance of school safety programmes                          43
Objectives and methodology                                      44
Results                                                         51
Limitations and challenges                                      61
Section 3: Public health and systems approach to child safety   62
Child injuries are predictable and preventable                  63
Policy, legislations, guidelines and enforcement matters        64
Integrated approaches are useful                                70
Need for strengthening trauma care programmes                   70
Monitoring and evaluation are central to measure success        71
Challenges for implementation                                   71
Section 4: Recommendations`                                     72
Annexures                                                       75
References                                                      82
Executive Summary

A safe and healthy environment for all and for children in particular is an absolute necessity for their
healthy growth and development. Children are susceptible and vulnerable due to their physical size,
difficulty in risk perceptions, impulsivity and risk taking behaviors. However there is limited information
regarding child injuries to plan evidence-based injury prevention interventions in India. NIMHANS and
global safety science company, Underwriters laboratories has developed a national report on child injuries
in India titled “Advancing child safety in India: Implementation is the Key” to help all agencies develop
appropriate programmes in the coming years.

A review of available data on unintentional injuries in India based on national reports, research
studies, government websites and others was conducted. In addition, in phase 1 of their programme,
a safety appraisal was undertaken across 131 (public and private, aided and unaided) schools
in Bengaluru and Kolar district, using a specifically developed mobile application. These schools
were assessed and scored on physical infrastructure, road safety, fire safety and first aid facilities.

Furthermore, current policies for injury prevention and safety promotion in India for children was reviewed.

Some key findings of the research study are:
• Child injuries are a growing public health problem in India with nearly 5,00,000 child deaths in the
   last decade;
• For every intentional injury death among children, three unintentional child injury deaths are reported;
• Children account for 15% of total injury deaths;
• Every day, about 165 children die in India due to an unintentional injury. From an official report in
   2015, it is estimated that 60,445 children aged 0-18 years died as a result of injuries. Out of these,
   45,636 deaths were due to unintentional injuries like road crashes, burns, drowning, poisoning and
   others in year 2015. Officially reported number of child injury deaths were 50,371 of which 39,026
   were due to unintentional injuries.
• Injury deaths were more among boys and children aged between 15-18 years (60% of all deaths).
   Number of deaths among children aged 0-14 years were 24,178 (40% of all deaths).
• Proportion of child injury deaths at the site of injury in rural areas (58%) were higher than urban areas
   (33%).
• Nearly 41% of all fatal injuries occurred on roads followed by 31% at home.
• Road crashes/accidents are the most common cause of child injury deaths in India. RTIs accounted for
   37-38% of deaths among 0-14 years and 62-64% among 14-18 year old children.
• Burns and drowning accounted for 10-11% and 13-19% of all deaths, respectively.
• Falls and poisoning injuries accounted for 5-6% of all deaths among children.
• Nearly 44% of all child injury deaths occurred at site of injury, followed by 37% in hospital and 18%
   during transit to hospital.
• Nearly 1,800,000 children sustained one or more serious unintentional injury(ies) which required
   hospital care for varying periods of time.
• Half the child injury deaths can be averted with efficient trauma care systems.
• Nearly 10% of injured children experience temporary functional limitation varying from one week to
   several months. About 2% of children are left with permanent disability and 12% live with long term
   (>6 weeks) temporary disability.
Safety in schools in Bengaluru and Kolar.
• The research team developed a digitalized (android app-based) safety appraisal tool based on various
existing national level guidelines and quantified safety level (%) in every school at a macro level (not
based on audits).
• Overall safety in schools was observed to be 50.8% of expected levels.
• Safety level grading revealed that 48% of schools were in Grade C (safety between 50-74% of expected).
Grade B were schools whose safety level (%) was between 75-90% (3.1% of schools were Grade B).
Grade A schools are schools with >90% safety level (%) and only one school was categorized in Grade A.
• CCTV surveillance facility was present in nearly 81% of schools.
• Physical infrastructure in schools with respect to safety components (flooring, staircases, corridors,
balconies, windows and railings in buildings and classrooms) were acceptable in majority of the schools
with anti-skid floor being present in 54.2% of the schools.
• In 60% of the schools, there was an easy access to roof posing the risk for fall injuries.
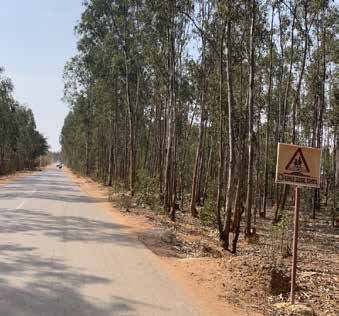
• Safety levels on roads adjoining the schools (in terms of school zone signage, speed limit display,
presence of speed breakers, pothole free roads, footpaths, zebra crossing, supervised lane crossing and
designated dropping/pick up zones) were scored at 20.8% of expected. Only 17% of schools had roads
which showed school zone signage and 11.5% had speed limits displayed. Around 43% of school buses
had CCTV and 58% had GPS tracking system.
• The Supreme Court guidelines for safe commuting to and from schools are followed by 49% of the
schools where the school bus facility was present.
• Fire safety in most schools was compromised as it was only 20%. Most schools did not have fire safety
certificates. Evacuation plans, fire log books, fire detectors and fire alarms were present in less than 8%
of the schools. Most schools (94%) had fire extinguishers.
• A school safety committee was present in 64.9% of schools however, not even one fourth of the schools
had school safety guidelines. In 52.7% of the schools, the school safety committee framed by the schools
have parents as members of the committee.
• Majority of the schools (90%) didn’t have any injury-related health records.
Safety policies and programmes.
Review revealed that various policies and legislations to promote safety and prevent injuries among
children are present in India, but implementation challenges are several and exist to a very great extent.
The existing guidelines legislations/standards need strict implementation calling for strengthening
mechanisms at the local levels. These include the supreme court guidelines of safe travel to schools (1997),
safety of school children in school bus as per CBSC guidelines (2017), fire and life safety guidelines as per
national building code (2016), National Disaster Management Authority School Safety Policy Guidelines
(2016), Guidelines for School Infrastructure and Strengthening (2014), Council for Indian School Certificate
Examination (ICSE): School Safety Manual (2018), Manual on Safety and Security of Children by National
Council for Protection. of Child Rights, Rashtriya Kishor Swasthya Karyakram (2014) by Ministry of Health
and Family Welfare, POSCO act (2012), and the recently amended Motor vehicles amendment bill (2019)
and several state directives.
Child safety is the joint responsibility of governments and its various ministries/departments, industries,
schools managements, citizens and all others. Children need to be made safe in all places they are present.
Implementation of existing policies, programmes and legislations is the first step and key to reduce child
injuries in India. It’s time to act.
List of abbreviations
BBMP:      Bruhat Bengaluru Mahanagara Paalike
BMTC:      Bangalore Metropolitan Transport Corporation
BIS:       Bureau of Indian Standards
BISP:      Bangalore Injury Surveillance Project
BRISP:     Bangalore Road Injury Surveillance Project
CBSE:      Central Board of Secondary Education
CISCE:     Council for Indian School Certificate Examination
DALYs:     Disability Adjusted Life Years
ER:        Emergency room
GBD:       Global Burden of Diseases
HCFs:      Health Care Facilities
HICs:      High Income Countries
ICD:       International Classification of Diseases
ICMR:      Indian Council for Medical Research
IHME:      Institute for Health Metrics and Evaluation
IPC:       Indian Penal Code
LMICs:     Low and Middle Income Countries
MCCD:      Medical Certification of Cause of Death
MCH:       Maternal and Child Health
MDS:       Million Death Study
MHRD:      Ministry of Human Resource and Development
MOSPI:     Ministry of statistics and program implementation
MoRTH:     Ministry of Road Transport and Highways
MOU:       Memorandum Of Understanding
NBC:       National Building Code
NCDs:      Non Communicable Diseases
NCPCR:     National Council for Protecting Child Rights
NCRB:      National Crime Records Bureau
NDMA:      National Disaster Management Authority
NIMHANS:   National Institute of Mental Health and Neurosciences
POSCO:     Protection of Children from Sexual Offences
RKSK:      Rashtriya Kishor Swasthya Karyakram
RMSA:      Rashtriya Madhyamik Siksha Abhiyan
RTE:       Right to Education
RTI:       Road Traffic Injury
SCPCR:     State Commissions for the Protection of Child Rights
SOP:       Standard Operating Procedure
TBI:       Traumatic Brain Injury
UNICEF:    United Nations International Children’s Emergency Fund
WHO:       World Health Organization
List of tables
Table 1:    Changing face of India in the millennium                                         1
Table 2:    Profile of children in India (Census 2011)                                       3
Table 3:    Health and social Indicators of India (2001-2017)                                4
Table 4:    Major data sources for injury information                                        7
Table 5:    Mortality due to unintentional injuries in India                                 12
Table 6:    Outcome of Traumatic Brain Injury victims (all age groups)                       14
Table 7:    Burden of unintentional injuries among children (
List of figures
Figure 1:      Contribution of major disease groups to total death and DALYs (1990-2016)        2
Figure 2:      Probablity of dying and number of deaths (year 2018) - Global and India          4
Figure 3:      Types of injuries                                                                5
Figure 4:      Methodology                                                                      6
Figure 5:      Injuries commonly expected in different age groups                               8
Figure 6:      Factors increasing vulnerability to injuries in children                         9
Figure 7:      Deaths due to injuries in India (
Section 1: Child safety scenario
1. Introduction

1.1 India over the years
Since independence, India has made giant strides in education, health, welfare and living standards. The
population of the country is at 1.36 billion, and is estimated to rise to 1.37 billion by year 2019[1]. India
is witnessing significant changes due to globalization, industrialization and urbanization. In addition,
the macro and micro policies of successive governments have contributed further to the economic
growth of the country. In the year 2015, the number of registered industries was at 2.31 million[2] and
there are nearly 10 million registered companies as of 2019. Census 2011[3] revealed that 31.1% of the
Indian population resides in urban areas[4], a 12.5% increase from 2001[5]. This number is likely to reach
473 million by year 2021[5]. The number of vehicles tripled between 2001 and 2013, adding nearly
1,22,609,000 vehicles to our roads[6]. (Table 1)

Table 1: Changing face of India in the millenium

 SI.no                              Indicator                      2001           2011           2015           2018
 1              Population                                        1.02 bn       1.21 bn        1.31 bn         1.35 bn
 2              60 years population (%)                            6.4            8.6            8.9
 4              Males (%)$                                           52           51.5           51.9           51.4
 5              Females (%)$                                         48           48.5           48.1           48.2
 6              Sex ratio (females per 1000 males) $                933           940            935             946
 7              Overall literacy (%)**                             64.8%          73%            71%            84.11
 7.1                  • Male literacy (%)**                        75.3%         82.4%           83%            88.76
 7.2                  • Female literacy (%)**                      53.7%         65.6%           67%            79.11
 8              Urban population (%)*                               27.7         31.16           32.8           33.2
 9              Per capita income (₹)(INR)@                       23095          64316          87748         112764
 10             GDP changes (annual growth rate)                  4.15****     6.69%****       9.0%***         8.4%***
 11             Vehicles (‘000’s)                                 54991         141865         210023         230031[6]
 12             Road length (‘000 km)                              3373           4676           5472          5603[6]
 13             Mobile phone subscribers (millions)##               6.5          893.8         1001.6          1168.9

         Source
         $ - Govt of India - Census, Source: Census of India, 2001 and 2011 (4)
         *mhrd.gov.in/sites/upload_files/mhrd/.../PopulationProjection2016%20updated.pdf.(1)
         **http://www.mospi.gov.in/sites/default/files/reports_and_publication/statistical_publication/social_statistics/
         Chapter_3.pdf(9), India in Figures - 2018(8)
         **** http://planningcommission.nic.in/data/datatable/data_2312/DatabookDec2014%202.pdf(10)
         @ Economic Survey of India(7)
         ##Mobile subscribers=https://www.statista.com/statistics/498364/number-of-mobile-cellular-subscriptions-in-India/
         (11)

                                                             1
Progress in recent years have contributed to a decrease in infant mortality, maternal mortality and vaccine-
preventable diseases (Table 2 and 3). As per various demographic indicators, crude birth rate per 1,000
persons was 21.4 (2013) and dropped to 20.4 in the year 2016. Similarly, the crude death rate per 1,000
persons reduced from 7.0 to 6.4 between the years 2013 to 2016. The infant mortality rate per 1,000 live
births declined from 44 in 2011 to 34 in 2016. Similarly, the mortality rate among kids under the age of five
decreased from 49 per 1,000 live births in year 2013 to 39 in 2016[8].
1.2 Changes in mortality, morbidity and disability patterns
The socio-economic growth of the country and health reforms have also contributed towards epidemiological
transition, resulting in better control of communicable diseases as well as diseases pertaining to maternal
and child health. However, there has been a rise in non-communicable diseases and injuries resulting
from modern day lifestyles and habits. The increased exposure to behavioural lifestyle-related risk factors,
motorization and travel has resulted in a consequent increase in deaths due to non-communicable
diseases (NCDs) (37.9%% to 61.8%) and injuries (8.6 % to 11.9%). Not only has the overall number of deaths
increased, the distribution has changed significantly [13]. DALY is a measure of disease burden with factors
such as premature mortality and life lived with disability into consideration[14]. One DALY is one year worth
of healthy life lost. The higher the DALYs, the more the burden. DALYs due to NCDs and injuries has changed
from 14566966 to 10660827 and 14308155 to 7060927 respectively during 1990 to 2017[12].
Figure 1: Contribution of major disease groups to total deaths and DALYs (1990-2017)
Contribution of major disease groups to total deaths in India (1990-2017)
1990 2017
27.5%
37.9%
53.6% 61.8%
10.7%
8.5%
1990 2017
Contribution of major
Communicable, disease
maternal, groups to
neonatal total
Non DALYs (1990-2017)
- Communicable diseases
8.6%
and nutritional diseases
1990
Injuries
2017
8.6%
32.7%
60.9% 30.5% 55.4%32.7%
60.9% 30.5% 55.4%
11.9%
11.9%
Communicable, maternal, neonatal Non-communicable diseases
Communicable, maternal, neonatal
and nutritional diseases
Non-communicable diseases
Injuries
and nutritional diseases Injuries
In keeping with the rapid changes in the epidemiological profile, there is a pressing need to reorient health
care systems, health information systems, infrastructure and manpower. This step is essential not only to
minimize communicable diseases and maternal/child health problems, but also to address the current
epidemic of NCDs and injuries.
2Table 2: Profile of children in India (Census 2011)
1.3 Children are our SI no. Indicator 2011 (Census) %
greatest resources 1 Number of children (under 18 years) 44,41,53,330 39%
According to the United 0-4 11,28,06,778 25.4%
Nations Convention on the 5-9 12,69,28,126 28.6%
Rights of the Child - Article
10-14 13,27,09,212 29.9%
1, a child is defined as a
human being below the 15-17 7,17,09,214 16.1%
age of 18[15]. While other 2 Gender *
bodies such as UNICEF, Boys 23,24,68,505 52.3%
WHO and various ministries
under the Government of Girls 21,16,84,825 47.7%
India resort to different 3 Residence *
definitions, in this report Urban 12,00,78,346 27%
we have considered the Rural 32,40,74,984 73%
aforementioned definition
4 Child labour (in millions)*
as adopted by the United
Nations General Assembly 5-18 years 33 NA
on 20th November, 1989[15]. 5-14 years 10.13 NA
Families below poverty line (in
Nearly 30% of India’s 5 269.78 NA
millions)**
population is under the age
Families with access to drinking
of 15 and close to 40% is 6
water***
under 18[4]. Four out of ten
Indians are under the age Basic (at least) NA 88%
of 18[4]. According to 2011 Limited (more than 30 min) NA 4%
Census report, there were Unimproved NA 7%
nearly 444 million children Surface water NA 1%
in India (233 million males;
School enrollment ratio - Upper
211 million females). Profile 63 -
Primary (in millions)
of the children is presented 7
in Table 2. School enrollment (Secondary
20
education)[18]
Source: *Census 2011[4]
1.4 Mortality, morbidity **India in Figures [8]
and disability among ***WHO/UNICEF (2017) Progress on Drinking Water, Sanitation and
children in India Hygiene: 2017 Update and SDG baseline[17]
Health, education and development of children have improved greatly due to the changes in overall socio-
economic and health reforms in India. Between 2001 and 2017, the infant mortality rate reduced from
63 to 32 per 1,000 live births while the mortality rate of kids under five years of age also decreased across
various economic groups[19]. The decline in mortality rate was also observed among children between
the ages of five and 14. Likewise, a decrease in crude death rate among all age groups decreased from 8.4
to 7 per 1000 persons. This achievement is largely attributed to health reforms leading to better Mother
and Child healthcare (MCH), control of communicable, nutritional and vaccine-preventable diseases.
As per the United Nations Inter Agency Group[19] for child mortality estimation, 6.3 million children under
the age of 15 died globally (2017), of which 18% were from India. In India, deaths among children (0-14
years) accounted for 11.7% of all medically certified deaths (0-4 years=9.8%, 5-14 years=1.9%; MCCD-
2015)[20]. Over the years, the proportion of deaths among children due to all causes has also registered
a decline.
3Children today are increasingly influenced by social, cultural and economic influences, thanks to the
rapid proliferation of online media. While it has been widely acknowledged that several health problems
in adulthood have their roots in childhood, several risk factors like use of tobacco and alcohol, dietary
influences, greater use of vehicles and personality changes are now increasingly found in younger age
groups. The complex interplay of globalization and lifestyle changes, socioeconomic conditions and
greater exposure to unsafe products has led to increased deaths and disabilities due to injuries among
children in India. Keeping this scenario in mind, there is a need to understand the current situation of
child injuries in India to develop a comprehensive plan to address this problem systematically.
Table 3: Health and social indicators of India (2001-2017)
Sl. no. Indicator 2001 2011 2015 2016 2017
1 Infant mortality rate (per 1000 live births)* 63 44 37 34 32
2 Under five mortality rate (per 1000 live births)** 301 178 28 41 44
3 Child mortality** 5.9 4.1 2.0 1.7 3.6
4 Deaths in the age group of 5-14 years*** 3.4 2.1 1.6 1.6 1.5
5 Fertility rate (total births per woman)** 3.2 2.5 2.3 2.3 NA
Source: *http://niti.gov.in/content/infant-mortality-rate-imr-1000-live-births[19].
**Estimates generated by the UN Inter-agency Group for Child Mortality Estimation (UN IGME) in 2018[19]
Figure 2: Probability of dying and number of deaths (Year 2018) - Global and India
Probability of dying Number of deaths
Among children aged
0-5 years 39 Global
5,417,000 Global
39
(deaths per 1000 live
989,000
births)
India
india
Among children aged 7 Global
929,000 Global
6
5-14 years
(per 1000 children
1,52,000
aged 5 years)
india
India
4An injury results from a sudden exposure to physical agents such as mechanical energy, heat,
electricity, chemicals and ionizing radiation that interacts with the body in amounts, or at rates
that exceed the threshold of human tolerance[21]. In some cases (drowning, frostbite), injuries also
result from the sudden lack of essential agents such as oxygen or heat[22]. This acute exposure and
consequent human-agent-environment interaction results in organ damage when it exceeds the
physiological tolerance of the individual.
Typically, injuries are classified based on intent as: unintentional and intentional. Unintentional
injuries include road traffic injuries (RTIs), falls, burns, drowning, mechanical injuries, fall of objects
and sports injuries among others. Intentional injuries include those caused due to interpersonal
conflict, violence (domestic, youth, etc.), suicide, deliberate self harm and child maltreatment
among others. (Figure 3)
Injuries are classified as per International Classification of Diseases (ICD) under anatomical and
external codes to facilitate comparisons and deeper understanding. Injuries are also classified
based on place of occurrence (road, home, or play site injuries) and products causing injuries.
Figure 3: Types of injuries
Injury
Places of Products Anatomical
Intent occurence /Cause parts
affected
RTIs, domestic
injuries,
workspace
injuries
Intentional Unintentional
(Suicide, (RTIs, falls, burns, Motor vehicle
injuries, poisoning Head injuries,
homicide, drowning, abdominal injuries,
violence, poisoning, fire injuries
limb injuries
sexual abuse animal bites, and others
and others
and others) sports injuries)
52. Scope and objectives of the report
The purpose of this report is to present a holistic view of the current scenario with regard to unintentional
childhood injuries. It brings together data (published and unpublished) on unintentional childhood
injuries in terms of burden, determinants and impact. A focused study was carried out to examine child
safety in schools. Existing policies and programs were renewed to identify the scope, ongoing initiatives
and existing gaps. The report provides an in-depth view into the child safety scenario in India and offers a
framework to strengthen policies and programmes to reduce childhood injuries in the coming years.
The objectives of this report are to:
• Assess the current burden of unintentional injuries
• Describe distribution of unintentional child injury deaths by age, gender and residence;
• Describe distribution by cause of unintentional childhood injuries;
• Describe risk factors for major causes of unintentional injuries;
• Review intervention strategies and approaches;
• Understand ongoing mechanisms and policies for child injury prevention;
• Chart out an activity roadmap for the consideration of all stakeholders.
3. Methodology
A mixed-methods approach was employed based on a combination of primary and secondary data
sources and a brief overview of policies and programmes. Review of data sources included both published
and unpublished sources of information on child injury and different types of injuries.
Figure 4: Methodology
National reports
NCRB, GBD, MCCD
Secondary Review of
data sources literature
Research papers
148 papers
Methodology
Data - BISP, Kolar,
NIMHANS Tumkur
data sources Fatal - 694
Non-fatal - 2331
Primary
data sources
School safety 131 schools in
appraisal Bengaluru, Kolar
63.1 Review of secondary data
A scientific and in-depth understanding of the injury scenario in India is limited due to the lack of good
quality data, even though they are a major cause of deaths, hospitalization and disabilities. The data
sources for this report include a variety of reports such as Global Burden of Disease Reports, annual
reports on road accidents in India by the Ministry of Road Transport and Highways (MoRTH), accidental
deaths and suicides in India by NCRB, Medical Certification of Cause of Death (MCCD) and others (Table 4
and Annexures Table 1).
In addition, we reviewed individual national level studies (million death study), projects/reports/
programmes (for example, Bengaluru injury surveillance project) and research published by individual
researchers.
Table 4: Major data sources for injury information
Report/Study Source Strengths Limitations
Medical Covers only deaths in urban
Office of Registrar General Cumulative data from
Certification of medical institutions and not
of India urban hospitals
Cause of Death[20] uniform across the states
National Crime Record
Accidental deaths Comprehensive data
Bureau (Ministry of Home Coverage, completeness and
and suicides in of deaths and injuries
Affairs) quality of data not complete
India[23] in India
Global burden Available from multiple Cumulative data Estimates based on available
of disease data national data sources plus of deaths and injuries data and based on modelling
estimates[12] research data sources approaches
Nationally representative Population-based
Million death Reporting of events by
mortality survey of 1.1 study using verbal
study[24] people
million households autopsy methods
We undertook an extensive literature search for published research articles using select key search words
from different sources like Medline/PubMed, Google Scholar, Safety Lit, Cochrane Library, and Indmed.
Only articles and information published after the year 2000 were considered. The research was also kept
specific to India and restricted to sources published in the English language. We additionally extracted
information from websites of concerned ministries in the Government of India, WHO and UNICEF. While
studies specific to children were limited, we extracted information related to children (less than 18 years
of age) from statistical tables provided in individual research studies. Injury-related studies restricted to
adults were excluded.
• In the course of this research, we reviewed several global reports including World Report on Child Injury
Prevention (WHO, UNICEF); Global Status Report on Road Safety, 2015, 2018 (WHO); World Injury Report
(WHO) and other national reports (Global Burden of Disease - India Report (2014-2017), NCRB (2005-15),
MORTH (2008-17), MCCD (2011-15), Advancing road safety in India (2016) and others.
• In addition to 17 reports evaluated at a national level, we have reviewed and extracted data from research
reports like the Bengaluru Road Safety Project and Bengaluru Injury Surveillance Project. After collating
about 148 published research articles, a review matrix was developed to collate information from each
article. Multiple worksheets were created to contain a review matrix; one matrix for different variables
pertaining to injuries. Using information from multiple resources, this report brings together a larger
and more comprehensive understanding of the child injury situation in India for the development of
policies and programs.
73.2 Primary data sources
NIMHANS data sources:
The Department of Epidemiology at NIMHANS - a WHO Collaborating Center for Injury Prevention and
Safety Promotion has undertaken research for several activities over time. As data regarding child injuries
is limited, we extracted child-specific data from the projects conducted in Bengaluru, Kolar and Tumkur
District. The Bengaluru Injury Surveillance Project (BISP) was a collaborative activity between 25 hospitals,
the city police, the city transport department, civic administration and NGOs conducted between 2007-
2010. The programme adopted a surveillance approach to gather data between 2009 and 2013[25]. A
similar project was undertaken in Tumkur[26]. Analyses of highway crashes from hospitals and police data
sources in Kolar was conducted on road traffic injuries[27].
We extracted child-specific data (0-18 years) from the aforementioned databases and analyzed the same.
A total of 629 child injury-related fatalities from police records and 19,754 (7020 RTIs) non-fatal injuries
from hospital records were analyzed[25-27].
3.3 School safety appraisal survey in Bengaluru and Kolar
Children (5-15 years) spend a significant amount of time of their lives in schools and with increasing
school enrolments, safety in schools is a matter of concern. Hence, we conducted a safety appraisal in 131
schools across Bengaluru (urban) and Kolar district (rural). Bengaluru is home to approximately 1.3 million
children and 2,125 schools. Kolar has approximately 0.27 million children and 323 schools.
The appraisal was conducted using a safety appraisal tool and data was collected by trained investigators
using a mobile application between January-March 2019. [Details in section 2]
3.4 Policy overview
We identified all existing major policies, guidelines and ongoing programmes to address child safety in
India. Though not presented in detail, a brief overview of these is included in the report. [Section 3]
4. Injury as a public health problem among children
4.1 Children are vulnerable to injuries
Children live in a world constructed by and for adults. From infancy to adulthood, children undergo
developmental changes in physical, cognitive, psychological and social abilities that influence their
curiosity, perceptions, risk-taking behavior, judgment and actions/reactions to environmental stimuli,
thereby affecting their susceptibility to injuries[28]. Several factors listed below play a complex role in
increasing susceptibility and vulnerability of children to injuries (Figure 5).
Figure 5: Injuries commonly expected in different age groups
Child begins to roll, crawl, Schooling and socialization Child attains puberty -
walk, climb mostly within leads to more independent physical, psychological, and
house and immediate yet supervised socio-cultural changes.
surroundings. exposure/interaction with
external environment. More unsupervised
Phases Attracted to color, exploration of environment,
movement, fluids which are Exploring various but logical thinking starts to
easily accessible and to possibilities to develop a develop.
putting things in the mouth. sense of competence and
judgment. Peer pressure and social
Not able to distinguish expectations leads to
dangers. impulsive
movements/decisions.
Most Accidental poisoning,
common burns, drowning, fall
injuries most common. RTIs RTIs, falls, violence, RTIs, falls, burns, drowning,
injuries in unsupervised parental poisoning sports injuries, poisoning
conditions.
Age
0 5 10 18
8Developmental and cognitive factors
The cognitive abilities of children are lesser than that of adults as their nervous and motor functions
are still developing. Their judgment of danger and risk in their immediate environment (roads, houses,
schools) is limited, thereby making them more vulnerable to injuries.
Physical factors
A child’s body structure is smaller and softer compared to that of adults. Their smaller size and shape
makes them less visible as well. Hence, their energy absorbing capacity is limited, resulting in more
body damage by physical forces.
Socio-cultural factors
Children, owing to their age, face immense peer pressure to explore and excel. This results in risk
taking and impulsive behavior leading to an increased probability of injury occurrence. Compliance
to existing safety rules is also limited amongst children. In addition, culturally in agrarian economies
and LMICs, male children take up professional occupations at an early age, thereby increasing chances
of work-related injuries.
Figure 6: Factors increasing vulnerability to injuries in children
Social
factors
Development Environment
and cognitive factors
factors
Vulnerability Physical
High risk
to injuries factors
environnment
Compromised Lack of
parenting safe system
and supervision
Low priority
9Evolving parenting and family dynamics living near high-risk environments like water
The rise of nuclear families (with working parents) bodies, slums, railway lines, etc. are more prone to
and the gradual decline of joint family systems injuries.
have resulted in less supervision of children.
Parents also have limited priority/perception of the System-related factors Systems for injury
importance of prevention of injuries in a domestic prevention in terms of policies, programmes,
environment. guidelines, safety equipment(s), safety processes
and transportation vehicles are typically not
Environmental factors customized for children. Many countries still do
The environment in which a child lives and grows not have appropriate child protection laws or
is largely designed for adults. Design of buildings, enforcement mechanisms for child protection
roads, parks, houses, furniture, etc. are seldom and have limited institutional mechanisms and
designed keeping child safety in mind. Children infrastructure affecting their safety [21].
4.2 Understanding child injuries
Data sources are vital to understanding the burden, in India. This is characteristic of several low and
nature, determinants and characteristics. The middle-income countries around the world.
true burden and estimates of burden, mortality,
morbidity, disability and impact are dependent on Current data sources
the quality and coverage of available data sources. At the national level, limited information on
child injury deaths are available from different
Data sources for child injuries sources like the Registrar General of India (Medical
In an ideal situation, one would expect regular Certification of Cause of Death (MCCD), the
and quality data regarding determinants, injuries, National Crime Report Bureau (NCRB), Million
deaths, treatment outcomes, trauma care systems, Death Study, World Health Organization (WHO)
cost of injuries and safety performance, to be readily estimates, the Global Burden of Disease (GBD)
available in order to drive child injury policies and study and from few other independent studies.
programs. It is imperative to have quality, timely, However, these secondary sources are not specific
reliable and comprehensive data systems in order to children alone and child-specific information
to organize and implement child injury prevention within these sources is limited (Annexure Table 1).
programmes.
Currently, police records serve as a major data
In an era of evidence-based public health, source for child injury information in India.
information regarding child injury burden, types, Information compiled by the various State Crime
distribution, trends, risk factors, treatment, Records Bureau is collated at a national level and
outcomes and disabilities is essential in order to reported by the National Crime Records Bureau[23].
plan and implement injury prevention programmes. In addition, the Ministry of Road Transport and
Due to the correlation between injuries and socio- Highways provides information regarding Road
cultural environmental changes, quality data is Traffic Injuries. As injuries are medico-legal in
useful to understand associations between these nature, police records continue to be the main
determinants. This data also helps identify the source of injury-related information in India.
contribution of injuries to overall causes of deaths However, factors such as under-reporting, the
and disabilities among children. This information is lack of a robust system for data collection, and
vital for optimizing and allocating resources in an frequent changes in the documentation process
equitable manner to ensure that childhood injuries, make it difficult to extract accurate and adequate
deaths and disabilities are prevented in the most information from these reports.
cost-effective manner.
Data from hospitals (hospital-based-injury
However, a valid and reliable data source for surveillance) on the various kinds of injuries is not
childhood injuries or injury surveillance systems, available, nor standardized across the country. A
either at a state or national level, does not exist systematic notification system of the number of
10accidents, injuries and fatalities from different healthcare facilities to a higher authority is also absent. Injury surveillance and trauma registries have been attempted in select centers by individual researchers but a concerted national effort is lacking[25]. Studies such as the Global Burden of Disease reports by the IHME - USA, reports by the WHO and India-specific studies provide an estimate of child injury deaths and DALYs, causes and risks from data sources available to them. These estimates are based on statistical modeling methods. Independent research studies are few in number and have limitations in terms of sample size, case definitions, durations covered, assessment procedures, outcome measurements and interpretations and are thus, not comparable. Research evidence is sporadic and limited to parts of the country where few professionals are actively involved in child injuries. Evidence obtained from published research, though helpful for a broader understanding, cannot be used to draw finite conclusions or make extrapolations for the country. Nevertheless, they are useful sources of information in order to understand risk factors, issues of under-reporting and outcomes. Challenges in available data Figure 7: Deaths due to injuries in India (
Indian scenario                                          Table 5: Mortality due to unintentional injuries in India,
India accounted for 11.1% of all unintentional           as per available reports
injury deaths globally[12]. Nearly 7% of all
deaths in India considering all age groups are                                                         % of
                                                          Agency     Year     Age group Deaths
accounted by injuries (7,23,178 deaths due to                                                          Deaths
unintentional injuries in all ages) and nearly
                                                          NCRB       2015 0-14              15096      -
10% of these deaths (1 out of 10 deaths)
occur among children aged 0-14 years[12].
                                                          GBD        2017 0-14              72268      6.6%
Unintentional injury mortality in children
It is estimated that 50,371 children aged                 MCCD       2015 0-14              -          5.1%
0-18 years died in India due to injury causes             Source:
(natural + unintentional + intentional) in 2015           *GBD-2017: Deaths due to unintentional injuries (all
(NCRB). After adjusting for under-reporting               ages)= 723178 (children 0-14 years=72268)[12]
                                                          MCCD - 2015: Deaths due to injuries (all ages)=73828
(based on Indian observations), the number                (children 0-14 years=3721 [20]
of deaths for the year 2015 is estimated to be            **Nation within nations report, India[13]
around 60,445.

Nearly 45,636 deaths were due to unintentional injury deaths arising from causes like RTIs, burns,
poisoning, drowning, etc. As per India GBD report of year 2017, 72,268 deaths occurred in the year
2016 due to unintentional injuries[12] while the national NCRB reports (year 2015) indicate that 18,115
(including 20% under-reporting) children aged 0-14 years, died due to unintentional injuries, indicating
a four-fold under-reporting in national statistics[23]. As per the injury pyramid (30 serious injuries and 70
mild injuries for every death), it is estimated that nearly 1.81 million children suffered serious injuries
and 4.23 million children suffered from mild injuries in the year 2015. (Figure 7).

The NCRB data from 2005-15 indicates that the number of child injury deaths in India witnessed a
gradual increase between 2005 and 2013[23]. However, the following year (2014) saw a decline in these
numbers. This decline is primarily attributed to the change in classification of unintentional injuries.
Sudden death and other miscellaneous categories were clubbed as a separate group for all age brackets,
thereby, decreasing the number of unintentional injuries.

In Karnataka, nearly 2,045 children (0-14 years) died due to unintentional injuries in 2017, accounting for
11.89% of all deaths.

Proportion of deaths due to injuries
GBD reports indicate that child injury deaths (0-14 years) accounted for 6.6% of total deaths[12], while
MCCD reports indicate the same to be 2.7% of all causes of deaths in the same age group[20].
For every 100 children (0-14 years) deaths every year, 5-7 deaths are due to unintentional injuries.
Data from studies conducted by NIMHANS, based on police records (data in Bengaluru[25], Kolar[27] and
Tumkur[26]), revealed that child injury deaths (under 18 years) constituted nearly 7.86% of all injury
deaths[25-27].

                                                    12
Unintentional injury mortality rate
A large sample-population-based study[24] injury deaths, are only expected to increase due
reported an injury mortality rate of three per to an increase in macro-level determinants such
1,000 live births among children aged 0-4 years as motorization, industrialization, urbanization
and 27 per 1,000 children among those aged and globalization. With children accounting
5-14 years[24]. The study also reported that for for 39% of the population, the expected socio-
every million children aged 0-14 years, 382 died economic impact of injuries in the future years
due to unintentional injuries in the year 2017. is estimated to be significant.
These numbers and rates of unintentional
Children hospitalized for
unintentional injuries
The word ‘hospitalization’ is qualified as a care[23]. An earlier review, estimated that nearly
supervised professional environment for the two million children in India are hospitalized
treatment of moderate to severe injuries. Data every year due to unintentional injuries[28, 31]. It
on hospitalization is limited due to absence of is therefore imperative to build data systems
hospital-based surveillance systems. Hence, it is in hospitals in order to collate information on
difficult to estimate the number of injury-related hospitalization due to injuries[31]. Doing so will
hospitalizations among children. However, not only help plan healthcare systems better,
estimates based on NCRB data indicate that but also help estimate the burden on the
nearly 1,81,000 children (0-14 years) suffered caregiver and the socio-economic cost of care
from serious injuries and needed hospital for children in India.
Disability and impact
Injuries can endanger child safety in society[31]. Nearly 11% of DALYs lost among children (0-
Any form of injury/disability can lead to 14 years) in India was due to injuries[12]. In
significant physiological, psychological, social, Karnataka, 19% of DALYs among children (0-14
environmental and financial burden, thereby years) were due to unintentional injuries[30].
affecting the day-to-day routine of children as
well as their families. In a large scale population-based study of TBIs
in Bengaluru, it was observed that nearly 15% of
The extent and impact of disability is directly injured children had varying levels of disability
dependant on the age of the child and the at 24 months post discharge[32]. Studies
severity of the injury. For instance, a burn including all age groups indicate that 15% of
injury can result in disfigurement and/or a all disabilities are caused due to injuries[32].
major handicap, while a fall could result in the However, data on disabilities due to childhood
child being in a permanent vegetative state. injuries is limited. Similarly, other studies have
A brain injury can result in severe cognitive reported that 19-72% of TBI victims experience
impairments while injury to the eyes can lead disability[33].
to permanent loss of vision, as observed in case
of injuries caused by fireworks.
Injuries resulted in the loss of 6,354,369 DALYs
(6.35 million DALYs) and 72,268 deaths among
children aged 0-14 in the year 2017 in India[12].
13Table 6: Outcome of Traumatic Brain Injury victims (all age groups):
Author Place Size Outcome Data sources
Good Disability Death
recovery
Agarwal New Delhi 2,068 45% 19% 22% Neurosurgery dept. based
D. et al* retrospective data of head injury cases
(2016)[34] admitted at level 1 trauma care unit
Shekhar New Delhi 796 80% - 20% Neurosurgery dept. based
C. et al retrospective data and follow up of
(2015)[35] head injury cases
Yattoo Kashmir 547 93.6% - 6.4% Emergency dept. based prospective
G.H. et al study of head injury cases between
(2008)[36] 1996-2003
Gururaj Bengaluru 4,731 28.7% 62.1% 5.5% Neurotrauma centre ER dept. based
G. et al prospective data of all admitted head
(2005)[28] injury cases
Agarwal Maharashtra 1,926 66.5% 33.5% 6.4% Neurosurgery unit based retrospective
A. et al (Rural) study of admitted head injury cases
(2012)[34] 2007-2009
Deb Nath New Delhi 70 10% 76% 14% Neurosurgery dept. based retrospec-
H. et al tive data at JPNATC 2008-2009
(2011)[37]
*14% in vegetative state
‘Psychological impact’ refers to the psychological and social impact of an injury on a child. It also takes
into consideration factors such as caregiver burden and the overall effect of the outcomes of the injury
on the family. Stress, post-traumatic stress disorder and cognitive deficiencies are recognized outcomes
of an injury. It revolves around disability which leads to a handicap in the larger environment where the
child resides.
‘Economic impact’ refers to the direct and indirect cost of care for injuries. It is estimated to cost
approximately 5% of the GDP (3% due to RTIs)[28, 38, 39]. However, data specific to children is limited.
Cost of care assessment studies amongst individuals of all ages reveal the following:
• Studies in Bengaluru revealed that on an average the families spent Rs 2,601 (minimum to maximum
Rs 100-Rs 18,650) per injury[40]. Surveillance project in Bengaluru indicated that poor and non-poor
spent an average of 18,000 and 27,000 rupees on medical cost for every injury-related hospitalization.
Additional cost of vehicle and property damage was 10,000 to 25,000 rupees[28].
• Cost of care assessment among 95 RTI victims in an urban hospital setting in India (year 2009) indicated
medical costs accounted for 43% of costs. Average cost per person was; Surgery (Rs. 4,500), Prosthesis
(Rs. 2,450), Laboratory charges (Rs. 1,600), Medicines (Rs. 1,000)[41].
• An assessment of out-of-pocket (OOP) expenditure for medical care for injuries for patients admitted for
at least one night in a tertiary care hospital in Chandigarh indicated that the average OOP expenditure
per hospitalization and for 12 months post discharge was USD 388 (95% CI: 332-441) and USD 1,046 (95%
CI: 871-1,221) respectively. The mean OOP expenditure for RTI and non-RTI cases during hospitalization
was USD 400 (95% CI: 344–456) and USD 369 (95% CI: 313–425) respectively[39].
144.4 Age really matters Distribution of child injury deaths by age Globally, the number of unintentional injury deaths are higher among children
4.5 Male children are affected more
Multiple data sources/reports indicate that unintentional injury deaths are higher among males (48-76%)
as against females (23-51%). NCRB and MDS reports suggest that nearly 62-69% injury-related deaths in
the age group of 0-14 years occurred among males. Data from GBD, MCCD and NIMHANS varied between
40-53% for male distribution of injury deaths. Injury death rate per 100,000 lakh people is nearly three
times higher in males (26 per 100,000 people) as against females (9 per 100,000 people).

4.6 Urban-rural distribution
The urban-rural differential indicates inequalities in risk factors, greater role of injury causation factors
as well as access to quality and timely trauma care. While it is assumed that injuries would be higher
among children in urban areas as against among children in rural areas, data with regard to urban-rural
distribution is limited. Available research indicates that the child injury mortality rate per 100,000 children
is higher in rural areas, with 3.4 deaths per 100,000 in the age group of 0-4 and 27.32 deaths per 100,000
in the age group of 5-14 years, as against the death rates in urban areas - 1.7 per 100,000 [age group:
0-4 years] and 17 per 100,000 [age group: 5-14 years][24] [Figure 8]. The higher mortality in rural areas
indicates limited access to quality pre-hospital and hospital level trauma care systems as well. Moreover,
more severe cases are referred to urban areas.

Apart from injury mortality rate, distribution of deaths by place of residence revealed that 40.3% of injury-
related deaths occurred in rural areas as against 59.7% in urban areas[25-27]. This is largely due to better
documentation of severe cases in urban areas as against documentation in rural areas.

                              Figure 8: Urban-Rural distribution of injuries in children

   Urban-Rural distribution of injury deaths (%)                     Urban-Rural distribution of injury death rate
       (NIMHANS data,
Police data sources (NCRB-2015) reveal that traffic accidents (47%), drowning (19%), falls (6%) and burns
(10%) are the leading causes for unintentional injury deaths among children in the age group of 0-18
years in India (Figure 9)[23]. A study of the gender-specific distribution revealed that the proportion of burn
injuries (15%) and falls (10%) was higher among females. Every fifth child injury death in the age group of
0-18 in India is due to a traffic accident - a leading cause of child injury deaths in India[21, 23].
Figure 9: Causes of injury-related deaths by different age groups
NCRB 2015(0-14 years) NCRBMillion
- 2015 death
(15-18study,
years)2005 NIMHANS da
4% 6% 8%
12 % 11%
18%
4% 5%
Firearm 27% 25 % 37%
0%
10% 47%
6%
38 %
5% 29% 11%
19%
8% 15%
5%
0%
Workspace injury
Accidental explosion 0%
Others
Collapse of structure Unknown Falls
causes Drowning Hanging
RTIs Contacts with Others
plants/animals Traffic accident Fire injuries Drowning
Traffic accident Accidental fires Electrocution
Forces of nature Mechanical forces Fire Drowning Poisoning
Other causes Falls
Drowning Falls
years) NIMHANS data (0-18years)
NCRB 2015(0-14 years) Million death study, 2005
Assault/Violence
5% 0% 6% 8%
4%
12 % 11% 11%
4% 5%
Firearm 37% 6%
27% 25 %
0%
47%
13%
38 %
5% 29% 11%
15% 13%
8%
5%
0%
Workspace injury
Accidental explosion 0%
Falls Hanging Burns Others Collapse of structure Unknown causes Drowning
RTIs Contacts with Others
Fire injuries Drowning Falls
plants/animals
Traffic accident Accidental fires Electrocution
Forces ofPoisoning
nature RTIs
Mechanical forces Fire
Other causes Falls
Drowning Falls
Traffic accidents were the leading cause of deaths in 2005, accounting for 36% of all deaths. This number
rose to 37% in 2010 and to 38% in 2015. Similarly, the proportion of deaths caused by drowning increased
from 20.9% in 2005 to 27.6% in 2015. The proportion of deaths caused by falls nearly doubled between 2005
(4.6%) and 2015 (8.5%). The change in parameters for classification led to major variations in the numbers
through the following years. Traffic accidents were reported to be the leading cause of unintentional injury
deaths (62.1%-63.9%) among children aged 15 to 18 years, followed by drowning (15.4%-17.7%). Instances
of falls were found to reduce considerably among children above the age of five years[23].
17Evidence from population data, primarily MDS, Data from NIMHANS reiterated that transport-
revealed that RTIs constituted to 29% of injury related injuries (especially RTIs), drowning, falls
deaths followed by falls (25%) and drowning and fire-related injuries are the leading causes
(11%)[42] (Figure 9). MDS study reported that the of death, accounting for 68-79% of all injury-
proportion of falls-related deaths (25%) is three related deaths among children (based on multiple
times more than figures (8%) reported by NCRB. sources). The BISP report (2014) revealed that 37%
of causes of unintentional injury deaths were due
Similar observation was recorded by
to RTIs, followed by drowning (13%) and burns
independent research from five population-
(11%). Poisoning accounted for 6% of all injuries.
based studies[34,40,43–45] which indicated that falls
The causes of death also differed by urban-rural
accounted for 35-66% of all injury deaths, much
distribution. In rural areas, drowning and poisoning
higher than those reported in NCRB. (Annexure
were the more common causes for injuries among
Table 2). Burns accounted for 6-13% of all injury
children as against urban areas (Figure 10 and
deaths in children[28,34,40,43,44,46–49].
10.1)[25, 28].
Figure 10: Distribution of non-fatal injuries among childrenBy taking multiple data sources into consideration, it is evident that RTIs, drowning, falls, burns and
poisoning account for nearly 85% of all child injury deaths. Among younger age groups, falls, drowning,
poisoning and burns are more common and as the child grows older, falls and RTIs become more frequent.
Table 8: Causes of unintentional injury-related deaths among children (0-14 years) in India (2005-2015) - NCRB India
2005 2006 2007 2008 2009 2010 2011 2012 2013 2014 2015
Traffic
6724 7646 7771 8492 8001 7777 8340 7758 7779 5862 5416
accidents*
Falls 869 919 892 913 969 918 964 981 1004 1170 1211
Drowning 3934 4555 4335 4247 4193 4529 4794 3926 4808 4054 3921
Burns 2094 1987 1977 2017 2036 2035 2163 1969 2205 1477 1345
Poisoning and
1796 2058 2119 1986 2113 2143 2264 2660 2516 0 0
animal bites
Workplace** 31 52 43 41 71 35 72 62 42 28 16
Miscellanous 3683 3800 3968 3836 4210 3847 4061 4019 4704 2711 2469
Total 19131 21017 21105 21532 21593 21284 22658 21375 23058 15005 15096
*Traffic accidents includes RTIs and other vehicular accidents
**Workplace includes factory/mine/quarry
4.8 Most deaths happen on roads
Data regarding places of occurrence of injuries is very limited. Data from NIMHANS suggests that roads
continue to be the place where most children under the age of 18 were injured. Nearly 41% of all fatal
injuries among children were reported to have occurred on roads, followed by 31% at home. Around 11%
of fatal injuries occurred in water-related areas such as wells and lakes.
Figure 11: Place of fatal injury among children, 0-18 years (NIMHANS data)
60 (n=621)58.0
60 58.0
6% 50
4% 44.3
6% 50 45.9
4% 44.3
40
31% 40 33.4 37.2
31% 33.4
30 2
30
41% 26.4
41% 19.8
18.0
7% 20 19.8
18.0 15.6
7% 20 15.6
11%
11%
10
10
0 Injury site 0 transport Injury
During site
Hospital During transport
Home Farms Wells/LakesFarms
Home Wells/Lakes to HCF to HCF
Roads Hospitals Other areas Rural(%) Urban(%) Total(%)
Roads Hospitals Other areas Rural(%) Urban(%)
A breakdown of place of injuries by rural-urban distribution revealed that RTIs were an urban phenomenon
as far as fatal injuries are concerned. Fatal injuries due to accidents in farms and drowning were more in
rural areas. Nearly 34% and 25% of fatal injuries in rural areas occurred in homes and near water bodies.
In total, 59% of all fatal injuries happened either at home or near a water source in rural areas[25-27].
19You can also read