Exploring electronic phenotyping for clinical practice in Norwegian settings
←
→
Page content transcription
If your browser does not render page correctly, please read the page content below
Exploring electronic phenotyping for
clinical practice in Norwegian settings

Report number Summary
03-2020 Electronic phenotyping algorithms analyze big
 sets of pa�ent data to find hidden paterns and
Project manager characteris�cs for a condi�on in a group of simi-
Alexandra Makhlysheva lar pa�ents or predict risks for developing this
 condi�on. Electronic phenotyping applies struc-
Authors tured and unstructured EHR data for cohort
Alexandra Makhlysheva iden�fica�on, public health and safety surveil-
Maryam Tayefi Nasrabadi lance, healthcare administra�ve purposes, clini-
Phuong Dinh Ngo cal research, and precision medicine. This report
Taridzo Chomutare provides knowledge on electronic phenotyping,
Torbjørn Torsvik including methods for its development, chal-
 lenges for its exploita�on in Norwegian clinical
ISBN se�ngs, and describes a phenotyping algorithm
978-82-8242-099-0 for mul�morbid pa�ents built in the project.

Date Publisher
31.12.2020 Norwegian Centre for E-health Research
 P.O. Box 35
Number of pages
 N-9038 Tromsø
66
 NORWAY
 E-mail: mail@ehealthresearch.no
Keywords
 Website: www.ehealthresearch.no
Electronic phenotyping, phenotyping algorithm,
Norwegian clinical se�ngs, challenges for phe-
notyping, mul�morbidity, propensity score

You may freely copy text from this report if the source is provided. You are encouraged to provide the report's name, report number, that
it is published by the Norwegian Centre for E-health Research and that the report is available online at www.ehealthresearch.no.
© 2021 Norwegian Centre for E-health Research
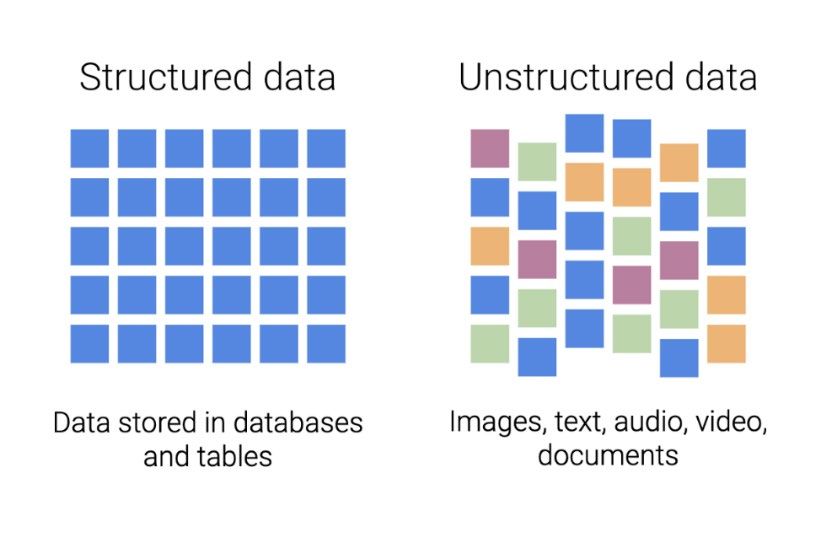
Table of contents
 Introduc�on ............................................................................................................................. 5
 Project objec�ves .................................................................................................................. 5
 Approach ............................................................................................................................... 5
 Collabora�on with other projects ......................................................................................... 7
 Acknowledgement ................................................................................................................ 8
 Organiza�on of the report .................................................................................................... 8

 Background .............................................................................................................................. 9
 What is phenotyping? ........................................................................................................... 9
 What is electronic phenotyping? ........................................................................................ 10
 Areas for phenotyping algorithms ...................................................................................... 12
 Development of an EHR-driven phenotyping algorithm .................................................... 13
 2.4.1 Electronic phenotyping algorithm pipeline ................................................................. 13
 2.4.2 Data types for electronic phenotyping ........................................................................ 14
 2.4.3 Types of data manipula�ons ........................................................................................ 17
 2.4.4 Combining mul�ple data types .................................................................................... 18
 2.4.5 Iden�fica�on of a pa�ent popula�on .......................................................................... 19
 2.4.6 Methods for electronic phenotyping ........................................................................... 21
 2.4.7 Algorithm and data type performance metrics ........................................................... 23
 2.4.8 A process for phenotype development ....................................................................... 26
 2.4.9 Choosing a phenotyping algorithm for a specific task ................................................. 27
 Example of an electronic phenotyping algorithm............................................................... 29
 Challenges for electronic phenotyping in Norway .............................................................. 32
 2.6.1 Data access and privacy issues .................................................................................... 32
 2.6.2 Data pre-processing, analysis, and model building ..................................................... 33
 2.6.3 Adop�on of phenotyping algorithms in clinical se�ngs ............................................. 34
 Stakeholder analysis............................................................................................................ 35
 2.7.1 Stakeholder mapping ................................................................................................... 35
 2.7.2 Stakeholder analysis for the project ............................................................................ 36

 Mul�morbidity use case......................................................................................................... 41
 What is mul�morbidity? ..................................................................................................... 41
 Propensity score.................................................................................................................. 41
 Machine-learning algorithms for propensity score ............................................................ 43
 Collabora�on with the PACT project ................................................................................... 43
 Propensity score matching phenotyping algorithm ............................................................ 44
 3.5.1 Data used for the algorithm......................................................................................... 44
 3.5.2 Propensity score es�ma�on using logis�c regression ................................................. 47
 3.5.3 Propensity score es�ma�on using feedforward neural networks ............................... 47
 3.5.4 Performance of the algorithms .................................................................................... 48

 Project results ........................................................................................................................ 50
Paper “Risk Averse Food Recommenda�on System using Machine Learning for Pa�ents
 with Type 1 Diabetes during Physical Ac�vi�es” ........................................................................... 50
 Paper “Improving Treatment and Care for People with Mul�morbidity Using Machine
 Learning and Sta�s�cal Methods: A Systema�c Review”.............................................................. 50
 Applica�on for health research funding by Northern Norway Regional Health Authority 51
 Horizon 2020 applica�on .................................................................................................... 51
 Project “ClinCode - Computer-Assisted Clinical ICD-10 Coding for improving efficiency and
 quality in healthcare” .................................................................................................................... 51
 Fact sheet about basics of electronic phenotyping ............................................................ 52
 Phenotyping algorithm for mul�morbid pa�ents ............................................................... 52

 Summary ............................................................................................................................... 53

 References ............................................................................................................................. 55

 Appendices ............................................................................................................................ 61
 Appendix A .......................................................................................................................... 62
 Appendix B .......................................................................................................................... 63

List of figures
Figure 1. Phenotype as a combina�on of physical characteris�cs .......................................................... 9
Figure 2. Phenotype as an integra�on of genotype and environmental influences ............................. 10
Figure 3. Examples of an individual’s phenotypes ................................................................................. 10
Figure 4. Structured vs unstructured data............................................................................................. 11
Figure 5. Electronic phenotyping algorithm at a glance ........................................................................ 12
Figure 6. Confusion matrix for visualiza�on of the performance of an algorithm/ data type .............. 24
Figure 7. Algorithms 1) with low sensi�vity and high specificity and 2) with low specificity and high
sensi�vity ............................................................................................................................................... 25
Figure 8. Development of phenotyping algorithm ................................................................................ 27
Figure 9. ROC plot .................................................................................................................................. 28
Figure 10. Algorithm to iden�fy pa�ents with diabe�c re�nopathy ..................................................... 30
Figure 11. Template for stakeholder matrix .......................................................................................... 36
Figure 12. Stakeholder analysis matrix for the project.......................................................................... 40
Figure 13. Data pipeline for matching algorithms ................................................................................. 45

List of tables
Table 1. Applica�ons of electronic phenotyping across study types ..................................................... 12
Table 2. ICD-9 codes relevant for diabe�c re�nopathy or diabe�c macular edema ............................. 31
Table 3. List of Norwegian stakeholders for the project categorized by the use case........................... 38
Table 4. Results of the matching algorithms ......................................................................................... 48
Table 5. Balance results between control and interven�on groups ...................................................... 49
5

 Introduc�on
Data in Electronic Health Record (EHR) systems represent a limited view of a pa�ent’s condi�on and
are o�en incomplete and biased. However, they provide enough informa�on for construc�ng a clini-
cally relevant set of observable characteris�cs of a disease or a condi�on, called an electronic pheno-
type. Electronic phenotyping uses a combina�on of clinical notes, diagnosis codes based on Interna-
�onal Classifica�on of Diseases (ICD 1), medica�on lists, and laboratory tests. It enables direct iden�fi-
ca�on of cohorts of pa�ents based on popula�on characteris�cs, risk factors, and complica�ons
demonstrated in similar popula�ons. This informa�on can be used, among other uses, to conduct
clinical trials and compara�ve treatment effec�veness research. The cohort iden�fica�on process can
be integrated with the EHR for real-�me clinical decision support. Electronic phenotyping corre-
sponds to secondary use of EHR data. Machine-learning approaches, along with Natural Language
Processing (NLP) methods, are key to electronic phenotyping.

 Project objec�ves
The project “Exploring electronic phenotyping in Norwegian clinical se�ngs” aims to provide
knowledge on electronic phenotyping, including technologies and methods for its development, as
well as iden�fy clinical relevance of phenotyping and challenges in Norwegian clinical se�ngs.
Project ac�vi�es included 1) knowledge gaining on electronic phenotyping through par�cipa�on in
conferences and research visits/ mee�ngs with ins�tu�ons working on this topic, 2) iden�fica�on of
clinical needs/ use cases for electronic phenotyping at the na�onal level, 3) iden�fica�on of data
types required for phenotyping of the selected clinical needs, 4) check for data availability and acces-
sibility, and 5) development of phenotyping algorithms for the chosen clinical use case(s).
In general, clinicians and pa�ents can get the biggest benefits from phenotyping projects as they get
insights for improving treatment and pa�ent safety, as well as providing decision support and improv-
ing clinical workflows. Moreover, this knowledge can be valuable for EHR vendors and Helsepla�or-
men, providing prerequisites and requirements for further development and improvement of na-
�onal EHR systems to support phenotyping for clinical decision making and healthcare personnel
workflow. It can be also useful for the Directorate for E-health and the Ministry of Health and Social
Welfare, as it can contribute to public health and disease surveillance by iden�fying risk groups for
diseases and condi�ons on a na�onal level.

 Approach
The project was composed of a theoretical part and a practical part. The practical part aimed to 1)
identify the use cases in Norway for phenotyping, together with the data sources required for

1The most recent version of Interna�onal Sta�s�cal Classifica�on of Diseases and Related Health Problems, 10th Revision
htps://icd.who.int/browse10/2019/en
6

building phenotyping algorithms for these use cases, 2) figure out availability and accessibility of
those data sources within the project time frame, and finally 3) develop phenotyping algorithms. But
before starting with the practical part, we had to gain our knowledge about the phenotyping topic.
We raised our competence in phenotyping via 1) literature review of the state-of-the art in the field
and 2) participation in different types of scientific events to understand the status and trends in phe-
notyping, as well as technologies used for it. More detailed these activities included:
 • phenotyping-related literature search for identifying the state-of-the-art in the field; this
 ended up in a mind map describing definitions, used methods, areas of application (including
 beneficiaries), use cases, and available databases with ready phenotypes (see Appendix A)
 • seminars with the machine learning group from UiT The Arctic University of Norway to dis-
 cuss the common challenges of working with health data in Norway and development of ma-
 chine-learning algorithms
 • meetings with the Quality and Development center (KVALUT) of University Hospital North
 Norway (UNN) about the registration of ICD codes use case as a need from clinicians and ad-
 ministrative personnel/ auditors
 • a meeting with DIPS (EHR vendor) about potential use cases, EHR data access requirements,
 and possible collaboration for EHR-based phenotyping
 • participation in AMIA 2019 Annual Symposium, 16.11-20.11.2019 in Washington, D.C. (USA)
 (https://www.amia.org/amia2019), and AMIA 2020 Virtual Annual Symposium, 14.11-
 18.11.2020 (https://www.amia.org/amia2020); a summary from AMIA 2019 Annual Sympo-
 sium written by the project participants is available at https://ehealthresearch.no/files/docu-
 ments/Rapporter/Andre/Kortrapport-2020-01-AMIA-2019-Symposium.pdf
 • participation in the EHiN conference 12.11-13.11.2019 in Oslo (https://ehin2019.wpen-
 gine.com/). A paper titled “Food recommendation using machine learning for physical activi-
 ties in patients with type 1 diabetes” was presented at the conference
 • participation in the EHTEL symposium 2019, 3.12-4.12.2019 in Barcelona (Spain)
 (https://www.ehtel.eu/activities/annual-ehtel-symposium/annual-symposium2019.html),
 where we presented our Center with the lecture entitled “Machine Learning, Health Analyt-
 ics and Artificial Intelligence (AI) in Healthcare: Lessons from Norway” with an introduction
 to the “Electronic phenotyping for clinical needs in Norway” project. The symposium pro-
 vided insights about the collection and use of health data, use of AI and machine learning in
 the healthcare sector in Europe, and demonstrated innovations in health from several Euro-
 pean countries; there we also got in touch with several European research institutions as po-
 tential partners for Horizon Europe application
 • participation in the International Conference on Advanced Technologies and Treatments of
 Diabetes (ATTD) 2020 19.02 - 22.02.2020 in Madrid (Spain) (https://attd2020.kenes.com/).
 An abstract titled “Toward A Personalized Decision Support System for Blood Glucose Man-
 agement During and After Physical Activities in Patients with Type 1 Diabetes” was presented
 • participation in the conference on Artificial Intelligence in Healthcare 2019, 18.06-19.06.2019
 in Bodø (https://helse-nord.no/arrangementer/kunstig-intelligens-i-helsetjenesten-2019-06-
 18), which was organized by the Health North Trust together with the Health data and ana-
 lytics department of the Norwegian Centre for E-health Research (NSE)
7

 • completing a human subjects training course, “Data or Specimens Only Research” by Massa-
 chusetts Institute of Technology for getting access to the MIMIC-III database, to get practical
 training working on EHR data (https://mimic.physionet.org/gettingstarted/overview/). We
 created a shared instance of the MIMIC-III database running at the center’s server. The data
 were quite excessive and contained several hundreds of variables relevant for patients’ stay
 at ICUs. However, work with the data was time-consuming, required involvement of clini-
 cians with the domain knowledge and was not relevant enough for our future study, there-
 fore, we decided to skip this
 • taking the online course about computational phenotyping named “Identifying Patient Popu-
 lations” offered by University of Colorado on the online platform coursera.org
 (https://www.coursera.org/learn/computational-phenotyping).
It was planned to form an interna�onal project for electronic phenotyping through wri�ng a Horizon
Europe applica�on. To know more about Horizon 2020 and Horizon Europe, we par�cipated in Euro-
pean Research and Innova�on Days in 2019 and in 2020 (24.09-26.09.2019 in Brussels, htps://ec.eu-
ropa.eu/info/research-and-innova�on/events/upcomingevents/european-research-and-innova�on-
days_en, and on 22.09-24.09.2020 online, htps://ec.europa.eu/easme/en/european-research-and-
innova�on-days-2020). These provided us lessons about processes in the Horizon 2020 and Horizon
Europe applica�ons. We also took several courses organized by the Norwegian research council (NFR)
in prepara�on for Horizon Europe:
 • Horizon Europe: Focus on EU’s research and innova�on ini�a�ves (15.01.2020, Bodø)
 • Horizon 2020: Proposal Wri�ng - Focus Impact (15.01-16.01.2020, Bodø)
 • Horizon 2020: Project Management and Finance (18.01-19.02.2020, Tromsø)
 • Horizon Europe: A prac�cal insight (15.05.2020, webinar)
 • Norwegian launch of Horizon Europe (26.10.2020, webinar)
 • Missions in Norwegian – Norwegian Research Council conference on knowledge base for re-
 search and innova�on poli�cs 2020 (25.11.2020, webinar).
We profiled our research project by having individual mee�ngs with policymakers in the EU. We also
gave input for future announcements, among others for the Horizon Europe future announcement in
“Tomorrow’s technologies for today’s health”.

 Collabora�on with other projects
The project had collabora�ons with several projects.
We collaborated with the “NorKlinTekst: Natural language processing to extract knowledge from clini-
cal notes in electronic health records” project. That was an incubator project anchored in the Health
Data and Analy�cs Department at NSE. The project’s overall goal was to build knowledge and re-
sources for analyzing clinical notes. The project was focused on professional development and educa-
�on of relevant employees in the department. The project had access to the gastrointes�nal surgery
dataset (GastroKir) from the Gastrosurgical Department at University Hospital of North Norway. All
the par�cipants of the Phenotyping project went through the Informa�on Security course to get ac-
cess to the data. The applica�on about the extension of the par�cipants list was sent to the privacy
8

ombudsman at UNN, and the access was granted. Unfortunately, the dataset was not de-iden�fied
and we could not access it.
We got a collabora�on with the “LEAF - Diabetes Use Case” project led by UiT The Arc�c University of
Norway. The project goal was to provide pa�ents and healthcare professionals a safe and risk-averse
recommenda�on/decision support tool using machine learning to develop a model for treatment and
interven�on effects. This use case can be also considered as phenotyping. All results from the project
are equally owned by the project partners.
We also collaborated with the Pa�ent-Centered Team (PACT) project. In that project, the PACT team
collaborates with the pa�ent to develop and deliver a person-centered, integrated, and proac�ve
mul�morbidity care plan. The objec�ves of the project are:
 • Define the main risk factors of the PACT popula�on (mul�morbid pa�ents referred to PACT)
 • Improve the “gold standard” of who may benefit from referral to the PACT interven�on
 • Develop an algorithm that iden�fies pa�ents for PACT interven�on
 • Evaluate the performance of the developed algorithm with regards to correct iden�fica�on of
 pa�ents referred to PACT in historical data
Mul�morbid pa�ents and their “impac�bility” to the PACT interven�on (i.e., the degree to which
they can benefit from the interven�on) was chosen as a use case for development of an electronic
phenotyping algorithm in the current project. More details about this collabora�on are coming in the
Chapter 3 Mul�morbidity use case.

 Acknowledgement
We would like to thank the project par�cipants who have contributed to the project on different
stages but have not worked with the report-wri�ng: Alain Giordanengo, Gro Rosvold Berntsen, Fred
Godtliebsen, Andrius Budrionis, Laura Slaughter, and Anne Torill Nordsleta. Our common contribu-
�on allowed the project to make that much progress.

 Organiza�on of the report
The report is organized as follows. In Chapter 2, we give the background knowledge about electronic
phenotyping and development of electronic phenotyping algorithms: what kinds of methods, data
types that can be exploited, how to assess the algorithm performance and how to choose an appro-
priate algorithm for a specific task. We also talk about challenges for electronic phenotyping in Nor-
way and provide stakeholder analysis performed for the project. In the Chapter 3, we elaborate on
project collabora�ons, explain the choice of the use case for development of electronic phenotyping
algorithm in the scope of the project, and demonstrate the built algorithm. Chapter 4 provides an
overview of the scien�fic results of the project. The chapter is followed by the Summary, the Refer-
ences, and two appendices.
9

 Background
 What is phenotyping?
An individual’s observable physical characteristics, including the one’s appearance, development,
and behavior, in biology are called phenotype (18) (Figure 1).

 Figure 1. Phenotype as a combination of physical characteristics

The person’s phenotype is a result of the interac�on of one’s genotype (the set of genes the organism
carries) and environmental influences upon the genotype (18) (Figure 2). Each organism experiences
unique environmental influences as it develops; therefore, even individuals with iden�cal genotypes
(for example, twins) develop different phenotypes (18).
10

 Figure 2. Phenotype as an integration of genotype and environmental influences

Examples of phenotypes include an individual’s height, eye, and hair color, as well as characteris�cs
that can be measured in the laboratory (such as levels of hormones or blood cells). See examples of
phenotypes characterizing an individual in Figure 3.

 Figure 3. Examples of an individual’s phenotypes

 What is electronic phenotyping?
Electronic phenotyping is the characterization of an individual’s condition based on electronic
data. Electronic health record systems and any other machine-readable data are used for electronic
phenotyping. These data can include genomic data, diagnostic (medical) images,
11

structured and unstructured clinical data registered in the EHR, patient-generated data, and environ-
mental data (air and water quality, heavy metals concentration in soils, etc.).
Data that fit into predefined fields are called structured data. They are often organized by rows and
columns, as in a spreadsheet. ICD diagnosis codes, laboratory results and medications registered in
EHR, in addition to genomic data (which is usually stored separately due to the data size restrictions),
are examples of structured data.
Data that are complex, heterogeneous and cannot fit into standard fields are unstructured data. Un-
structured data may be in the form of text or bitmap objects such as image, video, or audio files. Ma-
chine-learning technologies can analyze unstructured data. Unstructured data used for electronic
phenotyping are represented by patient’s signs and symptoms in the form of doctor’s notes, radiol-
ogy and pathology reports, discharge summaries, and family history registered in the EHR, together
with diagnostic images usually stored in a separate system.
Structured and unstructured data are complimentary data sources. See visualization of structured
and unstructured data in Figure 4 (19).

 Figure 4. Structured vs unstructured data

Electronic phenotyping algorithms analyze big sets of patient data and find hidden patterns and spe-
cific features to characterize a condition in a group of similar patients or predict risks for developing
this condition (Figure 5). This gives insights about the condition development and its potential treat-
ment. The more data on an individual’s exposures and outcomes are available for analysis, the more
complete electronic phenotype will be. Combining phenotype data with genotype data can charac-
terize patients very precisely.
12

 Figure 5. Electronic phenotyping algorithm at a glance

However, there is no common standardized and structured format for storing phenotyping algo-
rithms.

 Areas for phenotyping algorithms
Electronic phenotyping can be applied for multiple purposes. Banda et al. summed up a range of
electronic phenotyping applications (39) (see Table 1).

 Table 1. Applications of electronic phenotyping across study types

 Study type Use cases
 Epidemiological research
 Hospital administra�on/resource alloca�on
 Cross-sec�onal
 Adherence to diagnos�c/treatment guidelines
 Quality measurement
 Genome-wide associa�on studies
 Pharmacovigilance
 Associa�on (case-
 Iden�fying clinical risk factors and protec�ve factors
 control/cohort)
 Clinical decision support
 Clinical effec�veness research
13

 Predic�ve modeling
 Clinical trial recruitment
 Experimental Pragma�c trials
 Adap�ve/randomized, embedded, mul�factorial, adap�ve pla�orm trials
Despite the variety of use cases, identifying phenotypes is a significant informatics challenge because
EHR data is often fragmented, irregularly distributed over time, with variable accuracy, and continu-
ously changing (78).

 Development of an EHR-driven phenotyping algorithm
 Electronic phenotyping algorithm pipeline
Phenotype deriving is an iterative complex process that benefits from multiple data sources (64) and
requires often up to 6-8 months of development (65).
An electronic phenotyping algorithm pipeline is composed of four phases: 1) data preparation, 2) di-
mensionality reduction, 3) phenotype discovery, and 4) evaluation.
Data preparation is a process of gathering, combining, structuring, and organizing data to make them
ready for analysis (69). Often data have missing values, inaccuracies, and errors. Moreover, datasets
from different sources or institutions may have different formats which needs to be reconciled. Data
preparation makes data accurate, consistent, and having sufficient quality levels to produce reliable
results. This process includes several steps (69):
 • Data collection when data relevant for a certain task are gathered.
 • Data discovery and profiling implies data exploration for better understanding of what data
 look like and what needs to be done with them before analysis. Data profiling identifies in-
 consistencies, anomalies, missing data, and other issues to be addressed.
 • Data cleaning means correcting of all the identified on the previous step issues to create
 complete and accurate datasets.
 • Data structuring includes structuring, modelling, and organization of the data into a unified
 format required for further analysis.
 • Data transformation and enrichment update data with new information to make them more
 accurate.
 • Data validation and publishing means validation of data consistency, completeness, and ac-
 curacy, and making data available for analysis.
Dimensionality reduction means reducing the number of variables (features) in a dataset while ensur-
ing that important informa�on is preserved (70). When the number of features increases, the model
becomes more complex. In addition, a model trained on many features becomes more dependent on
the data it was trained on and, in turn, overfitted, i.e., the model describes the noise in the data rather
than the pattern (71).
14

Dimensionality reduction could be done by feature selection and feature engineering methods. Fea-
ture selection is the process of identifying and selecting features relevant for analysis (71). Feature en-
gineering is generating new features from existing features by performing some transformations (71).
For dimensionality reduction, the following machine-learning methods are commonly used:
 • Principal Component Analysis rotates and projects data along the direc�on of increasing vari-
 ance; the features with the maximum variance are the principal components (71).
 • Factor analysis expresses the values of observed data as func�ons of a certain number of
 possible causes to iden�fy which are the most important (71).
 • Autoencoders are ar�ficial neural networks that compress the input into a latent space repre-
 senta�on, and then reconstructs the output from this representa�on (71). The latent space is
 a representa�on of compressed data in which similar data points are closer together in
 space, which is used to find simpler representa�ons of data (72).
Dimensionality reduction decreases computa�on �me and helps remove redundant features, if any.
However, it may lead to some data loss.
In phenotype discovery, we iden�fy the candidate phenotype paterns. For this, we define the data
types and the method(s) to use, which depends on the chosen data types and the task. Then we start
the phenotype algorithm development. This all is described further in Data types for electronic phe-
notyping, Types of data manipula�ons, Combining mul�ple data types, and Methods for electronic
phenotyping.
Phenotype valida�on involves use of a gold standard and domain experts. Further, a phenotype algo-
rithm performance can be evaluated by calcula�ng the performance metrics and an appropriate algo-
rithm for a certain task can be chosen based on algorithm accuracy, complexity, and portability. Read
Iden�fica�on of a pa�ent popula�on, Algorithm and data type performance metrics, and Choosing
a phenotyping algorithm for a specific task for more details.
There are some complica�ons for phenotyping algorithm valida�on. First, clinical data are temporal.
It implies changes in diagnosis, new entrances for the past visits, upcoming lab results within a sepa-
rate pa�ent EHR. The guidelines and pa�ent careflows can change, as well as new therapies, espe-
cially it concerns new medicines and medical devices, can appear. Second, changes in nomenclatures
and taxonomies can happen. Examples are transi�ons between ICD-9, ICD-10, and ICD-11 diagnosis
codes, as well as modeling inconsistencies in SNOWMED CT (73). And finally, the quality of unstruc-
tured data is variable. Especially it concerns EHR notes: around 20% of EHRs contain errors, 40% of
which can be considered as serious: mistakes in diagnoses, medical history, medicines, physical exam-
ina�on, lab test results, and notes on the wrong pa�ent (74).

 Data types for electronic phenotyping
Phenotyping algorithms typically use multiple data types in a single algorithm to improve the perfor-
mance and get a more complete phenotype. However, each data type has different strengths and
limitations (36).
 • Billing data
Billing data - International Classification of Disease codes (ICD diagnosis codes) and Current Proce-
dural Terminology codes (CPT procedure codes) – are very often used in phenotyping. Such codes are
15

assigned for each healthcare encounter, i.e., each interaction between a patient and a healthcare
provider for assessing the health status of a patient or providing healthcare services (68).
Billing codes are very valuable for phenotyping algorithms but have variable quality and performance.
Procedure codes describe what has been done in the encounter, while diagnosis codes provide the
reason for the procedure. CPT procedure codes are mostly used in the USA while ICD codes are
spread worldwide. In Norway, instead of CPT codes, hospitals use diagnosis-related groups (DRG)
codes. DRG codes are a pa�ent classifica�on system where hospital stays or outpa�ent consulta�ons
in soma�c ins�tu�ons are classified into groups that are medically meaningful and resource-wise al-
most homogeneous. Pa�ents placed in the same group are medically similar to each other and use
approximately the same amount of resources. Therefore, with DRG codes, it possible to compare hos-
pitals, even if they treat completely different pa�ents. DRG provides both medical and financial infor-
ma�on and is o�en used as a basis for ac�vity-based financing of hospitals as it considers all hospital
costs, including medical service and administra�on (75).
ICD codes are the most common data type used for phenotyping since they are easy to access, have a
structured format, and are straigh�orward to analyze. However, they are not always very accurate.
For example, ICD codes for diabetes: they iden�fy most of diabe�c pa�ents but are o�en used re-
gardless of the diabetes type the pa�ent has. Other codes like tobacco use are registered only for
people who use tobacco, but only some pa�ents of those who use tobacco have this ICD code in their
EHR. Further, a pa�ent’s diagnosis can change over �me: a clinician will first set the code for the sus-
pected diagnosis which then can be revised.
Another issue with ICD codes is that they may be entered by mistake. Usually, clinicians remember a
few codes most frequently been used for their pa�ents. Despite nowadays it is possible to search in
the list of ICD codes, an incorrect code can appear because of a wrong click or an autocomplete. A
wrong diagnosis code may be also entered on purpose: there are some tests and procedures that are
only allowed for certain diagnoses or since billing codes are used for reimbursement, healthcare pro-
viders may record a wrong code to jus�fy unnecessary procedure, so insurance covers it.
Outpa�ent visits have only four codes, and only the primary reason for the visit may be recorded.
Therefore, pa�ents with several health condi�ons not necessarily have all their condi�ons registered
in EHR.
Accuracy of inpa�ent diagnosis codes is also affected by professional billers/ code checkers. They
know which codes get the highest reimbursement and may choose those codes instead of the ones
most accurately describing diagnosis. The codes are not necessarily wrong since they must be sup-
ported by the medical documenta�on but may differ from the ones in outpa�ent encounters.
Procedure codes are very accurate. Broad codes like outpa�ent visits are not very useful, but of the
codes for specific procedures that are only used to treat a certain condi�on can be successfully ex-
ploited to iden�fy pa�ent popula�on. For example, if a pa�ent has a code for appendectomy, he/ she
almost certainly has had an appendici�s. However, procedure codes only apply to pa�ents who re-
ceived the procedure at the healthcare system and, therefore, are not very sensi�ve. Moreover, pro-
cedure codes may be assigned by a third-party billing service for the clinician, and then EHR never
gets a record of these codes.
16

 • Laboratory data
Laboratory tests are o�en used for phenotyping. Many clinical diagnoses are based on lab tests val-
ues as criteria. For example, to diagnose a pa�ent with diabetes, a certain level of HbA1c is required.
Usually lab data are accurate, however, incorrect values may occur. In addi�on, the same lab value
may be present in mul�ple test results. Depending on how the lab data are stored, it may be difficult
to iden�fy and combine all similar test values. Moreover, a phenotyping algorithm looks at the data
over a certain �me in the en�re EHR system, and tes�ng methods and reference ranges could be
changed over that �me. Therefore, it may be difficult to compare the same lab test over different
years. Similarly, the measurement units for the test may change or may not even be recorded. In the
context of phenotyping, lab data is typically a very specific but not always a very sensi�ve data type.
For example, those pa�ents who have already been diagnosed with diabetes may not have lab meas-
urements of HbA1c in their EHR. Therefore, to make these data usable for phenotyping, complex pro-
gramming rules considering the �me and the type of the lab test must be developed.
Another issue with laboratory data is iden�fying controls for the phenotype of interest. For example,
to iden�fy controls for the diabetes study, the algorithm should check if controls have a normal blood
glucose level value or a normal HbA1c to prove that they are not diabe�c. However, in medicine, tests
are ordered only if a clinician suspects a disease at a pa�ent. Those who are tested for diabetes likely
have some risk factors or symptoms that have made the clinician consider that they might be dia-
be�c. And even if the test does not confirm diabetes, these pa�ents are more likely to develop it and
likely not to be good controls.
 • Clinical observa�ons
Clinical observa�ons are valuable for phenotyping but o�en quite complex. They may also be used as
a part of diagnos�c criteria for a disease. For example, hypertension is diagnosed when blood pres-
sure is rou�nely over a certain value.
Issues connected to clinical observa�ons are numerous. The way blood pressure is stored in the EHR
may change over �me, leading to different variables that contain the same type of data. There are
also several types of blood pressure measurements. While blood pressure is typically taken on the
upper arm, the lower leg can be also used for blood pressure measurement if necessary, in addi�on
to varia�ons of posi�ons in which it can be taken, like when a pa�ent is si�ng, lying down, or stand-
ing. More complex tests can even assess arterial blood pressure in various arteries of the body. Figur-
ing all this out can be �me-consuming. Clinical observa�ons are mostly recorded by hand and, there-
fore, may contain typos. Mul�ple measurement units may also become an issue for many clinical ob-
serva�ons. For example, height may be recorded in meters and cen�meters or cen�meters only, or
feet and inches or inches only. Moreover, automa�c conversions of measurement units with version-
ing of EHR systems and clinical data warehouses may lead to errors, which can be harder to iden�fy
when the values are possible but unlikely. Therefore, clinical observa�ons usually require data clean-
ing before they can be used in phenotyping algorithms.
17

 • Medica�ons
Medica�ons are also a commonly used data type in phenotyping algorithms. Unlike ICD diagnosis
codes and lab tests, which are available from the ini�al diagnosis of a disease, medica�ons do not
have such an indicator. Some pa�ents are diagnosed many years before receiving care.
The first problem with using medica�ons for phenotyping is that medica�ons may be used to treat
many different disorders. The reason a pa�ent is taking a medica�on is called an “indica�on”. Some
medica�ons only have a single indica�on, like insulin is used for diabetes treatment. Other medica-
�ons may only have a single approved use but be unofficially used to treat other condi�ons. In some
cases, these unofficial uses of the medica�on may be more common than the original approved indi-
ca�on. Therefore, in phenotyping medica�ons should only be used in combina�on with other data
types.
Using the presence of a medica�on for a phenotyping algorithm is rela�vely easy. Most prescrip�ons
are available as structured data. However, if the algorithm requires specific dosages of a therapy, it
may become more difficult. For those therapies where the medica�on dose is available in a struc-
tured format in the original prescrip�on, this may work. However, some drugs, like a blood thinner
warfarin, have very complicated dosing schedules when the dose must be adjusted over the �me de-
pending how well pa�ent’s blood clots. In these cases, medica�on doses are typically stored in clini-
cal notes, and finding and interpre�ng these dosing instruc�ons is complex and may require natural
language processing.
It can also be difficult to find out when a pa�ent stopped taking the medica�on. Presence of notes
about the prescribed medica�on can be enough in cases when the algorithm determines if the pa-
�ent has ever had a disease. However, to iden�fy the medica�on side effects, it should be confirmed
that the side effect occurred while the pa�ent was s�ll taking the medica�on.

 Types of data manipula�ons
Pa�ents o�en visit the same healthcare provider many �mes during their life and have their health
data collected in the EHR over �me. This means that there may be mul�ple occurrences or measure-
ments of the same data element within a single EHR. To handle repeated measurements, there are
three primary types of data manipula�ons (36): 1) frequency, when we count how many �mes a data
element occurs in the EHR, 2) temporal manipulations, which consider the �ming of a data element,
and 3) value manipulations involving mathema�cal calcula�ons on measurement values.
 • Frequency
When a pa�ent has a chronic condi�on, he/ she gets the same billing code, lab test or medica�on
recorded mul�ple �mes in the EHR. Then the algorithm can calculate how many �mes a par�cular
data element has occurred, i.e., analyze its frequency.
There are three types of frequency manipula�ons. It can be a raw count of a data element occur-
rences in the EHR (for example, how many �mes a pa�ent has goten a par�cular ICD code). However,
this can be biased for those pa�ents who have a more severe disease or a chronic condi�on. In such
cases, we can use weighted frequency. It counts the number of �mes an ICD code occurs in the EHR
and divides this by the total number of ICD codes or total number of encounters the pa�ent has had.
The factor we choose to weight by affects the interpreta�on of the manipula�on. Weigh�ng by the
18

total number of ICD codes in the pa�ent’s EHR assesses complexity of the pa�ent’s medical state.
Weigh�ng by the number of visits reflects the total amount of care the pa�ent has received in the
healthcare system.
One more frequency manipula�on is frequency thresholding. With this manipula�on, a data element
is required to be present at least a certain number of �mes. This can be used to determine the pres-
ence of a disease. By requiring some minimum number of the billing code in the pa�ent’s EHR, we
reduce the likelihood of a false posi�ve caused by an error or the diagnos�c process.
Frequency manipula�ons are mostly applied to ICD codes, but could be applied for any data type
available in the EHR. They can be used, for example, to assess whether the pa�ent is rou�nely taking
a medica�on as prescribed.
 • Temporal manipula�ons
A phenotyping algorithm can also consider the �ming of the data element, i.e., when the data ele-
ment occurred in the EHR. If there are several lab test measurements or clinical observa�ons in the
pa�ent’s EHR, it can be difficult to determine which measurement is the most meaningful as we only
select a single instance from the whole record. We could use the first or the last value occurred in the
EHR or we might consider the �ming of the event in rela�on to some other data element. For exam-
ple, when analyzing medica�on side effects, the first lab test value a�er the first prescrip�on for that
medica�on is usually taken. Temporal selec�on of diagnosis codes is typically only used for more
complex phenotypes where we are looking for a defined sequence of medical events.
 • Value manipula�ons
In the case of mul�ple measurements meaningful for the algorithm, value manipula�ons should be
applied. There are several value manipula�ons. First, there are tradi�onal mathema�cal manipula-
�ons: we can take the minimum or maximum value or calculate the mean of the values. However,
mean is easily bias by very extreme values, and calcula�on of the median measurement can used in-
stead. There are also threshold value manipula�ons. In this case, the algorithm checks if measure-
ment values are over or under a certain value or outside a reference range.
All three types of manipula�ons can be combined. For example, for medica�on side effects, we can
combine both temporal and threshold value manipula�ons by taking a lab measurement over a cer-
tain threshold that occurs a�er a certain �me a�er the first medica�on prescrip�on. It should be no-
�ced that despite diagnosis and procedure codes are numeric, value manipula�ons cannot be applied
to them since they are categorical assignments.

 Combining mul�ple data types
In phenotyping, most algorithms use mul�ple data types. Each data type has different levels of sensi-
�vity and specificity and combining several data types can provide beter performing algorithms. We
can combine data types by Boolean logic operators (OR, AND, and NOT) (36).
Let assume that we have pa�ents who all have ICD-10 code E11.9 (the code for type 2 diabetes) and
pa�ents who all have a medica�on record for a me�ormin that is commonly used to treat diabetes, in
their EHRs. Some pa�ents have both the ICD-10 code and take me�ormin. Some pa�ents have the
19

ICD-10 code but are not on me�ormin. There are also pa�ents who take me�ormin for other than
diabetes clinical indica�ons and, therefore, do not have the diabetes ICD-10 code in the EHR.
The OR operator will give us anyone who has either the ICD-10 code or a record about me�ormin or
both the code and the medica�on (77). The AND operator only takes those who have both the code
and me�ormin (77). With the NOT operator, we will get the pa�ents having the ICD-10 code but not
taking me�ormin (77).
More complex combina�ons can be performed for more than two data types. For example, we also
have pa�ents who have HbA1c>6.5%. Combining these three data types with an OR gives us all the
pa�ents:
 E11.9 OR me�ormin OR HbA1c>6.5%.
AND only gives us the pa�ents with the ICD-10 code for diabetes, prescribed me�ormin, and
HbA1c>6.5%:
 E11.9 AND me�ormin AND HbA1c>6.5%.
NOT gives us only those with the ICD code but neither taking me�ormin nor having HbA1c>6.5%:
 E11.9 NOT me�ormin NOT HbA1c>6.5%.
We can also use parentheses. To include only pa�ents who take me�ormin and have either the ICD-
10 code or an HBA1c greater than 6.5 percent, we can do as follows:
 me�ormin AND [E11.9 OR HbA1c>6.5%].
If we want to include those who have the ICD-10 code for diabetes or take me�ormin and have
HbA1c>6.5%, we express it like this:
 E11.9 OR [me�ormin AND HbA1c>6.5%].
Parentheses can be nested as well.
When combining mul�ple data types, we should consider how the use of the Boolean logic operators
and the individual performance of any single data type will affect the overall algorithm perfor-
mance. Data types that are very sensi�ve but not very specific should be combined with other more
specific data types using the AND operator. This will reduce the number of false posi�ves. Combining
a very sensi�ve but not very specific data type by an OR will lead to more false posi�ves in the algo-
rithm.
Very specific but not very sensi�ve data types should be combined with other data types by the OR
operator. These data types are good predictors, but other data types should be included to increase
sensi�vity to find all the cases in the dataset. Using the AND operator with these data types will limit
the overall sensi�vity of the algorithm.

 Iden�fica�on of a pa�ent popula�on
Clear defini�on of the popula�on for phenotyping is crucial to understand the validity and u�lity of
the further analyses in this popula�on. A gold standard popula�on is a manually reviewed set of EHRs
to determine whether pa�ents have the condi�on of interest. Using a gold standard, we can assess
20

how accurate a phenotyping algorithm at correctly classifying those pa�ents with and without the
condi�on.
First, we determine a diagnosis or a condi�on of interest and a level of evidence. Defining the level of
evidence depends on the analy�c ques�on. In case of a gene�c or biological study, requiring a lab
test indica�ng a condi�on is a high level of evidence because the lab test measures the biology of the
pa�ent, rather than relying on a physician recording that the pa�ent has the condi�on. If we want to
include pa�ents recognized by the healthcare system as having the condi�on, a clinical note by the
physician and possibly presence of an ICD diagnosis code can be enough.
Then, we determine who will perform the manual review of EHR: what level of exper�se is appropri-
ate and how many reviewers are acceptable. Depending on the complexity, the review may require
from one to a panel of minimum two reviewers. For example, assessing whether a pa�ent has ever
smoked would be acceptable for a single reviewer. But in the case when a review is retrospec�vely
diagnosing a pa�ent, reviewers should have medical knowledge appropriate for the popula�on of in-
terest. Reviewing can be done as a paired review, when the reviewers read the record at the same
�me and come to a consensus, or separately.
Reviewers may disagree on the classifica�on of the record: for example, Reviewer 1 believes the rec-
ord is the case, and Reviewer 2 classifies it as a control. There are few methods to solve it (36):
 • Joint review when both reviewers discuss the record and come to a consensus. It may clarify
 an underlying difference in interpreta�on of the phenotype.
 • Involvement of the third record reviewer who makes the final classifica�on of the record.
 • Expert reviewer designation when one of the reviewers may be classified as an “expert” and
 his classifica�on is final.
When there is more than one reviewer, Cohen’s kappa coefficient is used to test interrater reliability,
i.e., to measure how consistent the two reviewers have been in their reviews (75).
 −
 =
 1 −
It compares the propor�on of observed agreement with the propor�on of expected agreement if the
values were randomly assigned.
 Reviewer 1 “YES” Reviewer 1 “NO”
 Reviewer 2 “YES” A B
 Reviewer 2 “NO” C D
In this table, A and D are the number of �mes Reviewers 1 and 2 agree with each other. Then, the ob-
served propor�on of agreement is:
 +
 =
 + + +
For calcula�ng the expected propor�on of agreement, we need to 1) calculate the likelihood of both
Reviewer 1 and 2 assigning “Yes” at random, 2) calculate the likelihood of both Reviewer 1 and 2
21

assigning “No” at random, and 3) combine those likelihoods to get the expected propor�on of agree-
ment.
The expected probability that both would say yes at random is:
 + +
 = ×
 + + + + + +
Similarly,
 + +
 = ×
 + + + + + +
Then,
 = +
And finally, we can calculate Cohen’s kappa to determine the quality of the review.
Phenotyping typically uses an itera�ve approach for manual review. First, the researchers create a
prototype of the algorithm, randomly select a subset of records that the algorithm classifies as cases
or controls and then review those records to see how well the algorithm has performed. Based on
this review, the algorithm may be changed by adding or removing criteria, and then a new random
subset of records is selected for the second round of the algorithm evalua�on. This con�nues un�l
sa�sfactory performance of the algorithm is achieved. A final valida�on on completely randomly se-
lected records must be performed to get generalizable performance sta�s�cs for the algorithm.

 Methods for electronic phenotyping
There are several methods which can be used for phenotype discovery.
 • Rule-based methods
Rule-based methods imply involvement of clinicians for specifying inclusion and exclusion criteria
while iden�fying pa�ent cohorts based on structured data elements. Such methods work well for
phenotypes with clear diagnosis and procedure codes, for example, for coronary artery disease (41),
atrial fibrilla�on (42), and rheumatoid arthri�s (43). However, the scope of rule-based approaches is
limited, especially for iden�fying more complex phenotypes or working with less standardized da-
tasets. For example, Kern et al. studied chronic kidney disease among diabe�c pa�ents with rule-
based methods, they got poor algorithm sensi�vity since 42% of the pa�ents had seven different ICD
diagnosis codes (44).
 • Natural language processing
Unstructured data, including text from clinical notes, discharge summaries, and radiology and pathol-
ogy reports, represent approximately 80% of EHR data (45). Natural Language Processing (NLP) can
be broadly defined as automa�c processing of human language. It is a combina�on of ML and linguis-
�cs and is used to extract structured concepts from unstructured text data. Therefore, it is extremely
valuable for EHR data analysis.
NLP methods can be beneficiary used together with rule-based or sta�s�cal learning methods. Carroll
et al. combined NLP techniques with structured data to create a support vector machine (SVM)
22

classifier for rheumatoid arthri�s (46). Liao et al. demonstrated for several disease categories that in-
tegra�on of NLP and structured data par�cularly improved the algorithms performance (47).
There are several NLP tools showing excellent results in specific use cases (like for extrac�ng respira-
tory diagnoses and smoking statuses from discharge leters (48) and tools for iden�fying peripheral
artery disease from clinical notes (49) and radiology reports (50)). However, the generalizability of
such tools varies due to several reasons, such as variability in clinical language between sites as well
as of the underlying clinical data models (51).
 • Supervised machine-learning methods
ML commonly refers to a collec�on of mathema�cal and computer science techniques for extrac�ng
knowledge from large datasets as well as to the use of these techniques for solving classifica�on, pre-
dic�on, and es�ma�on problems (37). ML algorithms con�nuously learn and develop by themselves
without being explicitly programmed.
Supervised methods use labelled data for learning. Supervised learning in phenotyping aims to con-
struct predic�ve models that dis�nguish individuals with a specific disease from unaffected ones.
Huang et al. used an FSSMC (feature selec�on via supervised model construc�on) technique to iden-
�fy a cohort of diabe�c pa�ents (52). The authors manually went through an ini�al set of 410 varia-
bles to narrow it down to 47 and ran the algorithm to rank the features with the highest performance
in order of importance for the phenotype defini�on.
Carroll et al. (46) developed a phenotyping algorithm for rheumatoid arthri�s using SVM. They had
medica�on data, ICD diagnosis codes, and clinical concepts extracted from clinical narra�ves availa-
ble. When tes�ng the algorithm on a naïve (non-curated) dataset and an expert-defined dataset, the
SVM trained on the naïve dataset without any feature engineering showed almost as good perfor-
mance as the SVM built on the expert-defined dataset.
 • Semi-supervised machine-learning methods
Rule-based and supervised ML methods as well as NLP techniques require manually labeled gold
standard training and test datasets for model building and valida�on. This process is very expensive,
�me-consuming, and require involvement of clinicians with domain knowledge. Moreover, these gold
standard corpora are usually not portable across ins�tu�ons and cannot be shared due to privacy
regula�ons.
Semi-supervised learning is a class of supervised tasks and techniques that require only a small
amount of labeled data together with a large amount of unlabeled data (40).
In their studies, Halpern et al. (53) and Agarwal et al. (54) used a large amount of imperfectly labeled
training data and could still build good phenotype classifiers. Halpern et al. (53) introduced anchor
variables, which are highly informative, clinically relevant features for a specific phenotype defined
by clinical experts. They may be a particular text phrase found in clinical notes, specific medications,
lab tests, diagnosis and procedure codes and need to satisfy certain mathematical properties. In the
study by Agarwal et al., the authors assumed the presence of descriptive phrases/ keywords in clini-
cal notes in a patient’s EHR if a patient exhibits the phenotype of interest and absence of such key-
words in the opposite case (54).
You can also read