Cyanobacteria blooms in the Baltic Sea: a review of models and facts
←
→
Page content transcription
If your browser does not render page correctly, please read the page content below
Biogeosciences, 18, 2347–2378, 2021
https://doi.org/10.5194/bg-18-2347-2021
© Author(s) 2021. This work is distributed under
the Creative Commons Attribution 4.0 License.

Cyanobacteria blooms in the Baltic Sea: a review of
models and facts
Britta Munkes1 , Ulrike Löptien1,2 , and Heiner Dietze1,2
1 GEOMAR,        Helmholtz Centre for Ocean Research Kiel, Düsternbrooker Weg 20, 24105 Kiel, Germany
2 Institute   of Geosciences, Christian Albrechts University of Kiel, Ludewig-Meyn-Str. 10, 24118 Kiel, Germany

Correspondence: Britta Munkes (bmunkes@geomar.de)

Received: 30 April 2020 – Discussion started: 19 May 2020
Revised: 15 December 2020 – Accepted: 10 February 2021 – Published: 13 April 2021

Abstract. The ecosystem of the Baltic Sea is endangered           the world (Helcom, 2018b), where international efforts have
by eutrophication. This has triggered expensive international     been successful in reducing nutrient loads considerably (Hel-
management efforts. Some of these efforts are impeded             com, 2018a). On the other hand, despite all the resource-
by natural processes such as nitrogen-fixing cyanobacteria        intensive management efforts, the state of the ecosystem has
blooms that add bioavailable nitrogen to the already over-        not significantly improved yet (HOLAS II core indicator re-
fertilized system and thereby enhance primary production,         port, 2017; Gustafsson et al., 2017). One major cause is
export of organic matter to depth, and associated oxygen con-     considered to be related to sedimentary processes. Another
sumption. Controls of cyanobacteria blooms are not com-           concern is nitrogen-fixing cyanobacteria blooms, which are
prehensively understood, and this adds to the uncertainty         suspected to become more prevalent with warming tempera-
of model-based projections into the warming future of the         tures.
Baltic Sea. Here we review our current understanding of              The ability of cyanobacteria to utilize dinitrogen, a vir-
cyanobacteria bloom dynamics. We summarize published              tually unlimited resource in the air, and to convert it into
field studies and laboratory experiments and dissect the ba-      bioavailable nitrogen, links their dynamics closely to the eu-
sic principles ingrained in state-of-the-art coupled ocean–       trophication problem of the Baltic Sea by adding nutrients to
circulation biogeochemical models.                                an already over-fertilized ecosystem. There is consensus that
                                                                  the fixed nitrogen is a major contribution to the overall nutri-
                                                                  ent budget. Quantitative estimates range from 20 % to 50 %
                                                                  of the total new nitrogen supply (as opposed to regenerated
1   Introduction                                                  nitrogen) that is available to the phytoplankton community
                                                                  (Adam et al., 2016; Gustafsson et al., 2017; Moisander et al.,
The Baltic Sea is a shallow, brackish, and semi-enclosed          2007; Vahtera et al., 2005; Whitton and Potts, 2002; Ploug et
sea in central northern Europe. Its drainage basin is densely     al., 2011). The future evolution of the total new nitrogen in-
populated by around 84 million people. Their footprint ex-        put is, however, not clear yet. While with rising temperatures
erts pressure on the ecosystem (Unger et al., 2013; Han-          increasing blooms are likely (Carey et al., 2012; Paerl, 2014),
nerz and Destouni, 2006). One particularly severe problem         the effects of environmental management-induced changes
is eutrophication. Anthropogenic nutrients enter the Baltic       in nutrient loads are less clear: one argument is that a reduc-
Sea via rivers and air–sea fluxes (Helcom, 2014, 2018a).          tion of the loads will have no net effect on the nutrient bud-
Starting with the first Helsinki Convention in 1974, several      get because cyanobacteria will compensate the reduction by
international environmental management plans have been            fixing additional atmospheric nitrogen. A contrary view sug-
put to work, so far with varying degrees of success (e.g.         gests that reduced loads will decrease primary productivity
Helsinki Convention, EU Marine Strategy Framework Direc-          because nitrogen fixation is capped and cannot fully compen-
tive, Baltic Sea Action Plan). On the one hand the Baltic         sate reductions in nutrient loads (Molot et al., 2014). Among
Sea is one of the best investigated and managed seas in

Published by Copernicus Publications on behalf of the European Geosciences Union.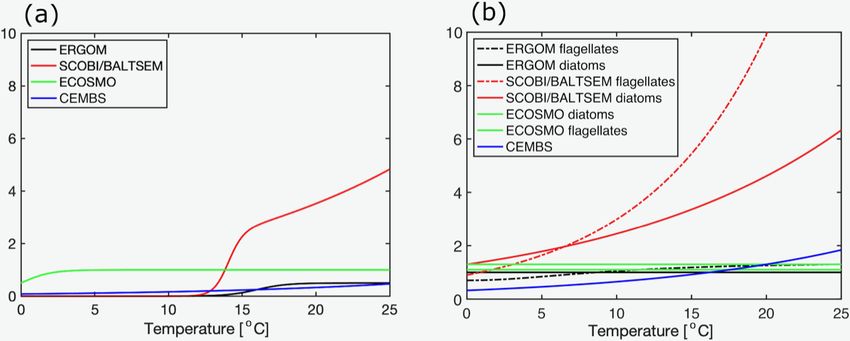
2348                                                                    B. Munkes et al.: Cyanobacteria blooms in the Baltic

the reasons for a capped fixation are (1) limited availability         Despite the importance of cyanobacteria for the Baltic
of light which throttles the metabolically expensive process        Sea ecosystem, the processes involved in the bloom forma-
of fixation, (2) limited bioavailability of one or several of the   tion of cyanobacteria are still not comprehensively under-
following elements, phosphorus, iron, and molybdenum, and           stood (Hense and Beckmann, 2006; Shimoda and Arhon-
(3) turbulent water movement (Moisander et al., 2002; Paerl         ditsis, 2015; Taranu et al., 2012). Numerous abiotic and bi-
and Huisman, 2009).                                                 otic factors promoting cyanobacteria growth have been sug-
   Some of the reviewed studies on cyanobacteria assume             gested and are often controversially discussed (e.g. Unger
that global warming will exacerbate the existing oxygen de-         et al., 2013). Our present understanding of the dynamics
ficiency in the Baltic Sea. Warming decreases the solubility        of cyanobacteria, as summarized in biogeochemical ocean
of oxygen in seawater, which leads to lower oxygen concen-          models, relies mainly on empirical field correlations rather
trations. Further, warming conditions may favour cyanobac-          than on a comprehensive understanding of physiological
teria because they are better adapted to oligotrophy and they       responses to environmental conditions. These correlations,
benefit from the increased light levels that come along with        however, may well break under changing environmental con-
increased stratification in response to increased air–sea heat      ditions, thereby retarding model-based forecasts of the ef-
fluxes (Carey et al., 2012; Paerl and Huisman, 2009; Ander-         fects of potentially expensive management efforts.
sson et al., 2015b). Increased nitrogen fixation helps to over-        In summary, deficient process understanding introduces
come oligotrophy and increases primary production and sub-          considerable uncertainty to projections of numerical biogeo-
sequent export of organic matter to depth. This in turn feeds       chemical models, both globally (e.g. Landolfi et al., 2018)
remineralization and drives oxygen consumption at depth.            and in the Baltic Sea (e.g. Meier et al., 2012, their Fig. 7).
Potentially evolving hypoxic or even anoxic environments            Even so, such projections often support environmental man-
may then prove lethal to fish and their fry (Elmgren, 2001;         agement decisions. This study summarizes knowledge about
Elmgren and Larsson, 2001b; Nehring and Matthäus, 1991;             cyanobacteria dynamics in the Baltic Sea and compares it
Gustafsson, 2012; Diaz and Rosenberg, 2008, 1995; Breit-            with current state-of-the-art biogeochemical Baltic Sea mod-
burg et al., 2018). One problem that makes consequences of          els. Our aim is to identify knowledge gaps, thereby promot-
this chain of events so unpredictable and a precise quanti-         ing the development of more reliable models. More specif-
tative process understanding so desirable is the existence of       ically, we will (1) dissect the current generation of biogeo-
a positive feedback loop where low-oxygen conditions may            chemical Baltic Sea models in an attempt to understand
drive P release from the sediments. This excess P (which            their underlying paradigms of cyanobacteria competitive-
comes without the Redfield N equivalent to the system)              ness and (2) review published studies focussed on observa-
may fuel additional cyanobacteria blooms (Conley et al.,            tions and experimental results on controls of the most dom-
2002; Savchuk, 2018; Stigebrandt et al., 2014; Vahtera et al.,      inant cyanobacteria species in the Baltic: Aphanizomenon
2007b), thereby closing the positive feedback loop.                 flos-aquae, Dolichospermum sp., and Nodularia spumigena
   Further motivation to understand cyanobacteria dynamics          (Suikkanen et al., 2010).
in the Baltic Sea comes from some of the species’ capabil-             We start with a comparison of five state-of-the-art model
ity to release toxins. There is evidence that the production of     approaches in Sect. 2. Section 3 puts the model assump-
cyanobacterial toxins can increase with increasing nitrogen         tions in the context of published observational and experi-
supply (Gobler et al., 2016; Dolman et al., 2012). Further-         mental studies. We will end with a discussion and summary
more, it has been found in cultures that toxicity peaks when        in Sects. 4 and 5, respectively.
growth of the respective cyanobacteria is optimal (Lehtimäki
et al., 1997). This is problematic because the toxins can lead
to mass die-offs of mammals, fish, and filtering organisms          2   Current model approaches
(cf. Breitburg et al., 2018; Sipiä et al., 2001; Karlsson et al.,
2005; Paerl, 2014; Hense, 2007; Hense and Beckmann, 2010;           In the following we compare five coupled biogeochemical
Kuznetsov et al., 2008; Mazur-Marzec et al., 2013; Stal et al.,     Baltic Sea models in terms of their mathematical formula-
2003). In the Baltic one of the most relevant cyanobacteria         tions and underlying assumptions. Our choice of five is mo-
species, Nodularia spumigena, produces the toxin Nodularin.         tivated by picking those that represent the state of the art con-
An additional thread comes from Dolichospermum sp. and              veyed to stakeholders; i.e. results from this class of models
Aphanizomenon flos-aquae, which are also able to produce            influence political decision-making (cf. Eilola et al., 2011;
toxins. In addition to toxicity, intense cyanobacteria blooms       Meier et al., 2012, 2014; Neumann et al., 2002, 2012; Meier
can lead to a detrimental loss of water clarity. In shallow         et al., 2011a).
coastal areas this can shade benthic macrophytes, thereby ef-          Four of the biogeochemical models, dissected here,
fectively reducing their growth and survival, which in turn         are coupled to full ocean circulation models: CEMBS
has negative effects on invertebrates and fish that use macro-      (Dzierzbicka-Głowacka et al., 2013; Nowicki et al.,
phytes as a habitat for food and shelter (Short and Wyllie-         2015, 2016), ECOSMO II (e.g. Daewel and Schrum,
Echeverria, 1996).                                                  2013, 2017), ERGOM (e.g. Janssen et al., 2004; Kremp et

Biogeosciences, 18, 2347–2378, 2021                                                    https://doi.org/10.5194/bg-18-2347-2021
B. Munkes et al.: Cyanobacteria blooms in the Baltic                                                                           2349

al., 2007; Kuznetsov et al., 2008; Neumann et al., 2002; Neu-        flexible way than the other models investigated here). Explic-
mann and Schernewski, 2005, 2008; Schernewski and Neu-               itly resolved nutrients are nitrate, ammonium, phosphate (in
mann, 2005), and SCOBI (e.g. Almroth-Rosell et al., 2011;            all models considered here), and silicate in those models that
Eilola et al., 2009; Meier et al., 2011b). In addition, we in-       explicitly resolve diatoms (BLATSEM, CEMBS, ECOSMO
clude BALTSEM which, although it is a box model rather               only). The availability of nutrients in combination with light
than a full-fledged coupled ocean–circulation biogeochemi-           and temperature typically determines phytoplankton growth
cal model, BALTSEM has impacted stakeholders consider-               rates.
ably ever since it was developed in the early 1990s in an at-           It is common practice to group phytoplankton species into
tempt to support the Baltic Marine Environment Protection            functional groups for each of which a distinct set of model
Commission – Helsinki Commission (HELCOM) and to de-                 parameters is defined. The models considered here are simi-
velop the HELCOM Baltic Sea Action Plan (Gustafsson et               lar to one another in that they all differentiate between three
al., 2017; Savchuk, 2002; Savchuk et al., 2012). Specifically,       functional groups with diatoms, cyanobacteria being com-
we will review the reference version of BALTSEM, as ini-             mon to all of them. As for the third group, ECOSMO, ER-
tially developed for the Gulf of Riga (Savchuk, 2002).               GOM, and SCOBI refer to it as flagellates, BALTSEM as
                                                                     summer species, and CEMBS as small phytoplankton.
2.1   General model structures                                          A basic concept of the current generation of biogeochem-
                                                                     ical models is generally the widespread paradigm that di-
CEMBS, ECOSMO, ERGOM, SCOBI, and BALTSEM are                         azotrophic cyanobacteria grow more slowly than ordinary
all mechanistic models as opposed to statistical models. They        phytoplankton and can, therefore, in most models only thrive
are, essentially, a set of partial differential equations that de-   when nitrogen is no longer accessible to ordinary phyto-
scribe the temporal evolution of prognostic entities of rele-        plankton (LaRoche and Breitbarth, 2005; Hense and Beck-
vance or interest. Typical entities of relevance are variables       mann, 2006; Deutsch et al., 2007).
such as nutrient, phytoplankton, and zooplankton concentra-             The phytoplankton bloom dynamics is generally deter-
tions. For each of these prognostic variables an equation is         mined by nutrient availability, which is the obvious reason
defined which relates their respective temporal derivative to        for the nitrogen depletion in surface waters. Losses to phy-
their biogeochemical sources and sinks which, typically, are         toplankton abundances are set by sink terms which are de-
interlaced. For example, the equation for phytoplankton com-         signed to account for viral lysis, extracellular release, and
prises a sink term associated with zooplankton grazing. This         zooplankton grazing. All models considered here resolve one
sink term appears as a source in the zooplankton equation and        functional group of zooplankton, with the exception of the
thereby interlaces the zooplankton equation with the phyto-          ECOSMO model, which resolves two (micro- and macro-
plankton equation.                                                   zooplankton). As a general rule, the model parameters asso-
   Complexity in mechanistic models that are based on par-           ciated with zooplankton growth (fuelled by grazing on phy-
tial differential equations is associated with the number of         toplankton) are tuned such that phytoplankton losses exceed
explicitly resolved prognostic variables and the number of           the growth, which ultimately leads to a termination of blooms
source and sink terms for each of the variables. Concep-             at the right time of the year. One may argue that the rep-
tual problems arise because there is no consensus concerning         resentation of zooplankton is more of a closure term than
both the number of prognostic variables and the mathemati-           an attempt to realistically simulate zooplankton dynamics. In
cal formulations of the respective source and sink terms. Typ-       any case this approach calls for the definition of additional
ically, the respective parameters and formulations are based         closure or sink terms for zooplankton. These sink terms for
on abductive reasoning which introduces substantial uncer-           zooplankton (biomass) typically comprise the production of
tainty to the realism of the model dynamics. An additional,          fecal pellets and death. Fecal pellets and dead zooplankton
albeit related, uncertainty is associated with the choice of         are the source of detritus (another prognostic variable) which
model parameters: as a rule of thumb, each source and sink           sinks to depths where it is remineralized or lost to the sedi-
term necessitates at least one parameter. Such parameters are        ment.
typically not well constrained even though they determine the           Typical attachments to the generic model backbone
model behaviour in a fundamental way. Examples of these              mapped out above are additional prognostic variables such
parameters are the maximum growth rate of phytoplankton              as oxygen and carbon (cf. CEMBS and a later version of ER-
and parameters which define the limiting effects of nutrient-        GOM, Kuznetsov and Neumann, 2013) and a basic represen-
and light-depleted conditions on autotrophic growth.                 tation of the sediment. These are, however, beyond the scope
   All models considered here are similar in that primary            of this review, which focusses on cyanobacteria.
production fuelled by photosynthetically available radiation            In the following we will elucidate differences among the
generates phytoplankton biomass which is proportional to             models which, even though they share a similar basic struc-
the uptake of dissolved nutrients (BALTSEM being some-               ture, might feature very different sensitivities to changing en-
what different here because, by applying a variable Redfield         vironmental conditions simply due to differing details in the
ratio, it links nutrient uptake to carbon assimilation in a more     specific formulations.

https://doi.org/10.5194/bg-18-2347-2021                                                     Biogeosciences, 18, 2347–2378, 2021
2350 B. Munkes et al.: Cyanobacteria blooms in the Baltic
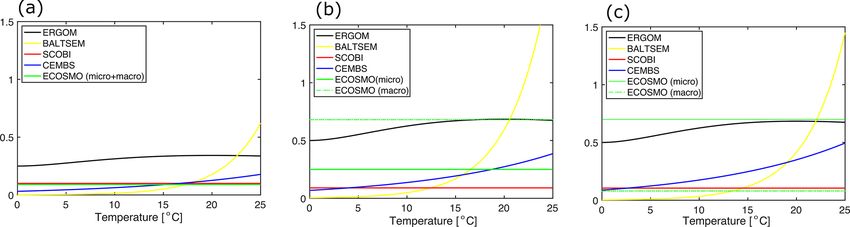
Table 1. Coupled biogeochemical ocean models considered in this 15 ◦ C cyanobacteria grow almost as fast as diatoms (cf.
study. Note that models evolve over time. We refer to the referenced Fig. 1b). ERGOM does also account for the effects of ambi-
versions below. ent temperatures, but the sensitivity is lower. For one, growth
never accelerates above the maximum growth rate of 0.5 d−1
Model Reference (thus, in contrast to SCOBI, ERGOM’s maximum growth
BALTSEM Savchuck (2002) rate is really a maximum rate). The ERGOM model stalls
CEMBS Dzierzbicka-Głowacka et al. (2013) all cyanobacteria growth below 12 ◦ C and sets maximum
ECOSMO Daewel and Schrum (2013) growth at temperatures exceeding ≈ 19 ◦ C. In contrast, the
ERGOM Neumann et al. (2002) assumed increase in growth with temperature is rather grad-
SCOBI Eilola et al. (2009) ual in the CEMBS model. The ECOSMO model includes a
comparably weak temperature dependence for cyanobacteria
growth (Ute Daewel, personal communication, 2020). This
2.2 Growth formulation of cyanobacteria model does, however, include a strong light dependence of
cyanobacteria growth, which presumably has a very simi-
In this subsection, we compare the formulations of cyanobac- lar effect because high light levels are typically related to
teria growth. Special emphasis is given to the relations of high incoming solar radiation and shallow surface mixed-
cyanobacteria growth to the respective other two functional layer depths which, in turn, are typically related to higher
phytoplankton groups, because these relations inherently de- surface temperatures.
fine the niche for cyanobacteria (i.e. the conditions under The maximum growth as defined by the modulation of the
which they may outcompete other functional groups). Table 2 maximum growth rate by the respective temperature sensi-
provides an overview for biogeochemical modellers in that it tivity is damped under nutrient- and/or light-depleted condi-
lists all model parameters considered in this study. In the fol- tions. The models under consideration differ considerably in
lowing we will elaborate on the respective differences. this implementation. In SCOBI, the limitation of growth is
There is consensus among the models that the growth of implemented by multiplying by several factors, all of which
cyanobacteria is controlled by the availability of light, tem- are smaller than 1. Each factor describes the limiting effect of
perature, and phosphate. All the models assume that high one resource (such as phosphate concentration or availabil-
temperatures accelerate the growth. The respective func- ity of light). The other models apply the concept of Liebig,
tional forms and thresholds, however, differ between models, which assumes that the limitation is set by the most depleted
with the ERGOM model requiring the highest temperatures essential resource rather than being the result of the com-
to permit growth (Fig. 1a). The SCOBI and ECOSMO mod- bined effect of various depleted resources that potentially
els include an additional switch which shuts down cyanobac- modulate one another.
terial growth at salinities above 10 and 11.5 PSU, respec- All models considered here agree that the growth of
tively. Yet another level of complexity is added in SCOBI, cyanobacteria depends on the availability of light and phos-
where growth necessitates oxygen concentrations above phate, while other macro-nutrients are not limiting. Phos-
0.1 mL O2 L−1 , with growth gradually increasing above this phate limitation is implemented by using a “Michaelis–
oxygen threshold. PO3−
4
Menten formulation” (i.e. ). The respective half-
The model behaviour is imprinted by their respective PO3−
4 +KP
mathematical formulations and several, often rather poorly, saturation constant, KP , varies substantially between mod-
constrained model parameters. All models considered here els (Table 3), which imprints different sensitivities to phos-
share the concept of a maximum growth rate that is mul- phate limitation into their respective dynamics. Among the
tiplied by other expressions that represent the external fac- models, ERGOM is special in that it squares all terms (i.e.
(PO3−
4 )
2
tors that limit this maximum growth capability. The actual ), which steepens the nutrient-limitation curve
(PO3− 2 2
4 ) +KP
maximum growth rates applied (cf. Table 3) differ consid- considerably, effectively setting a threshold rather than a
erably among the models: in CEMBS (and ERGOM) the gradual limitation.
maximum growth of cyanobacteria is (less than) half com- Other than the steepness, one consequence of differing
pared to other models. CEMBS and ERGOM assume that KP is that simulated cyanobacteria reach maximum growth
cyanobacteria grow, even at their maximum, rather slowly at very different levels of phosphate. SCOBI and ECOSM
compared to the other functional groups. In the other mod- reach full growth already at very low phosphate concentra-
els, these differences are less pronounced. Figure 1 puts this tions, while CEMBS and ERGOM need much higher phos-
comparison into perspective by accounting for the respec- phate values to reach maximum growth – higher not only
tive modulation by the water temperature. SCOBI and BALT- compared to the other models, but also relative to their re-
SEM are strongly affected by water temperatures: cyanobac- spective other functional groups.
teria grow more than twice as fast at temperatures between Common to all models considered here is that the
12 and 14 ◦ C than at temperatures below 12 ◦ C, and growth cyanobacteria are never limited by the availability of
accelerates further with rising temperatures (Fig. 1a). Above
Biogeosciences, 18, 2347–2378, 2021 https://doi.org/10.5194/bg-18-2347-2021B. Munkes et al.: Cyanobacteria blooms in the Baltic 2351
Table 2. Description and units of the ecosystem model parameters considered in this study. The focus is on those parameters that differ
among the different functional groups.
Parameter Description Unit
µ Max. phytoplankton growth rates d−1
KP Half-saturation constant for phosphate mmol P m−3
mot Linear phytoplankton mortality d−1
motquad Quadratic phytoplankton mortality d−1 (mmol P m−3 )−1
σ Max. zooplankton grazing d−1
ai Food preference per functional type i = 1, 2, 3 Unitless
(optionally multiplied to σ )
sinki Sinking rate of phytoplankton m d−1
Table 3. Key model parameters impacting cyanobacteria growth and sinking rates of phytoplankton put into relation to the respective param-
eters of other functional groups. All models include three functional phytoplankton groups, including cyanobacteria and diatoms. The third
functional group, however, is called “flagellates” in ECOSMO, ERGOM, and SCOBI, while BALTSEM refers to the third functional group
as “summer species” and CEMBS as “small phytoplankton”. Note that the ERGOM model uses a modified Michaelis–Menten formulation
and the half-saturation constants are thus not directly comparable to the other models. For models which include temperature dependence
(Fig. 1), the values provided refer to 0 ◦ C (BALTSEM). Note that, as a peculiarity, the BALTSEM models use different sinking rates for
diatoms in spring and autumn, and the sinking speed also depends on temperature, environmental conditions, and morphology. Also, the
half-saturation constants for the BALTSEM model and the maximum growth rates of the CEMBS model are unit-converted from the original
values. The bold text refers to cyanobacteria.
Model µ (cyan.; KP (cyan.; sinki (cyan.;
diatoms; others) diatoms; others) diatoms; others)
BALTSEM 1.0; 1.3; 0.9 0.05; 0.1; 0.05 0.1; 0.5/0.1; 0.1
CEMBS 0.33; 1.3 1.3 0.5; 0.1; 0.05 not provided
ECOSMO 1.0; 1.3; 1.1 0.05; 0.05; 0.05 −0.1; 0.0; 0.0
ERGOM 0.5; 1.0; 0.7 0.5; 0.3; 0.15 −0.1; 0.5,0.0
SCOBI 1.0; 1.3; 0.9 0.05; 0.1; 0.05 0.0; 0.5; 0.1
bioavailable nitrogen (one exception being cyanobacteria be- differ: in BALTSEM, ERGOM, and SCOBI light limitation
low the surface in ECOSMO). The fixation of nitrogen is (lightlim ) for all functional groups is expressed based on an
coupled to the uptake of phosphate in all models. In the ab- assumed optimal light level (Iopt ):
sence of ammonium and nitrate, the models top up their intra-
cellular nitrogen concentrations until a predefined N : P Red- IPAR
lightlim = IPAR /Iopt · exp(1 − ). (1)
field ratio is met. BALTSEM is a more complex flavour of Iopt
this rule, by changing the intracellular N : P ratios depending
on the environmental conditions (water temperature, ratio of IPAR denotes the incoming photosynthetically available ra-
ambient N:P concentrations and phosphate concentrations). diation (PAR) in the respective depth layer. Iopt is set to
Despite the differences among the model formulations 50 W m−2 in BALTSEM and 25 W m−2 in SCOBI.
outlined above, all models agree in that cyanobacteria have ECOSMO and CEMBS, in contrast, assume that the light
an advantage over other functional groups under nitrate- requirement for cyanobacteria is higher than for other func-
depleted conditions – if phosphate is available. This phos- tional groups. This considers that nitrogen fixation is an en-
phate, which has no Redfield equivalent of bioavailable nitro- ergetically expensive process which has to break the dini-
gen, is also referred to as excess phosphate. In summary, all trogen molecule and thus has to overcome the strongest
models agree in that excess phosphate promotes a cyanobac- atom-to-atom bond among all bonds involving two atoms.
teria bloom. In ECOSMO a threshold, exclusive to cyanobacteria, of
Besides the impact of temperature and phosphorus lim- 120 W m−2 , shuts down all growth when undercut. In
itation, there is consensus that the availability of light is CEMBS the formulation of differing light sensitivities for
essential to the growth of cyanobacteria. Details, however, the respective functional groups is more complex: built on
a modification (which directly includes a calculation of self-
https://doi.org/10.5194/bg-18-2347-2021 Biogeosciences, 18, 2347–2378, 20212352 B. Munkes et al.: Cyanobacteria blooms in the Baltic
shading effects) of the classical approach which expresses models differ widely. Typically, this formulation is non-
light limitation based on a PI curve (lightlim = 1 − exp(−α · linear since the development of zooplankton biomass de-
PAR)), CEMBS prescribes different initial slopes for each pends on its biomass. Another prerequisite for zooplankton
of the functional groups. The lowest initial slope, α = 0.17, growth or, rather, increase in its own biomass is food avail-
is prescribed for cyanobacteria, while the 0.3 and 0.34 for ability. Here, the different models consider different potential
diatoms and small phytoplankton, respectively, imprint a food sources and use very different additional constraints: for
higher competitiveness under low-light conditions. On a example, the ECOSMO model differentiates two zooplank-
side note (which does not affect the competition between ton groups (micro- and macro-zooplankton) and assumes
cyanobacteria and other functional groups in each of the re- that micro-zooplankton feeds on phytoplankton and detri-
spective models), the formulations, describing light attenu- tus, while macro-zooplankton feeds additionally on micro-
ation within the water column, differ substantially among zooplankton. In contrast, the ERGOM model assumes that
the models: BALTSEM accounts for shading effects of au- their single explicitly represented zooplankton group feeds
totrophs, heterotrophs, and detritus, while ECOSMO only only on phytoplankton. In ERGOM, as in BALTSEM and
accounts for autotrophs. In addition, the attenuation coeffi- CEMBS, maximum grazing rates are temperature-dependent
cients of photosynthetically available radiation in seawater (Fig. 2), while SCOBI is the only model which assumes an
itself vary by almost a factor of 3 from one model to another. oxygen dependency of the grazing rates. A comprehensive
Indirectly related to the formulation of light limitation is assessment of all these grazing formulations has not been
the representation of cyanobacteria’s capabilities to control published yet and is beyond the scope of this study. The ma-
their buoyancy. Some species have gas vacuoles which give jor aim here is merely to compare those parameters and for-
them the means to move upwards to the sunlit surface or mulations, which differ among functional groups within the
prevent them from being moved downwards. The respective models. In this respect selective grazing is of major interest.
model formulations, however, vary considerably: in the ER- A comparison of the maximum grazing rates of the (compet-
GOM and ECOSMO models cyanobacteria have an advan- ing) functional groups is shown in Table 4 and Fig. 2. All the
tage over other functional groups as they are positively buoy- models assume that zooplankton prefers phytoplankton and
ant and are, hence, less likely to be subducted into dark ocean avoids cyanobacteria if possible. The magnitude of this pref-
layers. In SCOBI the simulated cyanobacteria do not sink, erential grazing is, however, unclear. Most models assume
while other phytoplankton do. In BALTSEM the sinking that the preference for cyanobacteria is a factor of 2–3 lower
speed of cyanobacteria is identical to other summer species than for other functional groups. ECOSMO is an exception,
(cf. Table 3). with especially high food preferences. As a peculiarity, in
the BALTSEM model grazing rates depend additionally on
2.3 Loss terms for cyanobacteria the actual fixation rates, with higher nitrogen fixation rates
reducing the grazing pressure on cyanobacteria.
Even more uncertain than the source terms are the sinks
of cyanobacteria. The models generally assume some phy-
toplankton mortality, which can depend linearly and/or 3 Current knowledge about cyanobacteria’s biology
quadratically on the respective standing phytoplankton
3.1 Growth
stocks. These fixed rates mimic complex processes, such as
bacterial and viral lysis. In most considered models these The growth of cyanobacteria, like other photoautotrophic or-
parameters differ very little among functional groups (Ta- ganisms, depends on the availability of nutrients and light
ble 4). Exceptions are BALTSEM and CEMBS: in the and is, additionally, influenced by other abiotic factors, such
BALTSEM model the mortalities of the phytoplankton func- as temperature and salinity. In the following subsections we
tional groups follow different temperature dependencies. In discuss factors affecting the growth of cyanobacteria and
the CEMBS model the mortalities differ among functional highlight the differences between cyanobacteria and other
groups: cyanobacteria have a slightly higher linear mortality phytoplankton.
than other functional groups, while a quadratic phytoplank-
ton mortality is set to zero only for cyanobacteria. Gener- 3.1.1 Maximum growth
ally, these constant rates of phytoplankton mortality are set
to rather small values and thus typically receive only little at- Generally, cyanobacteria are thought to have slow growth
tention. Even so, we want to note that this is of importance rates in comparison to eukaryotic phytoplankton cells (But-
because the mortality determines the steady-state solutions terwick et al., 2005; Hense and Beckmann, 2006; Lips and
and, related, can drastically determine ecosystem responses Lips, 2008; Rakko and Seppäälä, 2014; Paerl and Otten,
to eutrophication (Löptien, 2011). 2013; Paerl, 2014; Vahtera et al., 2005). This assumption is
The largest loss term, however, is typically zooplankton also ingrained into the models (cf. Fig. 1). However, accord-
grazing. The knowledge and process understanding of this ing to Reynolds (2006) and Foy (1980), who report rather
component are still limited and the assumptions between similar maximal growth rates of cyanobacteria and micro-
Biogeosciences, 18, 2347–2378, 2021 https://doi.org/10.5194/bg-18-2347-2021B. Munkes et al.: Cyanobacteria blooms in the Baltic 2353
Table 4. Model parameters that determine the termination of cyanobacterial blooms. Comparison among the models and respective param-
eters of other functional groups. The phytoplankton mortality rates in BALTSEM depend on temperature and the environmental conditions.
The provided values refer to 0 ◦ C. Also, the BALTSEM model uses different parameter values for diatoms in spring and autumn. The pro-
vided values for σ for the ECOSMO and SCOBI models result from the product of max. zooplankton growth rate and food preference for
the respective phytoplankton functional groups. The two values for the ECOSMO model refer to their two zooplankton groups: macro- and
micro-zooplankton. The quadratic mortality for the CEMBS model was unit converted relative to the original values.
Model σ (cyan.; Phyt. mot (cyan.; Phyt. motquad (cyan.;
diatoms; other) diatoms; other) diatoms; other)
BALTSEM 0.3; 1.0/0.0; 0.7 0.4; 0.6/0.3; 0.4 –
CMEBS 0.9; 1.95; 2.5 0.17; 0.15; 0.15 0.0; 0.03; 0.03
ECOSMO 0.09/0.09; 0.25/ 0.08; 0.05; 0.08 –
0.68; 0.7/0.08
ERGOM 0.25; 0.5; 0.5 0.02; 0.02; 0.02 –
SCOBI 0.03; 0.09; 0.105 0.05; 0.05; 0.05 –
Figure 1. (a) Temperature dependence of the maximum growth for (a) cyanobacteria and for (b) other functional groups in the five considered
biogeochemical models (d−1 ).
algae, this assumption must be considered with some caution. others Aphanizomenon gracile and Dolichospermum sp.).
Based on a study of 16 phytoplankton species (among others Tables 5 and 6 summarize published maximum growth rates
Aphanizomenon flos-aquae and Dolichospermum flos-aquae, of the main cyanobacteria species in the Baltic Sea along
which are rather common also in the Baltic Sea), Reynolds with those of a choice of ordinary phytoplankton species.
(2006) states that the maximal growth rates differ so substan- Indeed, we find maximum growth rates that differ substan-
tially from species to species (even within functional groups) tially from one cyanobacteria species to another, and even
that generic statements about the functional groups cannot among strains (Table 5). On average however these studies
be made. The study by Foy (1980) explores 22 strains of report somewhat slower growth rates for the three cyanobac-
3 cyanobacteria genera (Aphanizomenon, Dolichospermum teria species than e.g. for chlorophytes (Tables 5 and 6).
sp., and Oscillatoria). He draws the conclusion that algal
– For Aphanizomenon flos-aquae maximal growth rates
size and shape appear to be better predictors of growth rates
of 0.18–1.34 d−1 are reported (Foy, 1980; Gotham and
than the affiliation to a specific functional group. This state-
Rhee, 1981; Rhee and Lederman, 1983; Konopka and
ment is supported by the fact that many cellular functions are
Brock, 1978; Lee and Rhee, 1997, 1999; Sommer,
strongly governed by the surface-area-to-volume ratio (Kruk
1981; Rakko and Seppäälä, 2014; Robarts and Zohary,
et al., 2010; Lewis , 1976). Further support showing similar
1987).
results comes from Lürling et al. (2013), who tested eight dif-
ferent cyanobacteria and eight chlorophyte species (among – Dolichospermum sp. shows maximal growth rates of
0.4–1.27 d−1 (Foy et al., 1976b; Konopka and Brock,
https://doi.org/10.5194/bg-18-2347-2021 Biogeosciences, 18, 2347–2378, 20212354 B. Munkes et al.: Cyanobacteria blooms in the Baltic
Figure 2. Maximum grazing rates in dependence of temperatures for (a) cyanobacteria, (b) diatoms, and (c) other phytoplankton (d−1 ).
Note that the BALTSEM model prescribes zero grazing of diatoms in autumn. The values for the ECOSMO and SCOBI models refer to the
product of max. zooplankton growth rate and food preference for the respective phytoplankton functional groups and the temperature effect.
The two values for the ECOSMO model refer to their two zooplankton groups: micro- and macro-zooplankton. All parameter values refer
to the respective references provided in Table 4. Note that the link to phytoplankton biomass differs considerably between the models, and a
direct comparison of the curves is not necessarily straightforward.
1978; Lürling et al., 2013; Nalewajko and Murphy, – Aphanizomenon flos-aquae has a somewhat wider op-
2001; Reynolds, 2006; Oh et al., 1991; Sommer, 1981; timal temperature range than Nodularia spumigena,
Tang et al., 1997). spanning from 16 to 31 ◦ C (Bugajev et al., 2015; Carey
et al., 2012; Robarts and Zohary, 1987; Paerl and Ot-
– Measured maximal growth rates of Nodularia spumi-
ten, 2013; Degerholm et al., 2006). Temperatures which
gena range from 0.13 to 0.6 d−1 (Cirés and Ballot, 2016;
permit some growth are considerably lower than the op-
Lehtimäki et al., 1997; Sommer et al., 2006).
timal temperatures: Cirés and Ballot (2016) report that
Maximum growth is only reached under optimal condi- Aphanizomenon flos-aquae is able to grow at temper-
tions that are rarely encountered in reality. In the following atures down to 10 ◦ C. Üveges et al. (2012) measured
we explore the processes that inhibit maximum growth, such intensive photosynthesis at even lower: 2–5 ◦ C.
as nutrient depletion, high light intensities, and suboptimal
temperatures. – For Dolichospermum sp. optimal temperatures for max-
imal growth lie between 18 and 25 ◦ C. Growth starts at
3.1.2 Temperature dependency 10 ◦ C, as reported by Hellweger et al. (2016), Konopka
and Brock (1978), Robarts and Zohary (1987), and Paerl
In terms of temperature dependency, the model formulations and Otten (2013).
differ widely, and some models (e.g. SCOBI and BALTSEM)
assume that cyanobacteria require higher temperatures than – Nodularia spumigena prefers 20–25◦ for optimal
ordinary phytoplankton for optimal growth (Fig. 1). The re- growth (Degerholm et al., 2006). Growth starts at 5 ◦ C
spective model assumptions are roughly in agreement with (Nordin et al., 1980).
experimental work: while cyanobacteria species typically
have optimal growth at higher temperatures than dinoflagel- 3.1.3 Nutrient demands
lates or diatoms (Paerl et al., 2011), there are only small dif-
ferences between cyanobacteria and green algae (Lürling et Because diazotrophs are able to fix atmospheric nitrogen,
al., 2013). However, there is considerable variation between bioavailable phosphorus is regarded as the essential limit-
species. Butterwick et al. (2005) report that differences be- ing nutrient in the Baltic Sea for diazotrophic cyanobacte-
tween algal species appear mainly at temperatures below 10 ria (where iron and molybdenum are generally sufficiently
and above 25 ◦ C when testing the growth rate of 21 species available). Note, however, that N2 fixation is a very energy-
within a temperature range between 2 and 35 ◦ C. Also, Foy demanding process which has the potential to reduce the
(1980) reports that the temperature optima of cultured Aph- growth rates by a factor of up to 2 or 3 (Hense and Beck-
anizomenon flos-aquae and Dolichospermum sp. and others mann, 2006; Rhee and Lederman, 1983; Paerl et al., 2006).
were similar to those of other planktonic autotrophs. Too low phosphate concentrations can prevent any growth.
Regarding the typical Baltic Sea species, Table 7 shows Phosphate (P) is essential, i.a. for cellular synthesis of
optimal temperature ranges for the growth of the cyanobac- nucleic acids, membrane phospholipids, as well as for en-
teria species compared to other phytoplankton species. In the ergy transfer through tri- and bi-phosphorylated nucleotides
following we summarize the respective results. (Degerholm et al., 2006). All models agree that the availabil-
Biogeosciences, 18, 2347–2378, 2021 https://doi.org/10.5194/bg-18-2347-2021B. Munkes et al.: Cyanobacteria blooms in the Baltic 2355
Table 5. Maximal growth rates (µ) of the studied cyanobacteria species.
Class Species µ Reference
Cyanobacteria Aphanizomenon flos-aquae 0.39 Foy et al. (1976b)
Cyanobacteria Aphanizomenon flos-aquae 0.89 Gotham and Rhee (1981)
Cyanobacteria Aphanizomenon flos-aquae 0.95–1.34 Rhee and Lederman (1983)
Cyanobacteria Aphanizomenon flos-aquae 0.99 Lee and Rhee (1999)
Cyanobacteria Aphanizomenon flos-aquae 0.43 Sommer (1981)
Cyanobacteria Aphanizomenon flos-aquae 0.89 Gotham and Rhee (1981)
Cyanobacteria Aphanizomenon flos-aquae 0.28–0.31 Rakko and Seppäälä (2014)
Cyanobacteria Aphanizomenon flos-aquae 0.25–0.75 Lee and Rhee (1997)
Cyanobacteria Aphanizomenon flos-aquae 0.18 Konopka and Brock (1978)
Cyanobacteria Aphanizomenon flos-aquae 1.2 Robarts and Zohary (1987)
Cyanobacteria Dolichospermum sp. 0.51 Foy et al. (1976b)
Cyanobacteria Dolichospermum sp. 0.41 Sommer (1981)
Cyanobacteria Dolichospermum sp. 0.78 Reynolds (2006)
Cyanobacteria Dolichospermum sp. 0.4–1.1 Tang et al. (1997)
Cyanobacteria Dolichospermum sp. 0.94–1.27 Oh et al. (1991)
Cyanobacteria Dolichospermum sp. 0.93 Lürling et al. (2013)
Cyanobacteria Dolichospermum sp. 0.4 Konopka and Brock (1978)
Cyanobacteria Dolichospermum sp. 1.25 Nalewajko and Murphy (2001)
Cyanobacteria Nodularia spumigena 0.14–0.16 Rakko and Seppäälä (2014)
Cyanobacteria Nodularia spumigena 0.2–0.6 Sommer et al. (2006)
Cyanobacteria Nodularia spumigena 0.13 Lehtimäki et al. (1997)
Table 6. Maximal growth rates (µ) of different phytoplankton groups.
Class Species µ Reference
Green algae Chlamydomonas reinhardtii 3.3–3.8 Hoogenhout and Amesz (1965)
Green algae Chlorella luteoviridis 0.56 Hoogenhout and Amesz (1965)
Green algae Chlorella strain 221 1.84 Reynolds (2006)
Green algae Eudorina unicocca 0.62 Reynolds and Rodgers (1983)
Green algae Scenedesmus sp. 1.35 Gotham and Rhee (1981)
Green algae Volvox aureus 0.46 Reynolds (2006)
Green algae Eight species 0.24–1.38 Lürling et al. (2013)
Dinoflagellates Ceratium furcoides 0.29 Butterwick et al. (2005)
Dinoflagellates Ceratium hirundinella 0.21 Reynolds (2006)
Diatoms Asterionella formosa 1.9–2.4 Hoogenhout and Amesz (1965)
Diatoms Asterionella formosa 1.78 Lund (1949)
Diatoms Asterionella formosa 1.78 Lund (1949)
Diatoms Asterionella formosa 0.67 Holm and Armstrong (1981)
Diatoms Chaetoceros gracilis > 3.1 Lund (1979)
Diatoms Cyclotella nana 1.6 Fuhs (1972)
Diatoms Cyclotella nana 3.4 Hoogenhout and Amesz (1965)
Diatoms Fragilaris crotonensis 0.90 Gotham and Rhee (1981)
Diatoms Fragilaris crotonensis 1.37 Reynolds (2006)
Diatoms Nitzschia actinastroides 1.5 Lund (1979)
Diatoms Skeletonema costatum 4.3 Hoogenhout and Amesz (1965)
Diatoms Staphanodiscus hantzschii 1.7 Hoogenhout and Amesz (1965)
Diatoms Thalassiosira fluviatilis 1.6 Fuhs (1972)
https://doi.org/10.5194/bg-18-2347-2021 Biogeosciences, 18, 2347–2378, 20212356 B. Munkes et al.: Cyanobacteria blooms in the Baltic
Table 7. Optimal temperature ranges for growth of different phytoplankton groups.
Class Species ◦C Reference
Cyanobacteria Aphanizomenon flos-aquae 18–22.5 Tang et al. (1997)
Cyanobacteria Aphanizomenon sp. 16–22 Lehtimäki et al. (1994)
Cyanobacteria Aphanizomenon sp. 25 Konopka and Brock (1978)
Cyanobacteria Aphanizomenon gracile 32.5 Lürling et al. (2013)
Cyanobacteria Dolichospermum sp. 18–35 Tang et al. (1997)
Cyanobacteria Dolichospermum sp. 25 Lürling et al. (2013)
Cyanobacteria Dolichospermum sp. 25 Konopka and Brock (1978)
Cyanobacteria Dolichospermum sp. 28–32 Nalewajko and Murphy (2001)
Cyanobacteria Nodularia sp. 20–25 Lehtimäki et al. (1994)
Cyanobacteria Nodularia sp. 25–30 Nordin et al. (1980)
Cyanobacteria Nodularia sp. 25–30 Lehtimäki et al. (1997)
Green algae Ankistrodesmus falcatus 32.5 Lürling et al. (2013)
Green algae Chlamydomonos reinhardtii 27.5 Lürling et al. (2013)
Green algae Desmodesmus bicellularis 35 Lürling et al. (2013)
Green algae Desmodesmus quadricauda 32.5 Lürling et al. (2013)
Green algae Monoraphidium minutum 27.5 Lürling et al. (2013)
Green algae Scenedesmus acuminatus 27.5 Lürling et al. (2013)
Dinoflagellates Ceratium furcoides 20 Butterwick et al. (2005)
Diatoms Chaetoceros socialis 18 Eppley (1977)
Diatoms Skeletonema costatum (3 studies) 16–30 Eppley (1977)
Diatoms Thalassiosira nordenskiolldii 11–14 Eppley (1977)
ity of phosphate is an essential precondition for cyanobac- replete conditions, not under high-P and low-N conditions.
teria growth. The models do, however, differ considerably So far there is no consensus on whether the concentrations
in terms of which P concentrations become limiting for the of P or N or the relationship of N : P favour dominance of
growth of cyanobacteria. The respective values for the half- cyanobacteria.
saturation constants envelope a large range from 0.05 to The minimum P requirements are species-dependent: Aph-
0.5 mmol P m−3 (cf. Table 3). Apart from the CEMBS model, anizomenon flos-aquae seems to have somewhat higher P
this range is comparable to phytoplankton in all of the mod- demands and literature values for the half-saturation con-
els investigated here. stant range from 1 to 2.5 mmol P m−3 (Degerholm et al.,
Similar to this, laboratory experiments also show a huge 2006; Gotham and Rhee, 1981; Healey et al., 1973). Olof-
range for the half-saturation constant. Table 8 shows that sson et al. (2016) report that in the Baltic Sea P concen-
cyanobacteria can keep up with dinoflagellates and some trations of 0.04 mmol P m−3 can limit Nodularia spumigena
green algae for P. Some cyanobacteria species have been growth. Degerholm et al. (2006) indicate half-saturation con-
shown to feature a very high affinity for the uptake of P be- stants of 1–1.7 mmol P m−3 for Nodularia spumigena (Ta-
cause they are able to rapidly increase their P uptake rate by ble 8). For comparison, e.g. Reynolds (2006) reports much
upregulating two high-affinity P-binding proteins and phos- higher values up to 5.24 mmol P m−3 for some green algae,
phatase (Cottingham et al., 2015; Gobler et al., 2016). Ad- while the investigated diatoms seem to have rather low P de-
ditional adjustments to low P conditions include a reduction mands. The listed half-saturation constants for diatoms in
of their overall P requirements by substituting P-containing Table 8 range from 0.12 to 1.72 mmol P m−3 (Fuhs, 1972;
lipids with alternatives. There is also evidence that cyanobac- Lund, 1979; Holm and Armstrong, 1981; Yamamoto et al.,
teria have relative low P requirements (Kononen and Leppä- 2012).
nen, 1997; Degerholm et al., 2006). Even so, Moisander et An interpretation of these studies is complicated by the
al. (2007) show in field and laboratory experiments that P ad- ability of cyanobacteria to access dissolved organic phospho-
dition typically stimulates growth and nitrogen-fixation rates rus (DOP) besides DIP. Phosphate (PO−3 4 ) is the dominant
of Aphanizomenon sp. and Nodularia spumigena, which sug- form of DIP in natural waters and directly bioavailable for
gests that the availability of P is limiting in the Baltic Sea plants. In contrast, DOP is an integral part of the marine or-
(despite the low P requirements). In this context Anders- ganic matter pool. DOP exists in a variety of forms which
son et al. (2015a) found that Nostocales were dominating result from death and autolysis of organisms, decomposition,
the cyanobacteria community under high total P and were and excretion. Phosphorus esters (75 %) and phosphonates
negatively related to total N. Paerl and Otten (2016) show (25 %) are the two dominant forms of oceanic DOP (Clark
that N2 -fixing cyanobacteria dominate more often under N- et al., 1998). Not all phytoplankton possess alkaline phos-
Biogeosciences, 18, 2347–2378, 2021 https://doi.org/10.5194/bg-18-2347-2021B. Munkes et al.: Cyanobacteria blooms in the Baltic 2357
Table 8. Half-saturation constant for phosphate (KP ) for different phytoplankton groups.
Phylum Species KP Reference
(mmol P m−3 )
Cyanobacteria Aphanizomenon flos-aquae1, 2, a 1.13 Gotham and Rhee (1981)
Cyanobacteria Aphanizomenon flos-aquae1, 2, a 2.5 Degerholm et al. (2006)
Cyanobacteria Anabaena variabilis1, 2, a 1–2 Healey et al. (1973)
Cyanobacteria Dolichospermum sp.1, a 1.8–2.5 Reynolds (2006)
Cyanobacteria Microcystis aeruginosa1, a 1.23 Holm and Armstrong (1981)
Cyanobacteria Microcystis sp.1, a 2.11 Gotham and Rhee (1981)
Cyanobacteria Nodularia spumigena2, a 1.0–1.7 Degerholm et al. (2006)
Green algae Chlorella pyrenoidosa1, 2, b 0.68 Nyholm (1977)
Green algae Scenedesmus sp.1, 2, c 0.57/3.4 Gotham and Rhee (1981)
Green algae Volvox aureus4, c 5.24 Reynolds (2006)
Dinoflagellates Alexandrium tamarense3, 4, b, c 2.6 Yamamoto et al. (2012)
Dinoflagellates Gymnodinium catenatum4, a, b 3.4 Yamamoto et al. (2012)
Dinoflagellates Peridinium sp.2-4, b 0.11 Reynolds (2006)
Dinoflagellates Pyrocystis noctiluca3, 4, b 2.1 Rivkin and Swift (1982)
Diatoms Asterionella formosa1, c 0.70 Holm and Armstrong (1981)
Diatoms Chaetoceros gracilis1, a, b 0.12 Lund (1979)
Diatoms Cyclotella nana1, 2, a, c 0.58 Fuhs (1972)
Diatoms Nitzschia actinastroides1, c 0.013 Lund (1979)
Diatoms Skeletonema costatum1, 2, a 0.68 Yamamoto et al. (2012)
Diatoms Thalassiosira fluviatilis3, 4, b 1.72 Fuhs (1972)
Please note that different size classes of algae are indicated by numbers (1 tiny; 2 small; 3 medium; 4 large) and by letter (a chains;
b single; c other).
phatase and can use DOP. From those that can use DOP, the et al. (2006) assumed that Nodularia spumigena’s high up-
efficiency of using DOP differs. While e.g. dinoflagellates take ability for DOP enables Nodularia spumigena to toler-
grow well under a variety of DOP compounds, diatoms show ate DIP limitation during summer months. Studies of O’Neil
a much lower and more restricted DOP utilization (Wang et et al. (2012) and Vahtera et al. (2007b) support the finding
al., 2011). By being able to use a variety of DOP compounds, of Degerholm et al. (2006). Schoffelen et al. (2018) inves-
cyanobacteria have a considerable advantage over other phy- tigate single-cell P-uptake rates with nanoSIM (nanometre-
toplankton species, which are restricted to DIP or phosphorus scale secondary ion mass spectrometry). Their measurements
esters (Degerholm et al., 2006; Dyhrman et al., 2006; Sohm show that Aphanizomenon sp. acquired only 15 % of its P
and Capone, 2006; Paerl, 2014). Phytoplankton that is able to demand from DIP and used instead about 85 % from DOP.
use DOP most commonly uses alkaline phosphatase (AP) to However, there are also conflicting results: in Vahtera et al.
hydrolyse phosphorus esters (Lin et al., 2012, 2016). Some (2007b) experiments Aphanizomenon sp. was not able to use
phytoplankton species also have the potential to utilize phos- DOP. Also, in Schoffelen et al. (2018) Nodularia spumi-
phonates of the DOP compounds, which are harder to extract genas almost exclusively used DIP for its growth even at
for P (Dyhrman et al., 2006). This has been shown for many very low phosphate concentrations, while Dolichospermum
cyanobacteria species. They are able to access the more re- sp. showed an intermediate behaviour. Note in this context
fractory phosphonates as well as the semilabile phosphorus that models generally do not consider DOP to be an addi-
esters (Sohm et al., 2008; Orchard et al., 2010; Orcutt et al., tional prognostic variable.
2013; Whitton et al., 1991; Dyhrman et al., 2006; O’Neil et Another factor, which is rarely considered in models (an
al., 2012). exception is BALTSEM), is the storage capacity of DIP by
In accordance with this, various studies support an effi- cyanobacteria. It is well known that some cyanobacteria are
cient use of DOP by cyanobacteria species of the Baltic Sea. able to drastically increase their intracellular P concentra-
Degerholm et al. (2006) show with their experimental work tion (Nausch et al., 2008; Walve and Larsson, 2007, 2010;
that under limitation of DIP Dolichospermum sp. as well Sohm et al., 2011) and to store excess DIP. For the Baltic
as Nodularia spumigena increase their alkaline phosphatase Sea this has been shown for Aphanizomenon sp. (Larsson et
(APase) activity. This indicates that these two cyanobacte- al., 2001). In May, after the spring bloom, Aphanizomenon
ria species are able to use DOP for their growth. Degerholm sp. showed C : P ratios around 50 (Redfield, 1958, C : P =
https://doi.org/10.5194/bg-18-2347-2021 Biogeosciences, 18, 2347–2378, 20212358 B. Munkes et al.: Cyanobacteria blooms in the Baltic
106 : 1). Nausch et al. (2009) even measured a C : P ratio of low temperature, and low salinity (10 µmol photons m−2 s−1 ,
32 after an upwelling event. However, Larsson et al. (2001) 15◦ , and 8 PSU) (Śliwińska-Wilczewska et al., 2019). Simi-
observed that during the subsequent build-up of biomass, P larly to this, DeNobel et al. (1998) found that for Aphani-
is used for growth and cellular P concentrations are decreas- zomenon flos-aquae and Anabaena sp. their alpha increased
ing (C : P ratios around 400). Larsson et al. (2001) conclude with decreasing irradiance but was always higher for Apha-
that the growth rate of Aphanizomenon sp. is limited by DIP nizomenon flos-aquae than for Anabaena sp. This was due
availability in the Baltic Sea. Also, Raateoja et al. (2011) to a higher chlorophyll a content in cells of Aphanizomenon
and Wasmund et al. (2005) share the opinion that, despite flos-aquae than in Anabaena sp.
their DIP storage capacity, additional P sources are needed to The differences between species in terms of their optimal
sustain today’s observed cyanobacterial blooms in the Baltic light requirements are substantial. In the following we sum-
Sea. marize studies sorted by species. Table 9 refers to the indi-
vidual studies.
3.1.4 Light limitation
– For Aphanizomenon flos-aquae optimal irradiance for
photosynthesis is reported to be 6− > 33 W m−2 in
Cyanobacterial and algal photosynthesis rates are signif-
laboratory and field experiments (Lehtimäki et al.,
icantly influenced i.a. by the combination of light inten-
1997; Üveges et al., 2012). Photo-inhibition for Aph-
sity and temperature (Butterwick et al., 2005). With in-
anizomenon flos-aquae was reported at a light intensity
creasing light intensity photosynthesis rate will increase un-
of 99 W m−2 (Pechar et al., 1987).
til the saturation level is achieved (Ik) and the maximal
photosynthesis rate (Pmax ) is reached. The initial slope of – According to Eigemann et al. (2018) and Walsby and
this photosynthesis–irradiance curve (alpha) describes the Booker (1980), Dolichospermum sp. prefers rather low
performance of both light-harvesting and photosynthetic irradiance values of 4–8 W m−2 .
conversion efficiency. Alpha is species-specific and rather
temperature-independent over a wide range. Alpha is, how- – Several scientists tested the optimal light intensity for
ever, a strong function of the highly variable carbon-specific Nodularia spumigena. They state that Nodularia spumi-
chlorophyll a content of cells owing to the central role of gena grows best at the highest light level tested (23–
chlorophyll in photosynthesis. 66 W m−2 ). Net growth was reported over a wide range
Pmax , on the other hand, will be influenced i.a. by tem- of light intensities 5–114 W m−2 in laboratory experi-
perature. Below the temperature optima, Pmax increases non- ments (Eigemann et al., 2018; Jodlowska and Latala,
linearly, roughly doubling with each 10 ◦ C rise in temper- 2019; Lehtimäki et al., 1997; Nordin et al., 1980;
ature until a threshold temperature (Reynolds, 2006). Be- Roleda et al., 2008). Nordin et al. (1980) observe that
yond the threshold excessive temperatures in combination very high temperatures (35 ◦ C) in combination with
with prolonged exposure to high light intensities may cause high light levels (114 W m−2 ) can prohibit the growth
photo-inhibition and induce harmful effects in algae (Ibel- of Nodularia spumigena. Consistently, Jodlowska and
ings, 1996). Photo-inhibition also occurs when phytoplank- Latala (2019) report reduced filament concentrations
ton is shifted to irradiance substantially above those to which and reduced photosynthesis rates at a combination of
they have been acclimatized. Cyanobacteria, however, can high light intensities and high temperatures (30 ◦ C). It
modify their photosynthetic apparatus within minutes to ac- is noteworthy that Jodlowska and Latala (2019) did not
commodate rapid fluctuations in light intensity or quality. find any photo-inhibition of Nodularia spumigena until
This basic concept that algal growth is influenced by light 153 W m−2 .
and temperature is captured by all the models considered
here – although it comes in different flavours: ECOSMO and 3.1.5 Buoyancy
CEMBS assume that the light requirement for cyanobacte-
ria is higher than for other functional groups, while the other Many cyanobacteria possess buoyancy-regulation mecha-
models do not distinguish between functional groups here nisms, which enables them to actively control their position
(cf. Sect. 2.2). in the water column (Visser et al., 2016). Accordingly, the
The species Nodularia spumigena and Aphanizomenon ERGOM and ECOSMO models assume that cyanobacteria
sp. seem to be well acclimated to relatively high PAR lev- are buoyant, while the SCOBI model applies a lower sinking
els, especially at high temperatures (Śliwińska-Wilczewska speed for cyanobacteria than for other phytoplankton. All re-
et al., 2019). Their cell-specific Pmax values were the high- spective velocities are of the order of centimetres per day and
est in Nodularia spumigena and Aphanizomenon sp. strains do not change with light intensity or nutrient availability (Ta-
grown under the lowest light intensity. Both species changed ble 3).
their chlorophyll a-specific alpha depending on environ- In nature, buoyancy control is rather complex. Three con-
mental conditions. Maximum alpha values for Nodularia trol mechanisms that regulate buoyancy internally have been
spumigena and Aphanizomenon sp. were found at low light, identified: (1) the organisms can modify the rate of gas
Biogeosciences, 18, 2347–2378, 2021 https://doi.org/10.5194/bg-18-2347-2021You can also read