Journal of Volcanology and Geothermal Research - EODG
←
→
Page content transcription
If your browser does not render page correctly, please read the page content below
Journal of Volcanology and Geothermal Research 417 (2021) 107295

                                                                    Contents lists available at ScienceDirect

                                      Journal of Volcanology and Geothermal Research

                                                 journal homepage: www.elsevier.com/locate/jvolgeores

Invited Research Article

The Independent Volcanic Eruption Source Parameter Archive (IVESPA,
version 1.0): A new observational database to support explosive eruptive
column model validation and development
Thomas J. Aubry a,b,⁎, Samantha Engwell c, Costanza Bonadonna d, Guillaume Carazzo e, Simona Scollo f,
Alexa R. Van Eaton g, Isabelle A. Taylor h, David Jessop e,i,j, Julia Eychenne j, Mathieu Gouhier j, Larry G. Mastin g,
Kristi L. Wallace k, Sébastien Biass l, Marcus Bursik m, Roy G. Grainger h, A. Mark Jellinek n, Anja Schmidt a,o
a
  Department of Geography, University of Cambridge, Cambridge, UK
b
   Sidney Sussex College, Cambridge, UK
c
  British Geological Survey, The Lyell Centre, Edinburgh, UK
d
   Department of Earth Sciences, University of Geneva, Geneva, Switzerland
e
   Université de Paris, Institut de Physique du Globe de Paris, CNRS, F-75005 Paris, France
f
  Istituto Nazionale di Geofisica e Vulcanologia, Osservatorio Etneo, Catania, Italy
g
   U.S. Geological Survey, Cascades Volcano Observatory, Vancouver, Washington, USA
h
   COMET, Atmospheric, Oceanic and Planetary Physics, University of Oxford, Oxford OX1 3PU, UK
i
  Observatoire Volcanologique et Sismologique de Guadeloupe, Institut de Physique du Globe de Paris, F- 97113 Gourbeyre, France
j
  Université Clermont Auvergne, CNRS, IRD, OPGC Laboratoire Magmas et Volcans, F-63000 Clermont-Ferrand, France
k
   U.S. Geological Survey, Alaska Volcano Observatory, 4230 University Dr., Anchorage, AK 99508, United States of America
l
  Earth Observatory of Singapore, Nanyang Technological University, 639798, Singapore
m
    Department of Geology, University at Buffalo, Buffalo, New York 14260, USA
n
   Earth Ocean and Atmospheric Sciences, University of British Columbia, Vancouver, Canada
o
   Department of Chemistry, University of Cambridge, Cambridge, UK

a r t i c l e          i n f o                             a b s t r a c t

Article history:                                           Eruptive column models are powerful tools for investigating the transport of volcanic gas and ash, reconstructing
Received 30 October 2020                                   past explosive eruptions, and simulating future hazards. However, the evaluation of these models is challenging
Received in revised form 14 May 2021                       as it requires independent estimates of the main model inputs (e.g. mass eruption rate) and outputs (e.g. column
Accepted 19 May 2021
                                                           height). There exists no database of independently estimated eruption source parameters (ESPs) that is exten-
Available online 25 May 2021
                                                           sive, standardized, maintained, and consensus-based. This paper introduces the Independent Volcanic Eruption
                                                           Source Parameter Archive (IVESPA, ivespa.co.uk), a community effort endorsed by the International Association
                                                           of Volcanology and Chemistry of the Earth’s Interior (IAVCEI) Commission on Tephra Hazard Modelling. We com-
                                                           piled data for 134 explosive eruptive events, spanning the 1902-2016 period, with independent estimates of:
                                                           i) total erupted mass of fall deposits; ii) duration; iii) eruption column height; and iv) atmospheric conditions.
                                                           Crucially, we distinguish plume top versus umbrella spreading height, and the height of ash versus sulphur diox-
                                                           ide injection. All parameter values provided have been vetted independently by at least two experts. Uncer-
                                                           tainties are quantified systematically, including flags to describe the degree of interpretation of the literature
                                                           required for each estimate. IVESPA also includes a range of additional parameters such as total grain size distri-
                                                           bution, eruption style, morphology of the plume (weak versus strong), and mass contribution from pyroclastic
                                                           density currents, where available. We discuss the future developments and potential applications of IVESPA
                                                           and make recommendations for reporting ESPs to maximize their usability across different applications.
                                                           IVESPA covers an unprecedented range of ESPs and can therefore be used to evaluate and develop eruptive col-
                                                           umn models across a wide range of conditions using a standardized dataset.
                                                                  © 2021 The Authors. Published by Elsevier B.V. This is an open access article under the CC BY license (http://
                                                                                                                                       creativecommons.org/licenses/by/4.0/).

  ⁎ Corresponding author at: Department of Geography, University of Cambridge,
Cambridge, UK.
    E-mail address: ta460@cam.ac.uk (T.J. Aubry).

https://doi.org/10.1016/j.jvolgeores.2021.107295
0377-0273/© 2021 The Authors. Published by Elsevier B.V. This is an open access article under the CC BY license (http://creativecommons.org/licenses/by/4.0/).
T.J. Aubry, S. Engwell, C. Bonadonna et al.                                                                           Journal of Volcanology and Geothermal Research 417 (2021) 107295

1. Introduction                                                                                 large data scatter (e.g. Mastin et al., 2009; Mastin, 2014). They remain
                                                                                                limited compared to 1D and 3D ECMs, which can account for the impact
1.1. Eruptive column models: key tools for linking eruption source parame-                      of vertically-resolved atmospheric conditions on plume dynamics as
ters and characterizing explosive volcanic plume dynamics                                       well as other parameters such as TGSD. As well as being able to link
                                                                                                MER to column height, these ECMs can also make additional predictions
    Numerical models of volcanic columns or plumes, referred to as                              (depending on their complexity), such as the conditions under which a
eruptive column models (ECMs) hereafter, are fundamental to the                                 volcanic column will collapse, the evolution of plume properties with
understanding of explosive eruption dynamics, characterizing the rela-                          height, and the distribution of ash versus gas in the volcanic column.
tionship between a variety of eruption source parameters (ESPs) and, in
turn, our ability to assess and manage hazards from explosive volcanic                          1.2. Overview of datasets available for the evaluation and development of
eruptions. ECMs have a range of complexity, from three-dimensional                              eruptive column models
(3D) ECMs that can resolve the large-scale turbulent structure of a vol-
canic column but are computationally expensive, to one-dimensional                                  A requirement of datasets produced for validation of ECMs is that the
(1D) integral ECMs that parameterize the turbulent entrainment of am-                           ESPs serving as inputs and outputs to ECMs are constrained indepen-
bient air into the column and are inexpensive to run (Costa et al.,                             dently, and without reliance on any eruptive column modelling. Inde-
2016a). The simplest form of model consists of theoretical (e.g.                                pendent observations of the MER and column height are essential
Morton et al., 1956; Sparks, 1986; Wilson and Walker, 1987) or empir-                           minimal requirements to constrain scaling relationships (0D) between
ical (e.g. Settle, 1978; Wilson et al., 1978; Sparks et al., 1997a; Mastin                      these two parameters, which are also required to evaluate more sophis-
et al., 2009) relationships linking the mass eruption rate (MER), and                           ticated (1D, 3D) ECMs. However, gathering independent constraints on
the column height. These scaling relationships, sometimes referred to                           MER and height is challenging. Estimates of column height before the
as 0th order relationships or 0D ECMs, have become popular tools due                            beginning of the satellite era (late 1970’s/early 1980’s) are, for example,
to their simplicity.                                                                            sparse. MER can be estimated from field studies of deposits by dividing
    The value of ECMs has become apparent during the 21st century due                           the erupted mass (derived from the measured volume using an appro-
to an increased use of volcanic ash transport and dispersion models                             priate bulk deposit density) by the eruption duration. However, volume
(VATDMs) to forecast the dispersion of ash clouds in the atmosphere                             estimates exist for only a relatively small fraction of eruptions in the
and ash deposition on the ground. VATDMs have proved crucial for                                geological record and timing information can be difficult to constrain.
mitigating hazards to civil aviation (e.g. Heffter and Stunder, 1993;                           Table 1 lists some of those datasets with independent MER and plume
D’Amours, 1994; Versteegeri et al., 1995; Stohl et al., 1998; Draxler                           height estimates available, as well as their main features. The number
and Hess, 1998; Searcy et al., 1998) and hazard-sensitive land use plan-                        of events (i.e. eruption or eruption phases for which ESP are
ning (e.g. Barberi et al., 1990a). VATDMs require an estimate of plume                          constrained) in these datasets has generally increased as new data be-
height, generally constrained using satellite or ground-based observa-                          came available (e.g. Sparks et al., 1997b; Mastin et al., 2009), aided by
tions, and an estimate of either total airborne mass of ash or the rate                         improvements in observations with time. For example, for column
at which ash is injected into the atmosphere, commonly assumed to                               height, the use of satellite observations has become much more system-
be a fraction of the MER (Gouhier et al., 2019). MER is generally esti-                         atic, and community efforts such as the International Association of Vol-
mated from the eruption column height using the 0D ECM between                                  canology and Chemistry of the Earth's Interior (IAVCEI) Remote Sensing
MER and column height. Increasingly, 1D ECMs are being coupled                                  Commission (https://sites.google.com/site/iavceirscweb/Home) have
with VATDMs used in operational response to forecast ash dispersion                             greatly improved the availability and communication of satellite obser-
(e.g. Bursik et al., 2012).                                                                     vations of volcanic columns.
    The last two decades have also seen an increased recognition that                               In the wake of eruptions such as that of Eyjafjallajökull (2010,
the relation between MER and plume height is complicated by a variety                           Iceland), the following decade saw an increased recognition of the key
of factors, such as atmospheric wind velocity, the plume water content,                         role played by atmospheric conditions in column dynamics. A greater
and ash aggregation and the total grain size distribution (TGSD), among                         number of plume height scaling (0D) models began accounting for
other factors (e.g. Degruyter and Bonadonna, 2012; Girault et al., 2014).                       vertically-averaged atmospheric conditions (e.g. Aubry et al., 2017a
0D models, linking plume height to the MER, will thus always result in a                        and references therein). 1D ECMs also included vertical profiles of

Table 1
Overview of the key features of the main existing datasets with independent estimates of the MER (or erupted and duration) and plume height. “-“ and “✓” symbols mean that the feature
is not and is incorporated, respectively.

  Reference or dataset        Number of eruptive    Strictly        Atmospheric       Total grain size        Uncer- Community-wide           Online, open access     VATDM
  name                        events                indepen-        data2             distribution            tainties effort                 dataset                 parameters3
                                                    dent ESPs1

  Wilson et al. (1978)        8                     ✓               -                 -                       -         -                     -                       -
  Carey and Sigurdsson        45                    -               -                 -                       -         -                     -                       -
    (1989)
  Sparks et al. (1997b)       26                    ✓               -                 -                       -         -                     -                       -
  IAVCEI THM dataset          9                     -               ✓                 ✓                       -         ✓                     ✓                       ✓
    (2001)
  Mastin et al. (2009)        35                    -               -                 -                       -         ✓                     -                       -
  Mastin et al. (2013a)       5                     -               ✓                 ✓                       -         ✓                     ✓                       ✓
  Mastin (2014)               25                    -               ✓                 -                       -         -                     -                       -
  Girault et al. (2014)       10                    -               -                 ✓                       -         -                     -                       -
  Aubry et al. (2017a)        94                    ✓               ✓                 -                       ✓         -                     -                       -
  IVESPA v1.0 (this           134                   ✓               ✓                 ✓                       ✓         ✓                     ✓                       -
    study)
1
 Column height and MER were derived from independent methods for the full dataset. For example, erupted mass could not be inverted from column height using an ECM and height could not be
inverted from isopleth data. 2Atmospheric data means the dataset provides vertical atmospheric profiles of wind, temperature and humidity. 3Also include parameters required for evaluating
VATDMs, such as spatially-resolved deposit information.

                                                                                            2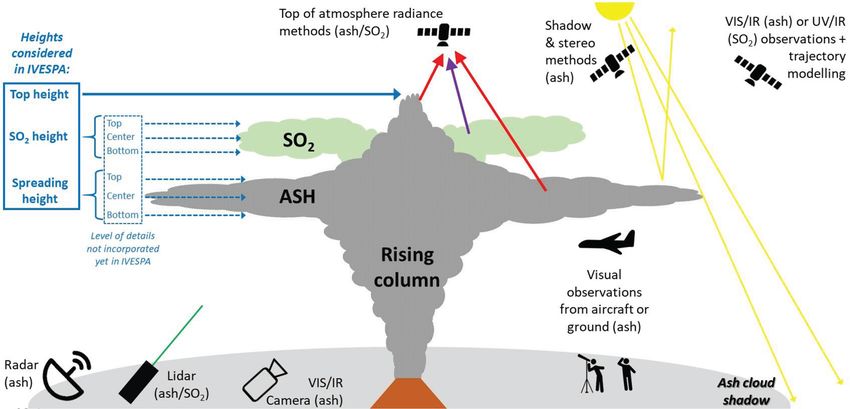
T.J. Aubry, S. Engwell, C. Bonadonna et al.                                                           Journal of Volcanology and Geothermal Research 417 (2021) 107295

atmospheric properties (e.g. Costa et al., 2016a and references therein).             independent from each other and independent from plume model-
As a consequence, ESP datasets which previously focused on gathering                  ling constraints.
only independent estimates of MER and height plume have evolved to
                                                                                   2. Include other ESPs when they are available, including TGSD which is
also compile atmospheric conditions including Mastin, 2014 and
                                                                                      required as input to some 1D and 3D ECMs.
Aubry et al., 2017a. More sophisticated 1D ECMs (e.g. Girault et al.,
                                                                                   3. Include uncertainties for each parameter.
2014) as well as most 3D ECMs account for the role of particle size
                                                                                   4. Establish a robust and transparent quality control of the data
(e.g. Cerminara et al., 2016) and sometimes particle aggregation (Van
                                                                                      provided.
Eaton et al., 2015), thus also requiring TGSD as input. To date, only
                                                                                   5. Provide an online database that is easily accessible, updatable, con-
one dataset aimed at evaluating ECMs contains independent estimates
                                                                                      sistently maintained, and open to the community (ivespa.co.uk).
of MER, plume height, and TGSD (Girault et al., 2014), but atmospheric
conditions provided with this dataset are highly simplified. A few                      IVESPA is the result of a collaboration between multiple research
datasets have been developed for VATDM evaluation and contain all                  centers, geological surveys, and volcano observatories, and builds on de-
ESPs required for evaluation of ECMs, including TGSD and atmospheric               cades of efforts in compiling observational datasets. It has been en-
conditions. However, the additional parameters required for VATDM                  dorsed by the IAVCEI THM Commission and is supported by the Global
evaluation (e.g. spatially resolved information on the deposit) mean               Volcano Model and the British Geological Survey, which hosts the data-
these datasets only provide ESPs for a handful of events - five in the              base website (ivespa.co.uk). In the present contribution, we introduce
case of Mastin et al. (2013a), and nine in the IAVCEI Commission on                the methodology used to create this first version (v1.0) of IVESPA,
Tephra Hazard Modelling’s (THM) original ESP dataset (https://thm.                 then provide an overview of the data collected and used. We investigate
iavceivolcano.org/repository/datasets.html). These datasets do not in-             in detail the uncertainties in the information collected, which is an
clude many other parameters that are required by 1D and 3D models,                 important distinction of this new dataset. We use insights gained
for example eruptive temperature, water mass fraction and exit veloc-              while gathering ESP information from the published record to provide
ity, which are difficult to retrieve in real-time.                                  suggestions on making field data more useful for numerical modelling
                                                                                   purposes. Finally, we discuss future development and applications
1.3. Motivation for the Independent Volcanic Eruption Source Parameter             of IVESPA.
Archive (IVESPA)
                                                                                   2. Methodology
    Despite the increase in available ESP datasets, we still lack a stan-
dardized reference dataset to specifically evaluate and develop ECMs,                   In this section, we first give a general overview of the methodologies
from simple 0D models to sophisticated 3D models. Existing datasets                followed in the selection of events to populate the database and the pre-
aimed at ECM evaluation, including those of Mastin et al. (2009);                  sentation of information on their ESPs (section 2.1). Following this gen-
Girault et al. (2014); Mastin (2014) and Aubry et al. (2017a), do not in-          eral description, we provide definitions, and detail the challenges and
clude all of the following parameters (Table 1): MER, column height, at-           specificities of the data collection for each ESP (section 2.2).
mospheric conditions, and TGSD. Most of these datasets also contain a
relatively small number of events compared to those available in the               2.1. Methodology
wider literature (e.g. Mastin, 2014; Girault et al., 2014). Furthermore,
they represent the work of only a handful of researchers (e.g. Girault             2.1.1. Condition of entry for IVESPA events
et al., 2014; Aubry et al., 2017a) rather than harnessing a broader                    One of our main aims is to provide a database supporting model as-
community-wide consensus. Critically, despite the very large uncer-                sessment in the case of explosive volcanic eruptions that generate a
tainties associated with ESPs, only one dataset (Aubry et al., 2017a)              buoyant eruptive column or plume, originating from a vent. As a conse-
has attempted to quantify uncertainties in a systematic manner                     quence, pure collapse events that only produce pyroclastic density cur-
(Table 1). ESP datasets are rarely made available in online websites,              rents (PDCs), and resulting co-PDC plumes were not considered for
like the IAVCEI THM commission database (http://www2.ct.ingv.it/                   version 1.0 of IVESPA despite proving valuable in testing ECMs, and in
iavcei/index.htm or https://thm.iavceivolcano.org/repository/datasets.             particular their ability to capture the transition from a stable eruptive
html), and even more rarely maintained. Constructing open-access                   column to a collapsing one (e.g. Degruyter and Bonadonna, 2013;
datasets is also challenging because it relies on the willingness of the au-       Jessop et al., 2016; Aubry and Jellinek, 2018; Koyaguchi et al., 2018;
thors to openly share their data. Scientists commonly use these datasets           Koyaguchi and Suzuki, 2018; Michaud-Dubuy et al., 2018; 2020). We
without acknowledging the effort involved in its compilation. A data               collect all parameters that represent independently estimated inputs
policy for the use of data is, therefore, required.                                and outputs to ECMs, and all parameters gathered must have been esti-
    Illustrating the potential value of a robust validation dataset, the           mated without the use of any ECMs.
eruptive column model intercomparison project (Costa et al., 2016a;                    The key input that ECMs require is the MER, whose time-averaged
Suzuki et al., 2016) examined output from 0D, 1D and 3D ECMs, but                  value can be determined from the total erupted mass of tephra-fallout
did not directly test model performance against observations. This                 (TEM) and the duration of the eruption. The TEM is often derived by in-
study was the first of its kind for ECMs, and the primary objective was             tegrating isomass or isopach maps (see section 2.2.1). Other methods to
to understand key differences between numerical parameterisations.                 estimate the MER or TEM exist, but the vast majority result from
However, such evaluation is a gold standard of intercomparison projects            inverting observations, such as the column height, using a scaling rela-
in other scientific communities (e.g. Coupled Model Intercomparison                 tionship or a more sophisticated ECM, and can thus not be used for
Project in climate science, Eyring et al., 2016a, 2019). Developing a ref-         the purpose of testing and informing these same models. A few methods
erence observational dataset for ECM evaluation constitutes a first step            are independent from the application of ECMs but remain rarely applied
towards reaching this goal.                                                        and are very different in nature from TEM estimates based on field de-
    To address these challenges, we have created the Independent Vol-              posits, e.g. methods based on the umbrella cloud growth rates (e.g.
canic Eruption Source Parameter Archive (IVESPA). The primary objec-               Costa et al., 2013a; Pouget et al., 2013; 2016a; Hargie et al., 2019) or
tive of IVESPA is to foster the evaluation and development of ECMs                 radar measurements (e.g. Gouhier and Donnadieu, 2008; Marzano
(0D, 1D, 3D), and it has been developed with five main specifications:               et al., 2016, 2019; Ripepe et al., 2013; Freret-Lorgeril et al., 2018). The
                                                                                   validation or calibration of these methods also sometimes rely on
1. Provide an exhaustive compilation of eruptive events with published             ECMs (e.g. Freret-Lorgeril et al., 2018). For simplicity and consistency,
   estimates of MER, plume height, and atmospheric conditions that are             we thus restrict version 1.0 of IVESPA to eruptive events for which

                                                                               3
T.J. Aubry, S. Engwell, C. Bonadonna et al.                                                              Journal of Volcanology and Geothermal Research 417 (2021) 107295

both a deposit-derived TEM estimate and a duration estimate were                  Table 2
available in the literature.                                                      List of the different types of sources used in compiling ESPs for IVESPA.

    In addition to the MER, the vast majority of plume models now                   General type                    Journal name or type                           Count
require atmospheric conditions (density profiles, wind speed and direc-              Peer-reviewed journal           Journal of Volcanology and Geothermal          73
tion) from ground level up to the height reached by the plume as inputs.              article in English (total =   Research
While direct observations of atmospheric conditions near the eruptive                 225)                          Bulletin of Volcanology                        39
vent are not systematically available, even for relatively recent events,                                           Journal of Geophysical Research: Solid Earth   17
                                                                                                                    Geophysical Research Letters                   9
the development of multiple climate reanalysis (section 2.2.4) means
                                                                                                                    Journal of Geophysical Research:               9
that model estimates of atmospheric conditions derived from observa-                                                Atmospheres
tions from at least 1979 and in some cases as far back as 1600-1900                                                 Earth and Planetary Science Letters            6
are commonly available. To guarantee that atmospheric data from at                                                  Atmospheric Chemistry and Physics              5
least two different reanalyses using a relatively dense array of observa-                                           Earth, Planets and Space                       5
                                                                                                                    Geochemistry, Geophysics, Geosystems           5
tions were available, we only consider volcanic events that occurred                                                Journal of Volcanology and Seismology          5
since 1900 or later for this first version of the database. Last, we require                                         Science                                        5
all events of IVESPA to have at least one type of measurement of the                                                Other journals (32)                            47
eruptive column height and allowed for three different types defined                 Other sources (total = 115)     Global Volcanism Program                       58
                                                                                                                    Geological Survey or Meteorological Office      23
as in section 2.2.3.
                                                                                                                    reports or communications (USGS=15)
    To summarize, we impose the following conditions for any eruptive                                               Conference abstracts or articles               13
event to be included in IVESPA:                                                                                     Books                                          7
                                                                                                                    Personal communications                        7
1. An estimate of the TEM derived from the tephra deposit is available.                                             PhD/MSc thesis                                 3
2. An estimate of the duration is available.                                                                        Other                                          4

3. An estimate of at least one of the three types of eruption column
   height considered (see section 2.2.3) is available.                            dominant such as Journal of Volcanology Geothermal Research (73),
4. The event occurred in 1900 or later, guaranteeing the availability of          and a total of 43 different journals spanning the period 1949 to the
   estimates of atmospheric conditions from well-constrained climate              present day. Other types of sources used include online reports (par-
   reanalyses.                                                                    ticularly the GVP, which alone was referenced for 58 separate
5. All above estimates must be independent of any ECMs.                           events); books (7 entries in the database); student theses (3 en-
6. All above estimates must be independent of each other.                         tries); reports from volcano observatories, meteorological offices
    We refer to the first three parameters listed above (TEM, dura-                and national geological surveys (e.g. USGS reports, 15 entries);
tion, eruptive column height) as basic “key” ESPs, as together they               personal communications reporting direct (i.e. field) or indirect
enable constraint of the input (MER, obtained from TEM and dura-                  measurements (e.g. analysis of satellite data) (7 entries); and non-
tion) and output (height) common to all ECMs (0D, 1D, 3D). We                     reviewed scientific publications such as technical reports and
refer to any sequence of an eruption fulfilling the list of above criteria         conference proceedings (13). The full reference list is available in
as an “event”. A specific volcanic eruption may thus contribute sev-               Appendix A and on the online database website (ivespa.co.uk).
eral “events” to the database if distinct estimates of key ESPs exist
for each event. Last, we made a number of exceptions to the sixth                 2.1.3. Best estimate, uncertainty, and interpretation flags
criteria listed above:                                                                ESP estimates are commonly subject to large uncertainties and
                                                                                  are used to initiate and test numerical models which themselves
• Column heights obtained from satellite-measured brightness temper-              are limited by uncertainties (e.g. understanding of the underlying
  ature and an atmospheric temperature profile (inducing a depen-                  process) propagating uncertainties further. Yet, ESP uncertainties
  dence between the plume height and atmospheric conditions) can                  are not systematically rigorously documented in the literature and
  be used.                                                                        are even less commonly reported in ESP datasets (Table 1). To
• Column heights obtained from the inversion of the ash or sulphur di-            make progress, in addition to providing a best estimate for all nu-
  oxide (SO2) dispersion patterns and wind field using a trajectory                merical parameters, we also provide an uncertainty for all relevant
  model (inducing a dependence between the column height and atmo-                parameters of the database. In general, the uncertainties provided
  spheric conditions) can be used.                                                in IVESPA are meant to be representative of a high confidence
• Eruption chronologies established on the basis of shifts in wind direc-         level, calculated as a 95% confidence interval when the available
  tion and differences in tephra layer dispersal direction (inducing a de-        data enables it. We provide a single value for uncertainty, with the
  pendence between the duration and atmospheric conditions above                  underlying assumption that uncertainty is symmetric around the
  vent) can be used.                                                              best estimate value provided. The only exception is for TEM for
• Event duration constrained using observations of the volcanic plume             which we decided to provide both a lower and upper bound uncer-
  (inducing a dependence between duration and column height) can                  tainty because studies which have rigorously quantified uncertainty
  be used.                                                                        on this parameter commonly show strongly asymmetric probability
                                                                                  distributions for the true value of TEM (Bonadonna et al., 2015a). We
   While commonly encountered in estimates of ESPs, these dependen-               describe parameter-specific challenges encountered when provid-
cies would result in negligible biases for understanding the relation-            ing uncertainty in section 2.2.
ships between ESPs and evaluating ECMs.                                               Most databases describing volcanic activity are built on information
                                                                                  gathered from the published record, e.g. the LaMEVE (Crosweller et al.,
2.1.2. Data sources                                                               2012), DomeHaz database (Ogburn et al., 2015), or the GVP database,
    This study undertook an extensive search of the published litera-             and that is also the case for IVESPA. When gathering ESPs from the pub-
ture and of other sources, such as bulletins of the Global Volcanism              lished record, information on the data provided (e.g. what parameter
Program (GVP), and reports from volcano observatories to compile                  was exactly measured, how and when) and its uncertainties may be in-
ESPs. Table 2 summarizes the 340 sources used. The published                      complete or unclear. As a consequence, experts compiling databases on
peer-reviewed literature in the English language accounted for 66%                volcanic activity must commonly interpret sources, i.e. make assump-
(225 articles) of our sources, with several journals unsurprisingly               tions on missing information, to estimate the most appropriate value

                                                                              4
T.J. Aubry, S. Engwell, C. Bonadonna et al.                                                                             Journal of Volcanology and Geothermal Research 417 (2021) 107295

of an ESP best estimate or uncertainty. For example, a paper may pro-                            2.1.4. Initial quality control of key eruption source parameters
vide a clear estimate for the column height, but be unclear whether                                  IVESPA is downloadable as datasheets and is accessible through a
the height quoted is above vent, ground (e.g. plains surrounding vol-                            searchable website (ivespa.co.uk) on which database users can post
cano used as a reference point to measure the height) or sea level (a.v.                         comments, suggestions, and feedback which may lead to correction of
l., a.g.l. and a.s.l.). The level of interpretation required to provide ESP es-                  initially provided ESP values and new entries in the database. Ulti-
timates may directly affect their reliability and, in turn, the use or                           mately, we hope that community contributions will result in a database
weight given to specific events in ECM evaluation studies. However,                               in which values provided are consensual across the volcanology com-
this interpretation is rarely discussed and never documented in ESP                              munity. To ensure that values initially provided represent a reasonable
datasets. To move forward, we systematically provide an interpretation                           consensus, we implemented an initial quality control by at least two
flag for both best estimate and uncertainty values associated with all                            “data contributors” (DCs), who are members of the IAVCEI THM com-
key ESPs provided in the database (i.e. TEM, duration, and the three col-                        mission working group tasked with the creation of IVESPA and co-
umn heights). Interpretation flags can take values of 0, 1 or 2, and Fig. 1                       authors of this paper. DCs were asked to independently provide esti-
illustrates how these values were attributed. Flag 0 corresponds to pa-                          mates of the best value, uncertainty, and associated interpretation
rameters which required negligible interpretation of the literature,                             flags (Fig. 1) of all key ESPs for each event of the database. This process
and/or for which required interpretation had a negligible influence on                            was ‘blind’ in that none of the DCs were aware of the data sources refer-
the parameter value. In contrast, flag 2 corresponds to parameters                                enced by the other DCs, nor of the estimated values. DCs could choose to
which required significant interpretation or educated guess, and/or for                           use any data source (see section 2.1.2) for providing ESPs. This helped to
which this interpretation exerted a major influence on the final value at-                         maximise the range of publications and to thus sample from as many
tributed. Flag 1 corresponds to intermediate levels of interpretation. The                       sources as possible. The DCs then compared and discussed their values
type of sources used to derive the value of an ESP (see section 2.1.2) also                      until they reached a consensus. The consensual values reached are the
influenced the choice of interpretation flag values, with information not                          final values provided in IVESPA. However, we also made available
issued from the peer-reviewed literature leading to higher values of in-                         values initially proposed by individual DCs as well as spreadsheets
terpretation flags because of the lack of peer-reviewed/objective infor-                          with detailed comments tracking how consensual values were reached
mation on which to rely for estimating an ESP value. Detailed                                    from values initially provided by two or more DCs. In the future, new
examples of choices made for flag values for all parameters are provided                          entries to IVESPA will undergo the same procedure with at least two ex-
in section 2.2.                                                                                  perts providing key ESPs values and reaching a consensus before inclu-
     Last, we do not provide uncertainty or interpretation flags on cate-                         sion in the database. Documents summarizing core discussions between
gorical parameters (e.g. eruption style), some trivial parameters                                DCs are available via the IVESPA website (ivespa.co.uk), and detailed
consisting of a single numerical value (e.g. latitude of eruptive vent)                          notes on each event are available upon request from the corresponding
and quantitative parameters consisting of more than one numerical                                author.
value (atmospheric conditions and TGSD). For atmospheric conditions,                                 The number of references available for each ESP may greatly influ-
two profiles issued from two different families of reanalysis are system-                         ence discrepancies between different DCs. For eruptions with a large
atically provided (section 2.2.4). For TGSD as well as for TEM, the only                         number of references, it is unlikely that DCs will perform an exhaustive
key ESP for which uncertainty could not always be constrained, we pro-                           search of ESP estimates throughout all references available and differ-
vide “metadata” (see section 2.2) describing the deposit sampling qual-                          ences in their ESP estimates may reflect preferences for certain refer-
ity. This metadata can then be used to infer the uncertainty on these                            ences. For eruptions with a small number of references, some
deposit-derived ESPs.                                                                            references may be particularly challenging to find and failure to do so

                          Fig. 1. Chart illustrating how interpretation flag values relate to the confidence in our interpretation and its impact on parameter value.

                                                                                             5
T.J. Aubry, S. Engwell, C. Bonadonna et al.                                                             Journal of Volcanology and Geothermal Research 417 (2021) 107295

may result in very different ESP estimates due to scarcity of information.               Whenever distinct mass or volume estimates were provided in the
To better assess how much ESP estimates may differ depending on the                  literature, the TEM includes only the mass of fallout deposits from a
expert compiling data from the literature, we extended the above qual-               vent-sourced stable volcanic column only, and an estimate for the de-
ity control procedure to eight DCs for two example eruptions in the da-              posit mass derived from PDCs is provided separately. Accompanying
tabase. For this purpose, we chose the 2015 eruption of Calbuco and the              the TEM estimate, we provide a categorical parameter indicating
1971 eruption of Fuego, which are respectively representative of erup-               whether the TEM was directly obtained from measurements of mass
tions with a relatively large and small number of dedicated studies. A               per unit area, or whether it was obtained from the deposit volume
detailed analysis of discrepancies between the different ESP estimates               and density. We also provide the value of the deposit bulk density,
and of the final consensual value chosen is provided in section 4.                    which was assumed to be 1000 kg m-3 when no estimate was available
                                                                                     in the literature, with this default value being representative of the av-
2.2. Parameters collected                                                            erage density for events across which it is available (e.g. Scasso et al.,
                                                                                     1994; Andronico et al., 2014a). In contrast to event duration and column
    In this subsection, we provide a definition and overview of all pa-               height, uncertainty information on TEM in the published record is com-
rameters collected. For our three key ESPs (sections 2.2.1, 2 and 3), we             monly not provided and hard to infer from contextual information, so
first provide the parameter definition before discussing in detail two ex-             that it is the only key ESP for which we did not systematically provide
amples of events which represent challenging and ideal cases for the                 an uncertainty. However, we provide a set of “metadata” on the deposit,
compilation of that ESP, along with explanation for the values chosen                including
in IVESPA to illustrate the data collection process.
                                                                                     • The number of sampling sites at which the thickness or mass per unit
2.2.1. Total erupted mass of tephra-fallout deposits                                   area was measured.
                                                                                     • The minimum and maximum distance of sampling sites from the
2.2.1.1. Parameter definition. The total erupted mass (TEM) of tephra-                  eruptive vent.
fallout deposits is one of our key ESPs and was collected solely from                • The number of lines drawn on the isopach or isomass map.
sources that used the properties of the tephra-fallout deposit to derive             • The minimum thickness or mass per unit area value among these
its volume or mass. In theory, both can be estimated based on the                      lines.
field mapping of the deposit thickness (volume) or mass per unit area                 • A subjective estimate of the fraction of the deposit lost to sea or ocean,
(mass), which are then contoured into isopach or isomass maps, respec-                 expressed as a categorical parameter taking values “negligible”,
tively. The final volume or mass can then be obtained by integrating the                “some” and “significant”.
square root of the area of each contour against the contour’s value on a             • The delay between the eruptive event and the data collection.
semi-log plot (e.g. Pyle, 1989). In practice, this process is complicated by
sources of uncertainties that can be classified into four broad categories.               These metadata complement the uncertainty estimate, when pro-
First, various uncertainties are related to the deposit’s properties, e.g. its       vided, and interpretation flags in providing users with information on
accessibility and preservation, which affect the density and spatial dis-            the quality of the deposit dataset and TEM estimate provided. Ulti-
tribution of samples, or the natural variability of emplacement pro-                 mately, investigating the relationship between these metadata and the
cesses, which affect how representative a given sample is of the                     uncertainty on TEM may enable us to make informed estimates of
surrounding local conditions (Engwell et al., 2013). Second, a subjective            TEM uncertainty for events for which it is not constrained in the
component is inherent to the measurement of thickness and or mass                    literature.
per unit area values (e.g. Engwell et al., 2013). Third, some uncertainties
can be associated with the contouring of the deposit’s thickness or mass             2.2.1.2. Examples of challenging and ideal events to collect the parameter.
per unit area. Although semi-empirical methods have been proposed to                 To illustrate some of the data collection process for TEM, we discuss
minimize the subjective component of the contouring processes, most                  two eruptions included in the database. The Cordón Caulle 2011 erup-
values of mass and volume in the literature inferred from deposit geom-              tion (Chile) represents a case for which TEM collection was relatively
etries rely on hand-drawn contours (e.g. Klawonn et al., 2014a, 2014b).              straightforward thanks to excellent data presentation in Pistolesi et al.
A number of techniques for automating construction of isopach maps                   (2015) and Bonadonna et al. (2015b). The sampling of the deposit and
have been produced (e.g. Engwell et al., 2015; Yang and Bursik, 2016)                the stratigraphy is clearly presented in Pistolesi et al. (2015) and the au-
however these also typically involve the choice of some fit parameter.                thors included isopach maps (showing both the thickness contours and
The fourth source of uncertainty relates to the strategy chosen for com-             the sampling locations) and thinning trend plots for all stratigraphic
puting the final value of volume or mass (e.g. Bonadonna et al., 2015a).              units which represent different events within the eruption for which a
On the one hand, various empirical approaches have been proposed to                  volume and TEM could be constrained. Multiple strategies were used
describe the variable thinning rates of tephra deposits and extrapolate              to integrate thinning trends and obtain a volume, and the authors pro-
the deposit in regions where it is either inaccessible (e.g. proximal re-            vided values obtained from each of these strategies as well as averages
gions) or removed (e.g. distal regions). Each approach’s strengths and               and standard deviations across all strategies in a table. The bulk deposit
weaknesses have made them more appropriate in different contexts                     density for each event was also clearly constrained with distance from
and, as a result, deposit volumes or masses are often reported in the lit-           the vent enabling confident derivation of mass estimates (Bonadonna
erature as a range bounded by the estimates provided by the different                et al., 2015b). Last, the role of PDCs is also clearly discussed and their
models. On the other hand, the field measurement of the deposit thick-                volume was constrained, enabling us to confidently provide distinct es-
ness is easier and more time efficient in case of old deposits than mea-              timates for our TEM parameter and the erupted mass derived from
suring a mass per unit area. In contrast, sampling of tephra fallout in              PDCs. As a result of the clear data presentation, there was excellent
real time or quasi real time (i.e. within a few hours or days from the               agreement between the TEM parameter values compiled independently
eruption) is more efficient in mass per unit area. Consequently, esti-                by the two DCs in charge of this eruption, and interpretation flags for
mates of the TEM are frequently only a simple product of the volume                  both the TEM best estimate and uncertainty were chosen to be 0 (no
of the deposit by a single generic value of density assumed to be con-               or negligible interpretation, see Fig. 1). The only minor discrepancy re-
stant over the entire deposit and vice-versa. For some deposits, numer-              lated to uncertainty, with one DC choosing the one standard deviation
ous measurements of deposit density are available at different distances             values quoted in Pistolesi et al. (2015) and Bonadonna et al. (2015b),
from vent, making the conversion between mass and volume more                        and the other one doubling them. The latter option is more consistent
accurate.                                                                            with our aim to provide uncertainties representative of a 95% or

                                                                                 6
T.J. Aubry, S. Engwell, C. Bonadonna et al.                                                         Journal of Volcanology and Geothermal Research 417 (2021) 107295

“high” confidence level and it was thus chosen as the consensual value               These methods include image analysis from visual and thermal cam-
after minimal discussion. TEM uncertainty estimates can be slightly                 eras, satellite observations, ground-based radar, and analysis of
more refined than those from the Cordón Caulle 2011 eruption. For ex-                infrasound signals and volcanic tremor. It is also common that the
ample, TEM uncertainty of some events in the database accounted for                 only source of information is visual reports from local witnesses
uncertainties in drawing of the isopach map or the bulk density of the              (non-expert observers). We also considered events for which the
deposit. However, the choice of the thinning trend integration strategy             only source of information on duration is indirect observations,
is one of the dominant causes of TEM uncertainty (Bonadonna et al.,                 such as reports on the noise of the eruption or the glow of the erup-
2015a) and the Cordón Caulle 2011 eruption represents a nearly ideal                tive vent/column at night, as well as ashfall reports (e.g. Hill et al.,
case for TEM collection from published literature.                                  1998). Such observations may be poorly representative of the dura-
    In contrast, the Sarychev Peak (Russia) 2009 eruption took place on             tion during which most of the tephra was emitted, e.g. ashfall timing,
a remote island, and therefore most of the deposit was lost to sea and              even when corrected for ash transport and settling, is a very uncer-
field analysis of land deposits, and estimation of TEM, proved very chal-            tain proxy for ash emission at the vent. Accordingly, uncertainties
lenging. As a consequence, one of the only references with information              and flag values are generally particularly high when using indirect
on the deposit (Rybin et al., 2011) did not include any detailed informa-           evidence to estimate duration.
tion on the sampling conducted, nor any plot or data on isopach map or           3. For eruptions for which multiple events can be constrained, each
thinning trend. The authors mention a preliminary estimate of the bulk              event corresponds to a distinct layer of the tephra deposit whose
volume of 0.4 km3 with no further justification. The minimal description             properties were measured to provide an estimate of the volume or
provided at least gave confidence that this estimate was based on field               mass of that specific layer. Layers are often separated based on either
data and not, for example, on inversion of plume height via plume                   the properties of the deposited tephra (e.g. size distribution,
modelling. The thickness of the deposit was apparently sampled on dis-              componentry or color) or the main direction of dispersal governed
tant islands which also suggests that this estimate is not based solely on          by wind direction at the altitude at which most of the ash was
the proximal deposit on the Matua Island where Sarychev Peak is lo-                 injected into the atmosphere. Thus, determining the timing of
cated. A second reference (Rybin et al., 2012) quotes volume estimates              emplacement of each layer requires observations of the corre-
between 0.1 and 0.4 km3, but we could not access any of the references              sponding transitions in eruption style or in wind direction (e.g.
quoted and no additional information on how these estimates were ob-                Gudmundsson et al., 2012). The exact timing of such transitions is
tained was provided. To obtain a TEM estimate for the Sarychev Peak                 often challenging to constrain.
2009 eruption based on this information, both DCs working on this
event chose to use the volume estimate of 0.4 km3 and an arbitrarily as-         2.2.2.2. Examples of challenging and ideal events to collect the parameter.
sumed density of 1000 kg m-3 (e.g. Scasso et al., 1994). An interpretation       While it represented a nearly ideal case for TEM collection, the 2011
flag value of 1 was given to the TEM best estimate, although the possi-           eruption of Puyehue Cordón Caulle is a typical example of an eruption
bility of using a flag 2 was discussed. Ultimately, there was only one vol-       for which the duration of individual eruptive events was particularly
ume estimate available in the peer-reviewed literature (Rybin et al.,            hard to estimate. The volume of four distinct groups of tephra layers is
2011) so that even if it is poorly informed, no interpretation was re-           constrained by Pistolesi et al. (2015) (layers A-B, A-F, H, and K2). How-
quired in choosing a volume estimate. DCs had to make an educated                ever, we could not find any constraint on the time at which the activity
guess for the bulk deposit density, but volume uncertainty is expected           associated with layer B finished, which prevented estimating two key
to be the dominant contribution to the TEM uncertainty so that DCs               ESPs, the duration and the height. Consequently, we could only provide
did not deem that a flag 2 was justified for the TEM best estimate. How-           ESPs for three eruptive events for this eruption corresponding to layers
ever, in the absence of any other information, no TEM uncertainty (and           A-F, H and K2. For layers A-F, Bonadonna et al. (2015c) provide detailed
no interpretation flag for the uncertainty) was provided for this event.          estimates of the duration but these are based on the ratio between the
                                                                                 TEM and the MER as inverted from plume height using an ECM; as
                                                                                 such, these estimates do not fit our set of entry conditions (see section
2.2.2. Event duration
                                                                                 2.1.1) and were ignored. By comparing deposit dispersal and satellite
                                                                                 images, Pistolesi et al. (2015) estimated a duration of roughly 24-30
2.2.2.1. Parameter definition. Duration is one of the key ESP collected for
                                                                                 hours. A compatible duration of 27 hours is mentioned in Jay et al.
each volcanic event of the IVESPA database because it is required to ob-
                                                                                 (2014), but this reference is a conference presentation and does not in-
tain the MER from the TEM. To be as consistent as possible in the calcu-
                                                                                 clude any detail on the methodology. Consequently, DCs decided to use
lation of the MER, we define duration of an event in IVESPA as the
                                                                                 a duration of 27 hours with an uncertainty of 3 hours, but to attribute a
duration of the sustained eruptive phase(s) during which most of the
                                                                                 flag 2 (see Fig. 1) to both the best estimate and the uncertainty. The du-
tephra volume was erupted by the volcano. This parameter was partic-
                                                                                 ration of the second event of this eruption, corresponding to layer H,
ularly challenging to define owing to a variety of factors:
                                                                                 was equally hard to constrain. Pistolesi et al. (2015) attributed various
1. Various definitions for the duration of a volcanic event are used in the       satellite images to different layers deposited by the eruption, based on
   literature, and it is often unclear which definition was used in origi-        the correlation between the deposit dispersal direction and the wind di-
   nal references and the extent to which it is compatible with the def-         rection. They could not attribute any satellite image to layer H but one
   inition we use in IVESPA. For example, duration may be defined as              image at 19:45 (local time) on June 6 is attributed to layer G (preceding
   the period of time when a volcano is erupting volcanic material               layer H) and one at 13:28 on June 27 to layer K2 (following layer H). This
   (e.g. Gunn et al., 2014). However, it is well known that an eruption          suggests that the maximum duration of the phase (or event) depositing
   can show different phases (e.g. explosive, effusive) and styles (e.g.         layer H was ca. 17 hours. Furthermore, they state that the phase depos-
   Strombolian, Vulcanian), sometimes separated by periods of quies-             iting layer H started during the night of June 6 and that the phase depos-
   cence. During some of the eruption phases, the emitted material               iting layer K2 (the layer above layer H) started in the morning of June 7.
   (e.g. volcanic gas, lava, minor/sporadic ash during ash venting or            Assuming that a night start was before 3:00 at the latest and a morning
   vent clearing events) may not be relevant to the emplacement of               end after 6:00 at the earliest, the minimum duration of the event depos-
   the tephra fallout deposit from a sustained column, and such phases           iting layer H was 3 hours. Bonadonna et al. (2015c) also state that the
   were excluded when estimating event duration for IVESPA.                      maximum duration of the event that deposited layer H was 12 hours.
2. A large variety of methods can be applied to measure the duration             Based on interpretation of published information, the minimum dura-
   of an event, and these methods result in different estimates and              tion of the event depositing layer H could thus be ca. 3 hours and the
   sometimes impose different definitions of the eruption duration.               maximum duration could be 12 hours, possibly up to 17 hours. One

                                                                             7
T.J. Aubry, S. Engwell, C. Bonadonna et al.                                                                        Journal of Volcanology and Geothermal Research 417 (2021) 107295

Fig. 2. Cartoon illustrating the three column heights considered in IVESPA (box to left), as well as the various measurement techniques constraining values in the database. We also
illustrate more refined height definitions not yet incorporated in IVESPA v. 1.0 (box with dashed line). The cartoon shows a strong plume with separation of volcanic ash and SO2; note
that these two phases are not always decoupled, and that for a weak plume (bent-over by the wind with no overshooting top), the top height equals that of the top of the spreading
umbrella cloud. IR, VIS and UV stand for infrared, visible and ultraviolet, respectively.

DC with no a priori knowledge of the eruption thus proposed a duration                       (Fig. 2) and the discussion of column height is increasingly nuanced in
of 7.5 hours with an uncertainty of 4.5 hours, and interpretation flag                        the literature. The most common distinction is between the maximum
values of 2 for both the best estimate and uncertainty. However, the sec-                    or “overshoot” height reached by a volcanic column, referred to as the
ond DC had first-hand knowledge of the eruption that provided insight                         top height hereafter, and the height at which an umbrella cloud is
that the duration was between 6 and 12 hours for this event. The final                        spreading, referred to as the spreading height hereafter (Fig. 2). Because
consensual value for the duration of this event was thus 9 hours with                        most early measurements of volcanic plume vertical extent were based
an uncertainty of 3 hours, and we retained interpretation flag values                         on visual observations, the first estimates of the top height and spread-
of 2 given the minimal amount of information available in the literature                     ing height available refer to the ash-rich part of a volcanic column. How-
and the substantial role of interpretation and expert judgement re-                          ever, volcanic columns are fundamentally multiphase flow, and as
quired to provide an estimate of the duration.                                               remote sensing methods to measure plume height have developed,
    Contrary to the 2011 Puyehue Cordón Caulle events, duration was                          the height of dispersion of SO2 is now a standard measurement during
straightforward to constrain for the 22 April phase of the 2015 Calbuco                      volcanic eruptions (e.g. Carboni et al., 2016). In particular, it has become
eruption. Based on seismic signals, visual observations, and satellite ob-                   clear that the ash and gas phase of a volcanic plume can separate and
servations, available references place the start of the eruption between                     disperse at different altitudes (Schneider et al., 1999; Prata et al.,
21:04 UTC and 21:06 UTC, and the end between 22:32 UTC and 22:35                             2017). In addition to being observed, these different types of plume
UTC (Romero et al., 2016b; Van Eaton et al., 2016; Global Volcanism                          heights can also be distinct outputs of some ECMs, and using more
Program, 2015a; SERNAGEOMIN, 2015). Based on the eruption descrip-                           than one height enables to improve the evaluation and/or predictions
tion in these references, we are confident that sustained ash emission                        of ECMs (e.g. Suzuki and Iguchi, 2019).
occurred between these time stamps, and Vidal et al. (2015a) also                                Consequently, in version 1.0 of IVESPA, where possible we compile
state that the most energetic phase of the eruption lasted 90 min. We                        height data for three different types of plume (Fig. 2):
chose the latter estimate as the best estimate for the duration of this
event, with an uncertainty of 4 min covering the duration range of 86-                       • “Top height”: the top height of the tephra phase of the plume, i.e. its
91 min informed by the start/end time. No interpretation of the litera-                        maximum height in a spatial sense (not in a temporal sense, see
ture was required to come up to these estimates and we thus chose in-                          below).
terpretation flag values of 0 for both the best estimate and uncertainty.                     • “Spreading height”: the spreading height of the tephra phase of the
                                                                                               plume.
2.2.3. Column heights                                                                        • “SO2 height”: the height of dispersion of SO2.

2.2.3.1. Parameter definition. The column (or plume) height is the main                           Each event in the database has at least one of these three measure-
output common to all ECMs. Its estimation is key for characterizing                          ments available (section 2.1.1). As key ESPs, all three types of height col-
the explosivity of volcanic eruptions (Newhall and Self, 1982) and to                        lected systematically include a best estimate, an uncertainty, and
evaluating the level of the plume injection used by Volcanic Ash Advi-                       interpretation flags for both values (see section 2.1.3 and Fig. 1). The dis-
sory Centers (VAACs) to forecast volcanic ash dispersion during a volca-                     tinction between these different types of height represents a major im-
nic eruption (e.g. Witham et al., 2007). This value is also essential to run                 provement over previous ESP datasets where a single height was
plume gas and aerosol retrievals (Prata and Grant, 2001; Corradini et al.,                   compiled, sometimes loosely defined (e.g. Sparks et al., 1997b; Mastin
2018). While volcanological studies - including those compiling ESP                          et al., 2009; Aubry et al., 2017a; IAVCEI THM database). Because of the
datasets - often mention “the” plume height without explicit definition,                      dominance of satellite-measured height in the data collected, we pro-
multiple metrics for the vertical extent of an eruptive column exist                         vide height in km a.s.l. However, we systematically provide the altitude

                                                                                         8
T.J. Aubry, S. Engwell, C. Bonadonna et al.                                                              Journal of Volcanology and Geothermal Research 417 (2021) 107295

of the eruptive vent (see section 2.2.6) so that IVESPA users can easily              • “s”: satellite-based observation of the plume, such as cloud-top-
convert these heights to km a.v.l., which is a more meaningful metric                   temperature, shadow technique or backward trajectory modelling.
for plume dynamics. We aim to provide heights that are representative                 • “o”: other, which include some of the least conventional methods
of the time-averaged value over the duration of volcanic events. Previ-                 used to place constraints on plume height. For example, when very
ous datasets have sometimes compiled heights that are more represen-                    few plume height estimates are available, the tropopause height is
tative of the maximum height reached during an event (e.g. Sparks et al.,               used as a lower bound on the SO2 height when the eruptive event
1997b; Mastin et al., 2009). However, MER values derived from the TEM                   led to significant perturbation of the stratospheric aerosol optical
(section 2.2.1) and duration of sustained ash emission (section 2.2.2) are              depth or to significant deposition of sulfate in polar ice-core.
representative of the time-averaged MER (as opposed to a peak MER).                   • “u” = unknown.
Thus, providing time-averaged plume heights is more consistent with                       We generally use all available estimates to propose a best estimate
the definition of the other key ESPs collected. All heights provided are               and uncertainty on plume height, so that this categorical variable
also aimed to be representative of the vertical extents of the column                 often includes several methods.
near the vent, before transport and radiative processes affect the vertical
distribution of volcanic products initially determined by the eruptive                2.2.3.2. Examples of challenging and ideal events to collect the parameter.
column dynamics. For the spreading height of any type of plume, a few                 The 1902 eruption of Santa Maria is one of the IVESPA events for which
studies (e.g. Van Eaton et al., 2016) sometimes provide detailed informa-             we have the least information on plume height. The only estimates are re-
tion on whether their measurements are representative of the top, cen-                ports from two ship captains found by Williams and Self (1983), one of
ter or bottom of the spreading height layer (Fig. 2). Such distinction can            which places the “column height” at 27-29 km using a sextant and the
in turn be crucial for rigorous ECM evaluation, in particular for weak                other one at 48 km using an unknown method. It is unclear whether
plumes (e.g. Mastin, 2014; Devenish, 2016; Aubry et al., 2017a). How-                 these heights should be considered as a.s.l. or a.v.l. estimates, although
ever, this distinction is challenging to make and rarely presented in the             the former option is more likely for a sextant measurement, and given
literature so that we did not include it in version 1.0 of IVESPA (Fig. 2).           the much higher height of the column compared to the altitude of the
    Fig. 2 summarizes some of the different techniques used to measure                eruptive vent (3.8 km). It is also unclear whether these heights likely cor-
plume height in the sources from which we compiled ESPs. For the events               respond to the top height or the spreading height. Both DCs for this erup-
in the database that occurred before the beginning of the satellite era (late         tion chose 28 km as the best estimate because the measurement
1970’s/early 1980’s), the most common type of plume height measure-                   technique is documented, and both assumed it was likely representative
ment is visual report from experienced observers (e.g. observatory staff)             of the plume top measured a.s.l. An interpretation flag 1 was chosen by
and witnesses from the ground - sometimes using video camera - as                     both DCs for this value even though a flag 2 could have been considered
well as aircraft pilot visual reports. However, for the majority of events            given that the measurement could relate to the spreading height. For
that occurred during the satellite era, the column heights have been esti-            the uncertainty, one could consider the 48 km estimate as an upper
mated using different satellite-based remote sensing techniques (Fig. 2;              bound which would give an uncertainty of 20 km. This eruption is also as-
also see table 1 in Taylor et al., 2019). For example, the correlation of             sociated with sulfate deposition at the pole and stratospheric aerosol op-
11-μm brightness temperature of the plume top observed from satellite                 tical depth perturbation (Rose, 1972), so it seems unlikely that the top
(e.g. MSG-SEVIRI) with the atmospheric temperature profile of a nearby                 height was below the tropopause, i.e. 16-17 km, which would give an un-
radiosonde is the most commonly used method for top height estimation.                certainty of 12 km. Here the DCs chose to attribute a 50% uncertainty, i.e.
This method, referred to as Cloud-Top-Temperature (CTT) in the litera-                14 km, which falls in the 12-20 km range that could be inferred from the
ture is routinely used by VAACs and volcano observatories (Gouhier                    minimal information available. An interpretation flag of 2 was given to the
et al., 2020). From the ground, the column dimensions may be estimated                uncertainty as it consists mostly of an educated judgement.
by weather radar (e.g. Marzano et al., 2019), lidar (e.g. Scollo et al., 2015),           In contrast, eruptive events associated with the 2010 eruption of
auto-calibrated webcams (e.g. Scollo et al., 2014), or video image analysis           Eyjafjallajökull represent a nearly ideal case for collecting plume height.
(e.g. Arason et al., 2011). The heights obtained from different techniques            The Icelandic Meteorological Office had a weather radar and several
(Fig. 2) may differ largely because they measure different parts of the               cameras monitoring the eruption from which the top height could be
plume (e.g. top vs. bottom of the umbrella cloud), use fundamentally dif-             estimated (Arason et al., 2011). Multiple satellite sensors, including
ferent techniques, are obtained at different times after the eruption and/            the Infrared Atmospheric Sounding Interferometer (IASI), the Global
or distances from the volcanic vent, and because each technique is subject            Ozone Monitoring Experiment (GOME)-2 and the Spinning Enhanced
to its own uncertainty (e.g. Tupper and Wunderman, 2009). For example,                Visible and Infrared Imager (SEVERI), were also used to track the erup-
the cloud-top-temperature method is limited by the quality of the radio-              tive column and estimate the spreading height and the SO2 height
sonde profile used and the fact that for columns with heights close to the             (Stohl et al., 2011; Flemming and Inness, 2013; Carboni et al., 2016).
tropopause, two heights estimates are possible because of the tempera-                Most of the column height data consisted of time series as opposed to
ture inversion. Last, it is important to note that we excluded any plume              a single or handful of values so that we could rigorously calculate
height estimate obtained from inversion of deposit data using a modelling             time-averaged values of plume heights for each event. The extraordi-
approach, including the method of Carey and Sparks (1986) and its recent              nary interest of the volcanology community in this eruption also
extensions (e.g. Rossi et al., 2019) which invert the plume height from               means that publications in which we found plume height data included
clast size isopleths. Such methods clearly violate the criteria of indepen-           more information on measurement limitations than for most eruptions.
dence among ESPs and the rejection of any method making use of erup-                  The large number of publications also enabled us to compare height
tive column modelling (section 2.1.1).                                                values across multiple references and to be confident in uncertainty
    Given the large variety of techniques applied in measuring plume                  values provided. As a result, whether for the top height, spreading
height, their limitations, and the differing levels of confidence that a da-           height or SO2 height, all best estimates of heights for this eruption
tabase user may have in them, we complement parameters provided for                   have been attributed an interpretation flag of 0, and uncertainty esti-
each of the three plume height types by a categorical variable named                  mates were either given flag values of 0 or 1.
“method” which includes the following categories:
                                                                                      2.2.4. Atmospheric conditions
• “v”: visual observation of the plume, whether from the ground or from                   Atmospheric conditions have been demonstrated to exert substan-
  an airplane.                                                                        tial influence on the dynamics of eruptive columns and have become a
• “g”: ground-based observation of the plume using instrumentation                    standard input to most ECMs (e.g. Costa et al., 2016a; Aubry et al.,
  such as radar, lidar or calibrated cameras.                                         2017a). As a consequence, for each eruptive event in the database, we

                                                                                  9
You can also read


