Terra progress report 2020 - Our approach to climate action
←
→
Page content transcription
If your browser does not render page correctly, please read the page content below
Terra progress
                report 2020

Our approach to climate action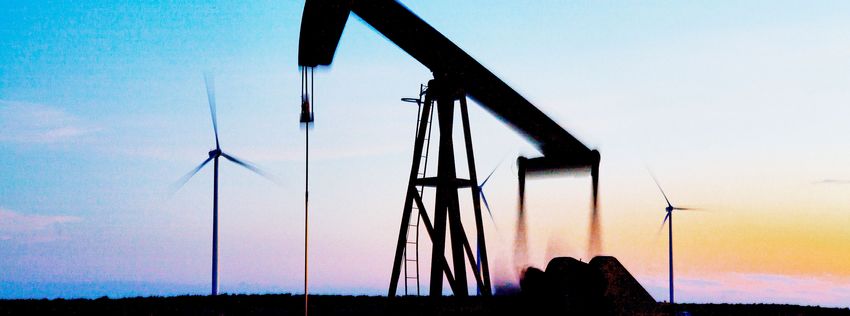
Contents      Preface    Introduction   Our progress   Sector deep-dives    Sustainable Finance at ING   Conclusion   Governance annex     Technical Annex      Glossary

Contents
Preface                                          3         3 Sector deep-dives                              15         6 Governance annex                                  78
                                                           Power generation                                 16         Climate Change Governance                           78
1 Introduction                                   5         Fossil fuels                                     21         Reporting process                                   78
Our journey                                      5         Commercial real estate                           29
Progress in our sector                           6         Residential real estate                          35         7 Technical Annex                                   79
About this report                                7         Cement                                           44         Conceptual building blocks for target-setting       79
The Terra approach                               8         Steel                                            49         Arriving at a CO2 intensity metric per sector       80
                                                           Automotive                                       56         Limitations of the CO2 intensity metric             81
2 Our progress                                 10          Aviation                                         61         PACTA – 2˚ Investing Initiative (2DII)              81
The Climate Alignment Dashboard                11          Shipping                                         66         Data sources and Scoping                            83
Scope                                          12
How we steer                                   12          4 Sustainable finance at ING                     73         Glossary                                            86
TCFD recommendations and the Terra approach    13          Our role                                         73
                                                           Pioneers in sustainable finance                  74         Important legal information                         87

                                                           5 Conclusion                                     75         Contact                                             88
                                                           Methodology refinement                           75
                                                           Bank standardisation                             76
                                                           Scope expansion                                  76
                                                           Outcome vs. impact                               76

                                                                                                                          Updated on 16 November 2020

                                                                                                                                                                            2
Contents   Preface   Introduction   Our progress   Sector deep-dives   Sustainable Finance at ING   Conclusion   Governance annex   Technical Annex   Glossary

                                                                                With the Terra approach, ING aims to be a positive
                                                                                force in the fight against climate change. Our
                                                                                approach is inclusive and collaborative. We work
                                                                                together with our clients to facilitate their transition
                                                                                to low-carbon technologies. At the same time,
                                                                                we’ve been working together with other banks and
                                                                                experts to define a methodology standard open
                                                                                for all banks to use. We believe this will ultimately
                                                                                help the financial sector to make a bigger impact.
                                                                                This report delivers on the promise we made last
                                                                                year to include all nine carbon-intensive sectors in
                                                                                2020. I’m really proud of the progress we’ve made
                                                                                over the past 12 months and I’m looking forward
                                                                                to continuing to take the steps necessary to play
                                                                                a responsible and leading role in the fight against
                                                                                climate change.”

                                                                                 –S
                                                                                   teven van Rijswijk,
                                                                                  CEO of ING

                                                                                                                                                                 3
Contents   Preface   Introduction   Our progress   Sector deep-dives   Sustainable Finance at ING   Conclusion   Governance annex   Technical Annex   Glossary

                     We welcome ING’s continued efforts to steer
                     their lending portfolio in line with the Paris
                     Agreement, as well as their open exploration
                     of challenges and dilemmas through the Terra
                     reports. We are proud to work with ING and
                     other global banks in making PACTA a more
                     robust and more user-friendly climate-scenario
                     analysis tool available for all banks worldwide.”

                      –M
                        aarten Vleeschhouwer,
                       head of PACTA, 2° Investing Initiative

                                                                                                                                                                 4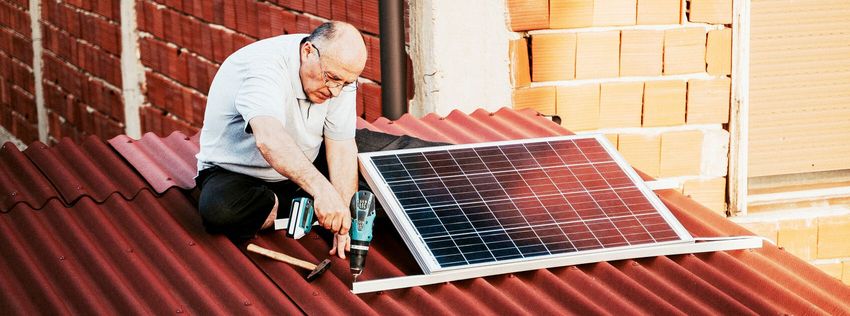
Contents     Preface      Introduction     Our progress      Sector deep-dives     Sustainable Finance at ING    Conclusion      Governance annex        Technical Annex     Glossary

1 Introduction                                                                                  before. Tackling the threat of climate change is no different. As outlined in our first
                                                                                                report, we believe that no one sector, much less one bank, can solve the climate crisis.
                                                                                                This must be a collective effort through open collaboration with peers, civil society
In 2018, ING announced our commitment to steer our lending                                      organisations, consumers, governments and regulators. And this collective effort must
portfolio in line with the goals of the Paris Agreement. In September                           start at home, with us doing our part internally, so that we can make meaningful
                                                                                                contributions externally.
last year, we presented the progress we had made in the first-ever
annual Terra Progress Report 2019. In line with our commitment to
                                                                                                To that end, ING has focused on improving, refining, developing and further embedding
update our stakeholders on how we continue to improve and progress                              the Terra approach within our business. The first report presented our performance,
each year, we now present our second annual Terra Progress Report.                              portfolio targets, challenges and next steps for five of the nine sectors in scope. Since
                                                                                                then, we have made progress developing the methodologies for the remaining four
This report provides a status update on the alignment of our lending portfolio with             sectors. In particular, we have defined and/or refined methodologies for the fossil fuels,
the well-below 2°C goal of the Paris Agreement. It includes portfolio targets, timelines,       steel and aviation sectors by working intensively with our partner the 2° Investing
opportunities and challenges. What’s more, this year we provide quantitative results for        Initiative (2DII) and with our PACTA pilot and ‘Katowice Commitment’ peers our most
the remaining four sectors in scope, which were not yet included last year.                     intensive collaboration being with the last, comprising Société Générale, BNP Paribas,
                                                                                                BBVA and Standard Chartered (hereinafter referred to as the ‘Katowice Banks’). We also
                                                                                                worked closely with fellow signatories of the Poseidon Principles to develop a means to
Our journey                                                                                     collect data and apply the methodology in order to report in line with our commitment
Much has taken place since last September, not only within our business but also                in the shipping sector. We also refined the existing methodologies with updated
the world. The global coronavirus pandemic is something most of us couldn’t have                emissions factors and more granular data in some sectors, such as automotive. With
imagined. We’ve seen the major disruptions it has caused, but we’ve also seen the way           these improvements, we present to you the most complete view so far of the nine
it has brought societies and communities together to tackle them. If 2020 has taught            sectors currently within the scope of our Terra approach. This will remain a continuous
us anything so far, it’s that we’re an extremely interconnected global society. We’re           process of learning, growth and getting better as data, methodologies and strategies
more dependent upon united and collective action for real, positive change than ever            improve over time.

                                                                                                                                                                                         5
Contents         Preface             Introduction         Our progress         Sector deep-dives            Sustainable Finance at ING               Conclusion             Governance annex              Technical Annex           Glossary

Figure 1 ING’s journey towards portfolio climate alignment action

                2015                                2016                          2017                             2018                            H1 2019                            H2 2019                         H1 2020

     • ING officially endorses the      • ING partners with external   • ING partners with the 2˚       • ING announces ambition to       • ING is joined by more than       • ING becomes one of the         • ING joined the Evidence
       Paris Agreement.                   environmental consultancy      Investing Initiative (2DII),     steer portfolio towards the       20 systemically important          founding signatories of          for Impact Partnership
                                          firm Navigant to develop       to translate their PACTA         goals of Paris. We are joined     banks in the 2DII PACTA pilot      UNEP FI’s Principles for         launched by 2DII to develop
     • ING signs the commitment
                                          and pilot a financed           (Paris Agreement Capital         shortly thereafter by four        project for banks.                 Responsible Banking.             improved methodologies
       letter of the Science Based
                                          emissions methodology.         Transition Assessment)           peers in the Katowice                                                                                 for impact measurement
       Targets initiative, pledging                                                                                                       • ING also joins the SBTi’s        • ING co-chairs the Collective
                                                                         approach for corporate           Commitment, jointly                                                                                   and target-setting.
       to set targets once a viable     • The approach provided a                                                                           Expert Advisory Group for          Commitment to Climate
                                                                         lending, which enables           pledging to align our                                                Action (CCCA) working
       methodology is developed           valuable hotspot analysis,                                                                        financial institutions stream
                                                                         banks to measure, set            aggregate >€2.4 trillion in                                          group.
       for our sector.                    which we used to identify                                                                         to further test and develop
                                                                         targets and steer portfolios     portfolios with the goals of
                                          the most climate-relevant                                                                         science-based target-            • ING and 38 other banks sign
                                                                         in line with the Paris           Paris.
                                          sectors.                                                                                          setting methodologies.             the CCCA which builds upon
                                                                         Agreement.
                                        • We continued to look for                                                                        • ING is one of the founding         the Katowice Commitment.
                                          approaches to set targets                                                                         signatories of the Poseidon      • ING launches our first Terra
                                          and steer our portfolio.                                                                          Principles.                        Progress Report.
                                                                                                                                          • ING joins Phase II of UNEP
                                                                                                                                            FI’s TCFD pilot project.

Progress in our sector                                                                                                       with 38 of them also signatories of the CCCA. This brings us ever closer to a new
Besides internal progress ‘at home’, we’ve seen momentum growing in the banking                                              phenomenon in the market: that banks see themselves as proactive participants and
sector for portfolio climate alignment, particularly with the launch of the Principles                                       change agents in the transition to a Paris-aligned world as we support and engage with
for Responsible Banking (PRB) and the resulting Collective Commitment to Climate                                             clients to shift their investment practices.
Action (CCCA) of the United Nations Environment Programme Finance Initiative
(UNEP FI). ING served as co-chair for the drafting and agreement of the CCCA. More                                           This growing momentum is not unique to the banking sector. We see it across the
than 180 signatories have now signed up to the Principles for Responsible Banking,                                           wider financial sector as well, driven in part by national and international shifts

                                                                                                                                                                                                                                               6
Contents     Preface      Introduction     Our progress      Sector deep-dives     Sustainable Finance at ING           Conclusion            Governance annex                 Technical Annex              Glossary

towards standards and requirements for climate reporting and sustainable finance,               About this report
such as those emerging from the EU Sustainable Finance Action Plan, the Network for
                                                                                                In this updated progress report, not only do we present the 2019 quantitative
Greening the Financial System, the Loan Markets Association, the International Capital
                                                                                                performance results for portfolio alignment across the nine sectors in scope and the
Market Association’s (ICMA) Green Bond Principles (GBP) and the Financial Stability
                                                                                                methodological improvements achieved. We also provide in-depth insights into the
Board’s Task Force on Climate-related Financial Disclosures (TCFD).
                                                                                                strategies, achievements, challenges and opportunities in each sector. The report
                                                                                                covers internal initiatives as well as how external, macroeconomic trends or shifts may
As collective action gains speed, transparency and clarity are both key to proper
                                                                                                affect each sector.
accountability. Portfolio climate alignment methodologies can be complex. The aim
of the Terra approach, the underlying methodologies and the work we’ve done with
                                                                                                Among the global shifts witnessed these last 12 months, perhaps the most notable are
2DII and peer banks, has always been to reach conclusions that balance feasibility,
                                                                                                those ushered in by the coronavirus pandemic. In the span of a few weeks, the global
accuracy (hinging on data availability and quality), comparability and communicability.
                                                                                                outbreak sparked an unprecedented public health and economic crisis that still affects
To this end, two supporting and supplementary papers have been written and recently
                                                                                                the daily life and the wellbeing of societies and communities worldwide.1
published by 2DII and peer banks with the support of or in collaboration with ING,
namely the Paris Agreement Capital Transition Assessment (PACTA) methodology
                                                                                                Economically, the pandemic has of course also had an impact on ING’s clients,
paper and the supplementary Credit Portfolio Alignment application paper written
                                                                                                especially those in the sectors covered by the Terra approach. This global crisis presents
by the Katowice Banks. This report and supporting methodological documents,
                                                                                                both challenges and opportunities for the energy transition; the balance differs per
open-source tools and online tutorials are intended to provide the transparency and
                                                                                                sector. In order to identify and transparently communicate how we see such impact
clarity needed for us to continue to be accountable to our stakeholders and for any
                                                                                                affecting progress for ING, we have included a short summary of how the pandemic
bank to get started with measuring, setting targets and steering their portfolios in line
                                                                                                has affected each sector specifically.
with the Paris Agreement.

                                                                                                1 For more information about how ING is supporting local communities and our global Build Back Better efforts,
                                                                                                  please see ING.com.

                                                                                                                                                                                                                       7
Contents Preface Introduction Our progress Sector deep-dives Sustainable Finance at ING Conclusion Governance annex Technical Annex Glossary
Additionally, this report includes a chapter on ING’s sustainable finance strategy, strategies for transition. Terra looks at the key shifts that each sector needs according
products and services, which underpin our efforts to support clients’ transitions. We to the relevant Paris transition pathway, and steers towards these changes.
conclude with how we are progressing with our ‘theory of change’, including a peek
into the collaborative work we have accomplished with our peers via the PACTA pilot, This approach also provides opportunities for ING to work with clients on the challenges
the UNEP-FI’s CCCA and more this past year. Before all of that, however, let us start by they face and support them on their journey. We use detailed insights into the trends
recapping our strategy for steering our lending portfolios towards the goals of the Paris and changes needed in each sector, which then facilitates discussions with clients
Agreement: the Terra approach. about their own strategies. Ultimately, this sector-based approach allows ING to be
more effective in steering each sector portfolio towards Paris, either through client
The Terra approach engagement or by making choices about who and what we do or do not finance.
Terra remains an approach built on a number of key attributes. It is an inclusive,
To be sure, this also comes with its own set of complexities. Taking a sector-based
forward-looking and engagement-driven approach that relies on science-based
approach means that each sector must be treated, steered and monitored separately.
scenarios and asset-level data to align sector portfolios with the Paris Agreement. With
It means that each sector has its own methodology, scope, portfolio target and
Terra we focus on the sectors in our loan book generating the most climate impact,
metrics.2 That’s because each sector’s transition pathway focuses on what the
thus addressing sectors responsible for roughly 75% of direct emissions globally.
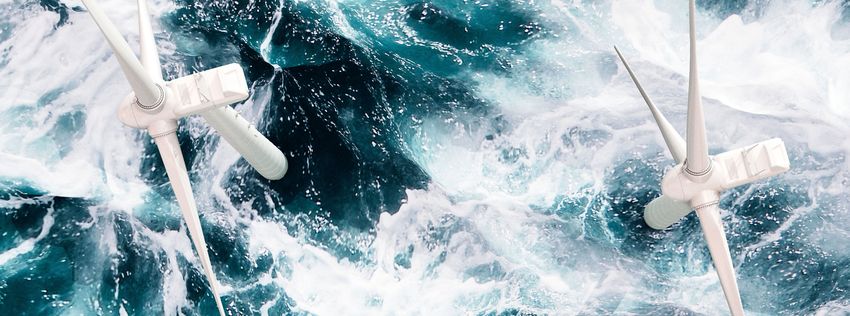
companies in that sector are producing. For example, in power generation, we look at
Drawing upon two main methodologies for target-setting, namely the Paris Agreement
what type of ‘technology’ is producing the power (e.g. wind turbines or gas-fired power
Capital Transition Assessment (PACTA) and the Science Based Targets initiative’s
stations). The table below gives an overview of our Terra toolbox of methodologies and
Sectoral Decarbonization Approach (SBTi SDA), Terra adheres to a number of underlying
the metrics used to set portfolio targets for each sector.3
principles. Perhaps the most critical principle is that we steer our portfolio per sector.
This sector-based approach respects the fact that each sector has its own transition
pathway, or technology roadmap, for it to contribute to a low-carbon, ‘below 2°C’
world. The second key principle of Terra is that we prioritise asset-level data (ALD) for
accurate measurement. The impact our clients make is driven by the types of vehicles,
buildings, aircraft, ships and plants that they own, operate or produce. In other 2 The portfolio targets are determined by the applied scenario, which also differs by sector. For example, the energy supply
sectors (power and fossil fuels) utilise the IEA’s Sustainable Development Scenario (SDS), while the Beyond 2°C Scenario
words: their assets. Real change will be at the core of our clients’ businesses and their (B2DS) is applied to energy demand sectors, as it focuses more on the deployment of the most efficient technologies:
a ‘technology push’.
3 See Technical Annex for references.
8
Contents           Preface           Introduction             Our progress            Sector deep-dives               Sustainable Finance at ING    Conclusion      Governance annex       Technical Annex     Glossary

Table 1 Terra toolbox of methodologies                                                                                             Where you see a shift in our standard reporting approach is in the fossil fuels sector.
                                                                                                                                   Here, we don’t apply a CO2 intensity figure. Instead, as these are ‘decline sectors’ in
 Sector                                Measurement                 Target-setting              Metrics used
                                       Methodologies               Methodologies
                                                                                                                                   terms of absolute production according to the IEA scenarios, we have committed to an
                                                                                                                                   absolute year-on-year reduction in our portfolio exposure to oil and gas as well as coal.
 Power generation                      PACTA 4                     PACTA                       kg CO2e/MWh
                                                                                                                                   In addition, we are committed to reporting on how these reductions, combined with
 Fossil fuels (oil, gas and coal)      2DII / Katowice Banks       2DII / Katowice Banks       Reduction in € financed
                                                                                                                                   our support of the renewables sector, will result in a shift from brown to green primary
                                                                                               (upstream oil and gas; coal)
                                                                                                                                   and secondary energy sources financed in relative terms over time, in line with the
 Commercial real estate (NL)           Delta Plan                  Paris-proof method          kg CO2/m2
                                                                                                                                   scenario production mix of the IEA.
 Residential real estate (NL/DE)       PCAF 5                      SBTi SDA                    kg CO2/m2

 Cement                                PACTA                       SBTi SDA                    t CO2/tonne cement                  What does this all mean? Well, the result is that we have set one portfolio target per
                                                                                                                                   sector in scope, providing a deeper level of transparency and more focused strategies
 Steel                                 PACTA                       SBTi SDA                    kg CO2/tonne steel
                                                                                                                                   sector by sector. By having targeted sector approaches, we believe we’re better able
 Automotive                            PACTA                       PACTA                       kg CO2/km
                                                                                                                                   to understand what’s needed in each sector in order to move the needle and align our
 Aviation                              PACTA                       SBTi SDA 6                  g CO2/passenger km                  portfolio with the Paris Agreement.
 Shipping                              Poseidon Principles         Poseidon Principles         kg CO2/tonne nautical mile
                                       (UMAS – FUSE)                                                                               We firmly believe methodological developments will continue over time. The journey
                                                                                                                                   is far from over. We are committed to working with our partner 2DII, our PACTA pilot
                                                                                                                                   peer banks and our fellow signatories to UNEP FI’s Principles for Responsible Banking to
                                                                                                                                   further refine and develop our approaches. We invite more banks worldwide to join us.

4 PACTA: Paris Agreement Capital Transition Assessment methodology of the 2˚ Investing Initiative, technology-based, utilising
  asset-level data and forward looking capital expenditure plans of clients (where possible).
5 PCAF: Platform Carbon Accounting Financials – carbon accounting framework which prescribes the use of building energy
  labels (EPC) as a proxy for CO2 or energy consumption data for residential real estate.
6 SBTi/SDA: Science Based Targets initiative’s Sectoral Decarbonization Approach – sets out sector decarbonisation pathways
  designed so as to be in line with IEA (ETP) B2DS scenario using intensity metrics.

                                                                                                                                                                                                                            9
Contents     Preface     Introduction     Our progress     Sector deep-dives     Sustainable Finance at ING    Conclusion      Governance annex         Technical Annex    Glossary

2 Our progress                                                                                of performance which can be improved within a shorter timeframe. A red indicator,
                                                                                              however, identifies a portfolio that deviates more significantly from the pathway and
                                                                                              therefore will likely take longer to improve. This could be a result of a slow market
Over the last 12 months we have made significant progress in                                  transition or having a longer average loan tenure that requires a long-term strategy for
further developing, refining and applying the Terra approach. Terra                           client engagement.

has allowed us to understand our current performance compared to
                                                                                              In some cases, we display a grey indicator. For upstream oil and gas, this is because
that of last year for five of the sectors in scope and has enabled us
                                                                                              the 2019 portfolio is our starting point and we will need to see movement relative
to benchmark our performance for all sectors against the respective                           to the scenario pathway, starting next year, before indicator status can be given.
climate pathways. As such, we have been able to set ambitious,                                For commercial real estate, this is because for 2018 we were only able to assess 60%
time-bound portfolio targets for aligning with these science-based                            of our Dutch portfolio while for 2019 we assessed the full portfolio. The additional 40%
scenarios. This has mobilised our front office sector teams to set                            generally concerns the more energy-efficient buildings, making a fair comparison
                                                                                              between 2019 and the Delta Plan convergence pathway (now starting at 2018)
sector strategies in line with our ambition to steer portfolios towards
                                                                                              impossible. Unfortunately, it is not possible to recalculate the 2018 figure for the full
the Paris Agreement and the corresponding portfolio targets.
                                                                                              portfolio. Once we get a market average, which will serve as the starting point for
                                                                                              the Delta Plan scenario, we will be able to display an indicator for commercial real
This report presents the results of our analysis: ING’s climate alignment per sector as
                                                                                              estate as well.
measured by Terra via our Climate Alignment Dashboard. For ING, climate alignment
is about steering our portfolios in line with the well-below 2°C goal of the Paris
                                                                                              All figures are year-end 2019, unless stated otherwise.
Agreement by their respective portfolio target dates. Being on track for portfolio
climate alignment (green indicator) therefore means that we are currently on track
with or are outperforming the scenario or our defined convergence pathway for this
sector. An amber indicator shows sectors that are almost on track according to the
above-stated definition as they deviate from the convergence pathway by a maximum
of 5%. ING therefore considers a deviation of 5% or less to be within the bandwidth

                                                                                                                                                                                      10
Contents Preface Introduction Our progress Sector deep-dives Sustainable Finance at ING Conclusion Governance annex Technical Annex Glossary
The Climate Alignment Dashboard For data sources please refer to Table 5 ‘Data source by type and sector’ in the Technical Annex.
Portfolio view - Outstandings as of year-end
Power Generation ING vs.
pathway
Upstream Oil & Gas Commercial Real Estate
Global and OECD Decarbonisation Pathways -14.9% Absolute Financing Trend Reduction Pathway NL Decarbonisation Pathway
600 5,000 60
Outstandings (M )
kg CO2e / MWh
kg CO2 / m2
3,986 3,883
500 50
4,000
SDS Scenario Global 3,225
400 40
SDS Scenario OECD 3,000 Deltaplan Target
300 ING portfolio 30
Market ING Portfolio
2,000 ING Target
200 ING Portfolio 20 ING Ambition
SDS Trajectory 10
100 ING Target 1,000 Convergence Pathway
Convergence Pathway 0
0 0
Residential Real Estate ING vs.
pathway
Cement ING vs.
pathway
Steel ING vs.
scenario
European Union Decarbonisation Pathway +2.4% Global Decarbonisation Pathway -0.9% Global Decarbonisation Pathway -0.6%
35 0.8 2.0
kg CO2 / tonne steel
t CO2 / tonne cement
kg CO2 / m2
30 0.7
0.6 1.5
25
B2DS Scenario EU 0.5 B2DS Scenario
20 B2DS scenario
ING Portfolio (NL/DE) 0.4 Market 1.0
15 Market
ING Target 0.3 ING Portfolio
10 ING portfolio
Convergence Pathway 2030 0.2 ING Target 0.5
ING Target
5 0.1
Convergence Pathway 2050 Convergence Pathway
0 0.0 0.0
Automotive ING vs.
pathway
Aviation ING vs.
scenario
Shipping alignment
delta
Global Pathway to Zero Tailpipe Emissions Global Decarbonisation Pathway Alignment delta
+0.7% +0.3% -8.1%
0.25 100 100%
g CO2 / passenger km
Alignmnet Delta
kg CO2 / km
0.20 80 50%
Alignment Delta based
B2DS Scenario B2DS scenario
0.15 60 on required Annual
Market Market 0% Efficiency Ratio (AER)
0.10 40 ING portfolio
ING Portfolio
-50% Portfolio weighted
ING Target 20 ING Target average
0.05
Convergence Pathway Convergence Pathway
0.00 0 -100%
0 100 200 300 400 500 600 700 800 900 1000
vessel
On track: Under or equal to pathway or scenario Above pathway by up to 5% Not on track: Above pathway by more than 5% Unavailable
11Contents Preface Introduction Our progress Sector deep-dives Sustainable Finance at ING Conclusion Governance annex Technical Annex Glossary
The Climate Alignment Dashboard shows the CO2 intensity per sector of our portfolio combustion. Similarly, for automotive, it’s about the car producers and type of
(year-end 2019) compared to the market and the relevant climate scenario.7 vehicle they produce – whether it’s an internal combustion engine or a zero-tailpipe
It also displays the climate alignment portfolio target per sector and ING’s intended emission vehicle. In short, Terra’s scope includes the parts of our portfolio that finance
decarbonisation pathway per sector to converge towards the portfolio target.8 power generation, automotive producers, commercial and residential real estate
owners, cement producers, steel producers, fossil fuel extraction, aircraft owners and
There are two exceptions. For oil and gas, we show the absolute portfolio reduction shipowners (see Technical Annex for details).
trend in line with the relative climate scenario with our 2019 upstream portfolio as our
base year for reduction. And for shipping, we show the average alignment delta: the
difference between actual and required annual efficiency ratio per vessel. How we steer
We have identified two main ways that ING can influence the CO2 intensity of
Each sector chart will be further discussed in the sector deep dives below. our sector portfolios: 1) by supporting and engaging with existing clients to shift
investments more towards low-carbon technologies, and 2) by shifting our own capital
allocation choices more towards low-carbon technologies and away from high-carbon.
Scope One example is to reduce our financing of sectors that require a decline in production
As mentioned, the analysis focuses on the most climate-relevant sectors, measured over time to meet the Paris goals, such as coal and upstream oil and gas, while
by global carbon footprint (sectors globally responsible for approximately a combined financing more renewables.
75% of total emissions). Within each sector, we look at the part of the value chain that
generates most of the climate impact and that relates to the scenarios applied. Regarding the latter, ING increased our renewable power generation financing by
€1.19 billion in 2019 while reducing our direct exposure to coal-fired power plants
For example, within the power sector, it’s the way power is generated that matters by 43%.9 This year, we also announced our commitment to reduce our financing
most – whether it’s produced using renewable energy technology or by fossil fuel to upstream oil and gas by 19% by 2040, in line with the Sustainable Development
Scenario production trend. In commercial real estate, we also saw an increase to a
total of 65% of A-C label buildings in our commercial real estate portfolio, in line with
7 See technical annex for definitions and methodological explanations for arriving at intensity metrics.
8 While the decarbonisation pathway is indicative of the direction of travel our portfolio needs to take in order to achieve the our ambitious 2019 goal. In shipping’s first year of reporting, ING’s portfolio has been
portfolio target, we expect that circumstances will change as we move along the transition pathway. However, these short-
outperforming the required annual efficiency ratio by 8.1%.
term changes should not imply that we cannot achieve the long-term portfolio target, which is prevailing.
9 https://www.ing.com/Sustainability/Our-Stance/Energy.htm
ING Group Terra progress report 2020 12Contents Preface Introduction Our progress Sector deep-dives Sustainable Finance at ING Conclusion Governance annex Technical Annex Glossary
Regarding the former, Terra is first and foremost an inclusion-based strategy. ING green bond market and have one of the strongest sets of environmental and social risk
believes that we can make the most impact by supporting clients with our products policies in the industry, including our stance on coal.12 For detailed information on our
and services, while working with the banking sector to scale and leverage this sustainable finance strategy, products and services, see chapter IV below.
impact. To support client engagement, we’ve been road-testing client-level climate
alignment dashboards that provide in-depth analyses of how individual clients’ current This comprehensive set of policies, due diligence processes, ambitions and targets for
performance and future strategies compare to climate scenarios, peers and the risks as well as opportunity support us in our climate goals. However, it’s important
market.10 This facilitates more focused engagement with clients, which ideally leads to note one thing. While aligning with the Paris goals would mean reducing the CO2
to positive change and greater impact. However, it’s important to note that client intensity of our portfolios, it wouldn’t necessarily mean that CO2 intensity will be
engagement is a long-term strategy that can take more time than simply divesting. reduced for the global sector. Nor would it mean that ING itself would reduce emissions
Nevertheless, we believe client engagement will have more impact and be more in the real economy by not financing certain clients or sectors. This is not the claim we
effective as more and more banks adopt a similar approach.11 are making. Those companies may still exist, even if we aren’t the bank providing them
with finance.
In addition, while we engage with and encourage clients in their transition, we
acknowledge that, as a financier, we are merely a facilitator. They are ultimately the This is why we value an engagement-centred approach, supporting existing
leaders of their own change, and we can only help them realise their goals. The CO2 clients’ transition pathways, bringing about real change. In addition, we recognise
intensity of our portfolios is therefore also a reflection of the choices and strategies of that a challenge this big will be met only through a concerted multi-stakeholder
our clients as well as the economy from a global perspective. effort involving regulators, financiers, governments and consumers alike. For more
information on ING’s vision for engagement and impact, see the conclusion chapter.
As we move ahead with our strategies for steering, we will continue to be a leader in
sustainable finance, building on our track record of sustainability innovations like the
sustainability improvement loan. We are also maintaining our leading position in the TCFD recommendations and the Terra approach
Climate risk management and climate portfolio alignment are two very distinct
10 See technical annex for details regarding the client-level analysis and how we steer internally. Forward-looking data is not endeavours. The former focuses on reducing financial risks as a result of the climate
available for all sectors, for example Commercial and Residential Real Estate.
11 To test the effectiveness of engagement strategies versus. divestment strategies, our technical partner, 2DII, has launched transition or physical risks stemming from climate change. The latter seeks to
the Evidence for Impact Partnership to study the outcomes of these strategies over time. ING has been a member of this
proactively shift a portfolio to contribute positively to climate goals. Still, although
partnership since its launch in 2020.
12 https://www.ing.com/Sustainability/Sustainable-business/Environmental-and-social-risk-policies.htm different, they can also be complementary. A more climate aligned portfolio could
13Contents Preface Introduction Our progress Sector deep-dives Sustainable Finance at ING Conclusion Governance annex Technical Annex Glossary
be one that faces lower transition risks, for example. However, risk mitigation doesn’t In sum, the results of the Terra approach, powered by methodologies such as
ensure portfolio alignment, and an aligned portfolio is not inherently climate risk-free. PACTA and the SBTI SDA, are relevant to organisations reporting in line with the
Nevertheless, we do see our efforts within Terra as also supporting our efforts to follow recommendations of the TCFD as they provide insight into whether or not certain
the recommendations of the Task Force on Climate-related Financial Disclosures (TCFD). portfolios are aligning with climate scenarios. The insights also provide metrics for
Here’s how. target-setting and reporting, while also informing strategies within our sectors, as
presented in this paper.
The TCFD recommendations focus on providing disclosures around the governance,
strategy, risk management, metrics and targets related to climate risks and For an overview on climate risk management, please refer to our standalone report
opportunities. The Terra approach has facilitated disclosures on several of these that will be released later this year.
themes. In 2018, we formed a governance structure to manage our climate-related risk
and opportunities, where Terra is a set agenda item.
By going through the process of assessing each sector with the Terra approach, we’re
able to determine the CO2 intensity of each client and sector in scope. This has led to
sector-level discussions on suitable strategies to lower CO2 intensity according to the
goals of Paris, including relevant metrics and targets. We again aim for an integrated
approach.
Although Terra focuses on our alignment with climate scenarios and support of clients
and society to meet climate goals, it also provides relevant information on sectors
more prone to climate-change risks. This further informs our risk-management
strategies. It can be viewed as a proxy to transition risk as it can pinpoint under- or
over-exposure to low-carbon or high-carbon technologies. However, while Terra doesn’t
currently quantify financial risk, it can supplement financial risk metrics.
14Contents Preface Introduction Our progress Sector deep-dives Sustainable Finance at ING Conclusion Governance annex Technical Annex Glossary
3 Sector deep-dives
Power generation 16 Fossil fuels 21 Commercial real estate 29
Residential real estate 35 Cement 44 Steel 49
Automotive 56 Aviation 61 Shipping 66
15Contents Preface Introduction Our progress Sector deep-dives Sustainable Finance at ING Conclusion Governance annex Technical Annex Glossary
Power generation
• Our performance
• Our initiatives
• Sector outlook and challenges
• Next steps
16Contents Preface Introduction Our progress Sector deep-dives Sustainable Finance at ING Conclusion Governance annex Technical Annex Glossary
Power generation
Power generation Figure 2 Power generation decarbonisation pathway
Power generation
Power Generation ING vs.
pathway
Outstandings in scope €7.5 billion Global and OECD Decarbonisation Pathways -14.9%
600
kg CO2e / MWh
500
SDS Scenario Global
The power generation sector was responsible for 41% of all energy- 400
SDS Scenario OECD
related CO2 emissions in 2019.13 Power generation therefore remains 300 Market
200 ING Portfolio
central to the energy transition. While demand for electricity
100 ING Target
increased globally, emissions from the power generation sector Convergence Pathway
0
declined by 1.3% in 2019 with an emissions intensity decrease
of 2.5% up from 1% in 2018 thanks to an increase in low-carbon
generation of 5.6%. Despite two decades of growth in renewable
power generation and the emissions reductions seen in 2019, the Our performance
sector was globally not on track to align with the Paris goals, which ING’s power generation portfolio within the scope of Terra (€7.5 billion, including
requires an annual decline of 4% of total power generation emissions. Upstream
rooftop solar) is largely concentrated in OECDOil & Gas(approximately 90% of total
countries
outstandings) and, to a Absolute
lesser extent, in non-OECD
Financing regions
Trend Reduction (approximately 10%).
Pathway
The events of 2020, however, present a new picture, with low-carbon power poised
5,000
Outstandings (M€)
to break records in its share of global power generation, an expected 40% in 2020, In the chart above, ING’s power generation
3,986 3,883 portfolio is compared with the global
4,000
compared with an expected 34% for coal globally.14 While the pandemic has presented market and the SDS scenario pathways. For power generation,3,225 we display both the
unprecedented challenges and perils for society, we do see opportunities, particularly global SDS pathway and the OECD SDS pathway, which is slightly more ambitious than
3,000
ING portfolio
in the power sector, for society to build back better in the years ahead. And, at ING, we 2,000 ING Target
are ready to do our part in facilitating this. 13 https://www.iea.org/reports/tracking-power-2020
SDS Trajectory
1,000
14 https://www.iea.org/reports/the-covid-19-crisis-and-clean-energy-progress/power#abstract
0
17Contents Preface Introduction Our progress Sector deep-dives Sustainable Finance at ING Conclusion Governance annex Technical Annex Glossary
Power generation
the global SDS pathway. It is the more ambitious OECD pathway that has determined Our initiatives
our portfolio target (and convergence pathway). This is due to the concentration of our As we continued our significant support of renewable power generation in 2019, with
business within the OECD despite having a global business. However, as our portfolio 55% of our portfolio’s production being in low-carbon power generation, we have
may shift its concentration over time, it is relevant to show our portfolio in relation to made progress in supporting our clients’ and the sector’s energy transition towards the
both scenarios. carbon intensity milestones that mark the energy transition pathway set out by the
IEA’s Sustainable Development Scenario (SDS). The SDS for the OECD region requires a
In light of this, ING’s power generation portfolio continues to outperform the market carbon intensity of 137 kg CO2e/MWh in 2040, applying the emissions factors of 2DII.
and both scenarios and has also seen a significant reduction in CO2e intensity since
2018.15 This is largely because ING has continued its focus on renewable energy In order to further align with our set pathway and portfolio target, our strategy will
financing and a significant share of the portfolio is made up of low-carbon power continue to focus on the two main drivers: 1) continued strong support of renewable
generation exposure. We also continue to further reduce our coal power generation energy financing and 2) reducing our exposure to coal-fired power generation. The
financing in line with our commitment to reduce our exposure to coal-fired power and Terra insights enable us to track our progress and support clients as they transition
thermal coal mining to close to zero by the end of 2025.16 while making strategic choices in our own capital allocation.
For information on the power generation methodology applied, please see the PACTA ING is also committed to innovation in sustainable finance products. In 2019, ING’s
methodology paper, the Katowice Banks’ Credit Portfolio Alignment paper and the portfolio grew by €1.19 billion in financing renewable power. One notable transaction
Technical Annex in this report. was one in which ING was the Sole Mandated Lead Arranger for the first green loan in
ASEAN that is compliant with the Loan Market Association (LMA) and the Asia Pacific
Loan Market Association (APLMA) Green Loan Principles for a portfolio of rooftop solar
projects. This S$50 million loan, which is being used to finance an approximately
50MW portfolio of rooftop solar projects, will be developed and owned by Sunseap
Commercial Assets Pte. Ltd.17
15 ING’s Terra Progress Report 2019 reported an emissions intensity of 289 kgCO2e/MWh. However, we are updating and
restating this figure on the basis of more granular emissions factors and a refined application of the methodology
calculation. This results in a restatement of the base year emissions intensity. Applying these updates, the emissions
intensity of ING’s power generation portfolio in 2018 was 335 kgCO2e/MWh.
16 ING’s coal policy applies to both thermal coal mining and coal-fired power generation.
17 www.ingwb.com
18Contents Preface Introduction Our progress Sector deep-dives Sustainable Finance at ING Conclusion Governance annex Technical Annex Glossary
Power generation
Another notable project is Windpark Fryslân, a project that will be Europe’s largest
lake wind farm when completed. ING joined nine other European banks in this €700
million financing deal that will build 89 wind turbines with a total capacity of 382.7MW,
In facing the economic
generating electricity for close to half a million households.18
challenges caused by the
pandemic, we remain
Sector outlook and challenges
committed to supporting our
Impacts of the coronavirus crisis clients in their ambition to
While 2019 saw strong growth in renewable power generation, this is expected to slow accelerate the build-out
as a result of the coronavirus crisis, although less so for renewables than for fossil fuel- of renewable power generation
based power generation. The global pandemic has led to widespread lockdowns in capacity. To which the
order to contain the virus, resulting in an average monthly decrease in power demand continued decrease in the
of 20% for every month of full lockdown.19 Because renewables enjoy lower operating
carbon intensity of our
costs, have no fuel costs and benefit in most jurisdictions from some form of support,
this, together with reduced demand, contributed to an increase in the relative share of power generation portfolio is
renewables in the power sector to a record 40% in 2020.20 testimony.”
– Michiel de Haan, global head of
Despite a slowdown in new construction as a result of lockdown measures and supply Energy Sector, Wholesale Banking
chain disruptions, renewable power generation remains poised for growth – an
expected 6% in 2020. In many cases, the expectation is for projects to be delayed, not
cancelled, putting them back on track in 2021 once the pandemic subsides.21
18 www.ingwb.com
19 https://www.iea.org/reports/the-covid-19-crisis-and-clean-energy-progress/power#abstract
20 Ibid.
21 Ibid.
19Contents Preface Introduction Our progress Sector deep-dives Sustainable Finance at ING Conclusion Governance annex Technical Annex Glossary
Power generation
Several macro-economic factors, largely exacerbated by the pandemic, may slow or
impede some clients’ transitions and the further growth of renewables at the pace Next steps
needed to achieve the Paris goals. We see the following factors presenting a number of
challenges that could impede ING’s overall ability to meet the SDS scenario target over • ING will continue to work with clients to support their ambitions and strategies
its horizon: to transition in line with the Paris goals.
• We remain committed and are on track to reduce our exposure to coal-fired
• Global decline in power investments in 2020: as a result of the pandemic, power
power generation to close to zero by 2025.
investments are expected to decline by an estimated 10%, a stark reversal from the
expected 2% growth at the start of the year. Investment declines are expected to hit • We will engage with peers and other stakeholders to improve and refine our
coal and gas-fired generation more significantly than renewables, although renewables strategies continuously to measure, steer and report on progress in the power
are also impacted. Distributed (small-scale) solar PV in particular has seen a substantial sector.
decline as residential and corporate investment in installations has slowed.22
• We will continue to report transparently on our progress to meet our 2040
• Addressable market: in addition to the decline in investment, 95% of global portfolio target.
investment in the energy supply is undertaken or incentivised by governments.
Ignoring all other limiting factors (such as country suitability and credit risk and
return considerations) this greatly restricts the financing opportunity available for
funding by banks.23 This also makes government policies a critical lever in dampening
the impacts of the pandemic.
• There is also an increasing trend towards the use of other non-bank sources of
funding for these smaller projects (leasing, equity or crowdfunding), although still
driving forward the energy transition, which could negatively affect ING’s ability to
achieve its ambition with the Terra approach.
22 https://www.iea.org/reports/world-energy-investment-2020/power-sector
23 IEA World Energy Outlook 2019.
20Contents Preface Introduction Our progress Sector deep-dives Sustainable Finance at ING Conclusion Governance annex Technical Annex Glossary
Fossil fuels
• Our performance
• Our initiatives
• Sector outlook and challenges
• Next steps
21Contents Preface Introduction Our progress Sector deep-dives Sustainable Finance at ING Conclusion Governance annex Technical Annex Glossary
Fossil fuels
Fossil fuels Our performance
This report marks a number of firsts for ING in the upstream fossil fuels sector. This is
Fossil fuels the first year we disclose our upstream oil and gas and thermal coal mining portfolios
Outstandings in scope – upstream oil and gas €4.0 billion within the Terra Progress Report, and it marks a first for setting portfolio-level targets
for upstream oil and gas. As reported last year, we were not yet prepared to include
Outstandings in scope – thermal coal mining €70 million
fossil fuels in our 2019 Terra Report as the methodology was still under development.
We worked intensively over the last several months with our peers in the Katowice
Commitment and our partner 2DII to review a longlist of metrics and approaches. We
The fossil fuels sector comprises the coal, oil and gas sectors. Oil, gas reviewed a total of 10 indicators and eventually narrowed this down to three which
and coal are used globally in a wide variety of ways, including energy follow three key alignment pathways:
generation (mainly electricity, heating and transportation), and
1. An absolute reduction in fossil fuel financing
the production of plastics, steel, medicines, construction materials,
Carbon emissions must peak in 2020 and decrease at a significant rate according
fertilisers, and many other products. As such, the sector is vital to the to most below 2°C scenarios (e.g. the IEA SDS) if we are to meet the objectives of
functioning of the global economy, and its products are used daily the Paris Agreement. As a result, a net reduction in fossil fuel activities is advised for
by nearly the global population. Historically, the fossil fuels sector thermal coal, oil and gas, albeit at different speeds.
has provided the vast majority of the global primary energy supply.
2. A relative reduction in fossil fuel financing compared to low-carbon alternatives
Today, fossil fuels account for 81% of the global primary energy
In parallel, the fossil fuels sector portfolio combined with the power generation
demand. The burning of fossil fuels to create energy generates 65%
portfolio (reported separately) should demonstrate a transition from high-carbon
of global greenhouse gas emissions.24,25,26 to low-carbon and renewable energy production, aligned with the changes in the
energy financing mix over time set out in the IEA SDS transition pathway.
24 The 65% figure is calculated as the ratio between total 2018 CO2 emissions coming from burning fossil fuels as reported
from the IEA (https://www.iea.org/) over the total anthropogenic GHG excluding land use change as per provided references.
25 International Energy Agency World Energy Outlook (WEO), 2019.
26 Trends in global CO2 and total greenhouse gas emissions, PBL, 2019.
22Contents Preface Introduction Our progress Sector deep-dives Sustainable Finance at ING Conclusion Governance annex Technical Annex Glossary
Fossil fuels
Power Generation ING vs.
pathway
Global and OECD Decarbonisation Pathways
-14.9%
3. A transition towards lower-carbon fossil fuel extractive processes the portfolio financing trend indicator (below). We will steer our fossil fuel production
600
More comprehensive and comparable data on the GHG emissions of oil and gas portfolios in accordance with the scenario trends as a minimum for achieving
kg CO2e / MWh
500
production at well head and field level is now becoming available. This data can be alignment. In addition, ING plans to apply the energy financing mix indicator and is
SDS Scenario Global
400
used to steer the fossil fuels sector portfolio towards the companies which produce working towards publishing this in our next update. SDS Scenario OECD
at the lowest emissions intensity.27 300 Market
Figure200
3 shows ING’s portfolio and targets in accordance with the portfolio financing
ING Portfolio
ING Target
The table below describes the three indicators that support these three pathways. trend indicator
100 which applies the IEA SDS scenario production reduction trends
Convergence Pathway
as a proxy
0 for the rate at which portfolio financing should reduce. As such, ING is
Table 2 Fossil fuel indicators and alignment drivers as defined committing to reduce its financing to the upstream oil and gas sector by 19% by 2040
by the Katowice Banks and 2DII compared with 2019 levels.
Indicators Alignment drivers
Figure 3 Upstream Oil & Gas Financing Reduction Pathway
Portfolio financing trend Absolute reduction in fossil fuel financing
Energy financing mix Relative transition of the energy financing mix from high-carbon to low-carbon
and renewable energy production, aligned with the IEA SDS transition pathway
Upstream Oil & Gas
Emissions intensity Shift towards companies which produce at the lowest emissions intensity Absolute Financing Trend Reduction Pathway
5,000
Outstandings (M€)
3,986 3,883
4,000
While these three indicators have been identified by the Katowice Banks and 2DII as 3,225
viable means to demonstrate alignment, not all three indicators have reached the 3,000
ING portfolio
level of maturity required for reporting. In particular, the emissions intensity indicator 2,000 ING Target
requires further data maturity and better models for robust application. ING will 1,000
SDS Trajectory
therefore continue to work with peers, technical partners and the sector to refine this
0
approach for future application. In the meantime, ING is committed to reporting on
27 Credit Portfolio Alignment – An application of the PACTA methodology by Katowice Banks in partnership with 2DII.
23Contents Preface Introduction Our progress Sector deep-dives Sustainable Finance at ING Conclusion Governance annex Technical Annex Glossary
Fossil fuels
Figure 4 Thermal Coal Mining Financing Reduction Pathway
Our Terra commitment for fossil fuels is calibrated to the SDS. The SDS starts from
an assumption of Paris Agreement success in the mid-century and backcasts to the
present day. It sets out the energy transition pathway of what would need to be done Thermal Coal Mining
to achieve Paris Agreement alignment in the most realistic, economic and socially Absolute Financing Trend Reduction Pathway
80
responsible way.
Outstandings (M )
70
60
By committing to align our upstream oil and gas lending portfolio to the energy 50
ING portfolio
transition pathway (the changing future energy mix) of the SDS, we acknowledge that, 40 SDS Trajectory
as every year passes in which the global economy remains out of alignment with 30
ING target based on
the transition pathway, the future task of alignment within our own lending portfolio 20
coal policy
is likely to become ever more demanding. If the SDS transition pathway requires a 10
0
greater decline in oil and gas production, at a faster rate, that scenario will guide the
direction that ING will take.
Figure 4 shows the same indicator for our thermal coal mining exposure. However,
in line with ING’s policy to reduce our portfolio exposure to thermal coal mining (and Our initiatives
power generation) to close to zero by 2025, ING’s target is far more ambitious than the
ING has a long history of supporting clients in the energy sector across a range of
SDS scenario proxy.
activities, including conventional and renewable power generation, as well as the fossil
fuels value chain. Our client relationships, combined with our knowledge and expertise
in all aspects of the energy sector, enable us to anticipate and steer down the energy
transition pathway. From replacing fossil fuel power generation with renewable sources,
to developing new energy technologies and markets, to ensuring that where oil and
gas is required by other sectors of the global economy that cannot yet substitute it
with renewable or low-carbon alternatives, we focus on financing production with the
highest social and environmental standards.
24Contents Preface Introduction Our progress Sector deep-dives Sustainable Finance at ING Conclusion Governance annex Technical Annex Glossary
Fossil fuels
Following the Paris Agreement and our own strengthening of our commitment to
sustainability and action against climate change, we put in place new strategies,
policies and lending criteria for fossil fuels.
No energy company will be
Coal unaffected by clean energy
ING’s coal policy was significantly strengthened in 2017 by a commitment to reduce transition. Every part of the
our thermal coal-related lending exposure to close to zero by 2025 in a gradual and industry needs to consider how
responsible manner. This includes all thermal coal mining and related infrastructure as to respond. Doing nothing is
well as thermal coal-fired power generation. simply not an option.”
Upstream oil and gas – Dr Fatih Birol, IEA Executive Director
Credit assessments include a strong focus on environmental and social impacts, in The Oil & Gas Industry in Energy
in addition to production costs. By concentrating on low-cost production, we work Transitions, IEA, 2020
together with our clients to ensure that their businesses are resilient to the risk of
‘stranded assets’. More extensive and reliable data is now becoming available on the
emissions intensity of production at field level. We will use this to steer our client base
and lending exposure towards the low-emissions leaders.
Energy sector as a whole
A multidisciplinary team of renewables, utilities and oil and gas specialists is It’s essential to engage with external stakeholders on the energy transition while
leading our New Energy Technologies Initiative (NETI). The team works with clients, continuing to be selectively involved in the oil and gas value chain. ING energy sector
policymakers and industry platforms to address finance issues. These issues relate representatives have taken leadership roles in initiatives such as the UNEP FI Principles
to the commercial deployment of low, zero or net-zero carbon technologies such as for Responsible Banking’s Collective Commitment to Climate Action and the oil and gas
hydrogen, energy storage, and carbon capture utilisation and storage. working group of UNEP FI’s TCFD Pilot Project for Banks.
25Contents Preface Introduction Our progress Sector deep-dives Sustainable Finance at ING Conclusion Governance annex Technical Annex Glossary
Fossil fuels
Sector outlook and challenges Global outlook
The fossil fuels sector comprises coal, oil and gas. These fuels are used globally in
The Sustainable Development Scenario 30
a wide variety of ways, including energy generation (mainly electricity), heating
The SDS depicts an energy transition between now and 2040 with a starting point that
and transport, as well as in the production of plastics, steel, medicines, construction
considers several desired outcomes aligned with the below 2˚C goal, as well as the
materials, and fertilisers. As such, the sector is vital to the functioning of the global
energy-related elements of the UN Sustainable Development Goals.
economy, and its products are used daily by nearly all the global population.
Historically, the fossil fuels sector has been responsible for the vast majority of the
The SDS then works back from there to define the most environmentally, socially and
global primary energy supply. Today, fossil fuels still account for 81% of the world’s
economically efficient transition pathways that each energy-related sector will need
primary energy demand.28 Fossil fuel use accounts for 65% of global anthropogenic
to follow in order to achieve these goals. For the fossil fuels sector, this will mean a
GHG emissions, with electricity and heat production accounting for 31% of the global
number of changes:
total. While global CO2 emissions from all fossil fuels grew from 2018 levels, the power
sector accounted for over two-thirds of that growth.29 • Coal use declines steeply to around half of 2019 levels by 2050, due to transition in
the power generation sector, as gas and renewables become more cost-competitive.
Companies operating in the fossil fuels sector can be split into two main categories: However, it continues to be used in industry, mainly for the production of cement,
those active in the extraction of fossil fuels from the subsurface (upstream), and those iron and steel.
active in the transport, processing trading and marketing of fossil fuels (midstream
• Oil demand peaks within the next few years and then falls to 50 million barrels per
and downstream). The International Energy Agency (IEA) Sustainable Development
day (mb/d) in 2050 from close to 97 mb/d in 2019. The use of all oil declines steeply
Scenario (SDS) scenario focuses on fossil fuel demand and production levels over time.
for passenger cars (electric vehicle uptake), while the non-energy and non-emitting
Given this focus on the changes in future production volumes required for a successful
use of oil (e.g. plastic feedstock and asphalt) rises to 40% of overall final consumption,
energy transition pathway, we consider the upstream activities of the sector to be
according to the scenario.
most relevant for the future assessment of alignment with the SDS.
• Natural gas use increases until the late 2020s as it plays the role of a ‘transition fuel’,
replacing more polluting fuels alongside the growth in renewable sources and the
electrification of the economy. From the 2030s onwards, consumption of natural gas
28 International Energy Agency World Energy Outlook (WEO), 2019.
declines steadily, because its emissions intensity is too high to be consistent with the
29 Global Energy & CO2 Status Report, International Energy Agency, 2019.
30 World Energy Outlook, IEA, 2019. required future reduction in CO2 emissions.
26You can also read


