DALLAS URBAN HEAT ISLAND - Houston Advanced Research Center Prepared by
←
→
Page content transcription
If your browser does not render page correctly, please read the page content below

DALLAS URBAN HEAT ISLAND
DALLAS SUSTAINABLE SKYLINES INITIATIVE

Prepared by:
Houston Advanced Research Center
Prepared for
U.S. Environmental Protection Agency
March 2009
THE SUSTAINABLE SKYLINES INITIATIVE

The Sustainable Skylines initiative is a three-year partnership between the City of Dallas, the
U.S. Environmental Protection Agency, and the North Central Texas Council of Governments to
promote sustainability within the City via voluntary programs which emphasize air quality
improvements.

The Sustainable Skylines Initiative (SSI) at EPA provides a framework that, when implemented
in an area, can achieve measurable emissions reductions and promote sustainability in urban
environments. Under the SSI, an area can choose to perform projects from seven categories:
central city livability, stationary and area sources, energy and climate change, land use
transportation strategies, diesel engines emission reduction, green building and green building
development, and off-road/non-road sources (emission reductions).

                             HOUSTON ADVANCED RESEARCH CENTER
4800 Research Forest Drive • The Woodlands, Texas 77381 • http://www.harc.edu

HARC is a 501(c)(3) not-for-profit organization based in The Woodlands, Texas dedicated to
improving human and ecosystem well-being through the application of sustainability science
and principles of sustainable development. HARC's mission is to move knowledge to action to
improve human well-being and the environment.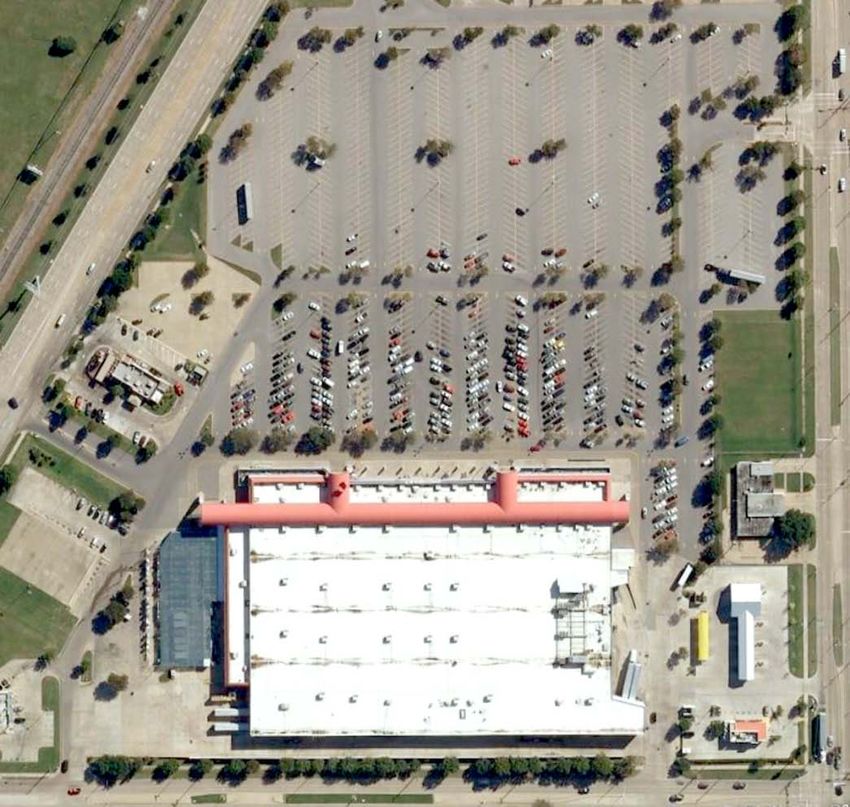
TABLE OF CONTENTS
Dallas Urban Heat Island Overview................................................................................................................................1
     The Dallas Urban Heat Island................................................................................................................................1
     Reducing Dallas Urban Heat Island Effects...........................................................................................................6
     Conclusions ...........................................................................................................................................................8
     Options for Urban Heat Island Mitigation...............................................................................................................8

Trees and the Dallas Urban Heat Island ......................................................................................................................10
     Executive Summary.............................................................................................................................................10
     Options for Dallas Trees: Summary.....................................................................................................................11
     Introduction ..........................................................................................................................................................14
     A. Tree Costs and Benefits.................................................................................................................................15
     B. Planting for Heat Island Reduction.................................................................................................................19
     C. Options for Trees and the Urban Canopy ......................................................................................................30
           1. Setting Goals..........................................................................................................................................30
           2. Consolidate Outreach and Education ....................................................................................................31
           3. Obtaining Urban Forest Management Data ...........................................................................................33
           4. Funding for Tree Planting and Conservation .........................................................................................35
           5. Incentives and Regulations ....................................................................................................................36

Cool Roofing and the Dallas Urban Heat Island...........................................................................................................42
     Executive Summary.............................................................................................................................................42
     Options for Cool Roofing Actions: Summary ......................................................................................................43
     Introduction ..........................................................................................................................................................44
     A. Thermal Effects of Roofing.............................................................................................................................45
     B. Cool Roofing Costs and Benefits ...................................................................................................................46
     C. Cool Roof Technologies.................................................................................................................................49
     D. Options for Cool Roof Actions........................................................................................................................50
           1. Increasing Awareness Through Outreach..............................................................................................51
           2. Policies to Encourage Cool Roofs..........................................................................................................53
           3. Incentives and Regulations ....................................................................................................................54

Cool Pavements and the Dallas Urban Heat Island .....................................................................................................56
     Executive Summary.............................................................................................................................................56
     Dallas Cool Paving Strategies and Actions: Summary ........................................................................................57
     Options for Cool Paving Actions: Summary.........................................................................................................58
     Introduction ..........................................................................................................................................................59
     A. Thermal Effects of Paved Surfaces ................................................................................................................60
     B. Costs and Benefits of Cool Pavements..........................................................................................................62
     C. Cool Pavement Technologies ........................................................................................................................70
     D. Cool Paving Strategies and Actions...............................................................................................................71
           1. Increasing Awareness Through Demonstration and Outreach ..............................................................71
           2. Policies for Parking, Medians, and Freeways ........................................................................................72
           3. Incentives and Regulations ....................................................................................................................73

Endnotes ....................................................................................................................................................................76
DALLAS URBAN HEAT ISLAND OVERVIEW
DALLAS SUSTAINABLE SKYLINES INITIATIVE: DALLAS URBAN HEAT ISLAND STUDY

This report was prepared       Many people understand from their own experience that cities are often hotter than rural areas.
as part of the Dallas          Research suggests a difference of 6 to 8ºF. As cities develop, trees and vegetated areas are
Sustainable Skyline            reduced, natural surfaces are paved, and buildings constructed. Together these changes
Initiative, a project of the   produce the “urban heat island effect” illustrated in Figure 1.
U.S. Environmental
Protection Agency.                                                     Figure 1. Urban Heat Island Effect

The report describes Dallas
urban heat island effects
and options that could be
implemented to help
reduce these effects.

                                   Dallas has recognized heat island concerns in plans and discussions, and there are several
                               references in the 2006 Dallas Comprehensive Plan, forwardDallas! The plan’s Vision mentions
                               the heat island effect as a component of policies to help ensure environmental stewardship.1
                               Heat island policies are also found in other sections of the plan.

                                   “Central to this Key Initiative is identifying, inventorying and protecting important natural resources, sensitive
                                   ecosystems, open spaces and cherished views. Included are policies to mitigate the urban heat island effect,
                                   improve storm water management within the city, reduce smog, expand the absorption capacity of floodplains
                                   and allow the restoration and rehabilitation of Trinity River riparian corridors.” (emphasis added)

                                  The Dallas Urban Heat Island Study examines how and where heat island effects occur in
                               Dallas and some of the basic tools for reducing impacts, such as expanded tree planting and
                               conservation, use of cool roofing, and application of cool and porous paving. The study
                               describes costs and benefits associated with these tools.

                               FORMATION OF URBAN HEAT ISLANDS
                               Urban heat island effects were recognized in the 19th century by climatologists who measured
                               differences in city temperatures and the countryside. Current urban development practices
                               often start with removal of trees and other vegetation. This reduces the cooling effects
                               provided by vegetation and moist soils. This also adds buildings, rooftops, and pavement that
                               absorb, store, and then radiate heat. In areas with tall buildings and narrow streets, heat can be
                               trapped and airflow reduced. In addition, waste heat from air conditioning, vehicles, and
                               industrial processes adds further to the city’s heat load.2

                               THE DALLAS URBAN HEAT ISLAND
                               An urban heat island is often thought to be a summer daytime event, but in reality its most
                               common occurrence is generally before sunrise (Figure 2). At that time, the difference
                               between urban and rural temperatures is often at its peak. There are two basic types of heat
                               islands: surface and atmospheric. Surface temperature differences occur primarily in the
                               daytime and can range from 18 to 27ºF. Atmospheric differences are primarily at night and
                               can range from 13 to 22ºF. A study of Dallas and Houston found that urban summer nighttime
                               temperatures (atmospheric) were almost 4ºF warmer than rural temperatures (averaged over
                               2000 to 2006). The greatest differences occurred around 6 a.m. During the day, urban
                               temperatures averaged almost 2ºF warmer.3 The same study showed that the Dallas daytime
                               heat island was more evident than Houston’s.

                                                                                         –1–
Table 1. Figure 2
LAND COVER AND HEAT
Average Land Cover in U.S. Cities
ABSORBING SURFACES
As land is urbanized, the
Surface Percent Temp Range ºF
size of the urban heat
Pavement 40% 120-140º
Roofs 22% 150-190º island often grows at a
Vegetation 26% 120-140º similar or faster pace. A
Other 12% na study of Houston
calculated that its surface
heat island increased in geographic coverage
by over 38% in the 15 years following the
mid-80s, expanding at a faster pace than
population growth.4
URBAN SURFACE CHARACTERISTICS
Pavement and buildings occupy over half of the developed surface areas of cities. As shown in
Table 1, pavement on average in U.S. cities covers 40% and rooftops 22%.
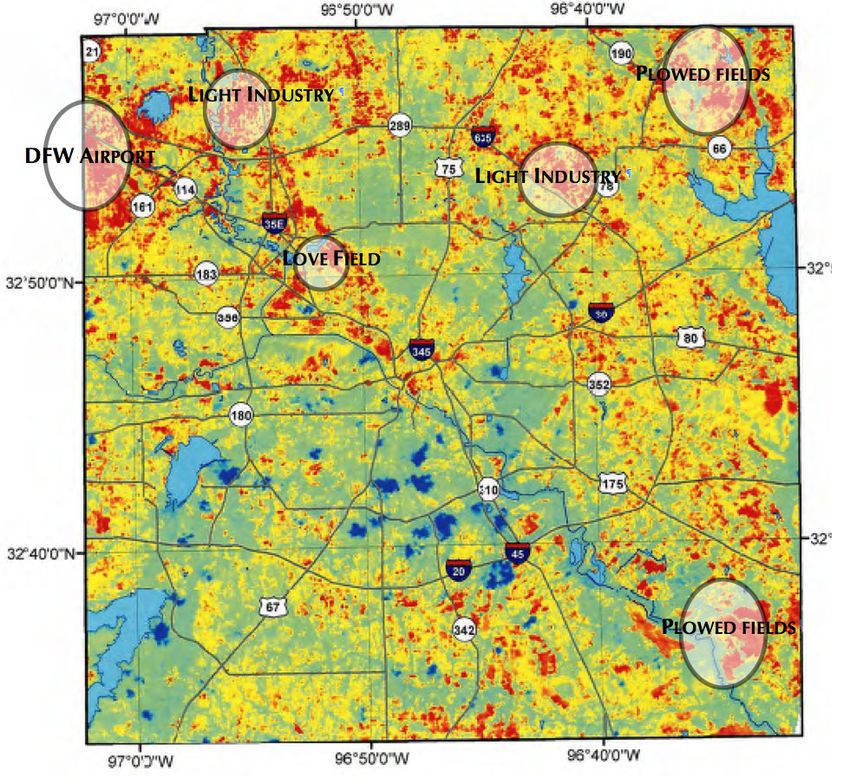
Commercial and residential areas shown in Figures 3 and 4 are examples of urban surfaces
in Dallas. The commercial area (Figure 3) consists almost entirely of pavement and rooftops
with an average area surface temperature of 140ºF (from thermal analysis
Figure 3. Dallas commercial site in this study).
Two adjacent single-family residential areas developed more than 50
years apart illustrate how tree cover changes over time in urban
development. The area on the left was developed in the last three to five
years and the other area over 50 years ago. The older area has extensive
tree cover, narrower streets (less pavement), and more areas suited for
tree cover (larger lots, deeper setbacks). Both areas have alleys and
sidewalks.
IMPACTS OF URBAN HEAT ISLANDS
Higher temperatures add to the critical challenges facing Dallas, including
rising energy costs, air quality, and health. Higher temperatures require
more electricity for air conditioning, with the highest summertime
temperatures coinciding with peak electricity demand. For Dallas, the
cost of additional electricity from urban heat island effects likely amounts
to several hundred million dollars per year based on estimates for other
cities.5 Widespread heat island mitigation measures, such as cool roofs
and extensive tree planting, could produce energy savings of $40 to $50
million annually.6 These savings would be offset
Figure 4. Newer and older single family residential areas in Dallas
somewhat by the costs of implementing these measures,
but the net benefit would be substantial.
Higher temperatures are also associated with higher
levels of ozone, the key pollutant of concern for the
Dallas-Ft. Worth area.7 Higher temperatures also
increase evaporative emissions of volatile organic
compounds, such as gasoline, while forcing biogenic
emissions from trees to higher levels.8 VOCs are a key
ingredient in ozone formation. Estimates from the heat
island Mitigation Impact Screening Tool (MIST) suggest
that a 1ºF temperature reduction could reduce ozone by
as much as 1.2 parts per billion (ppb), equal to 1.6% of
the new federal 8-hour ozone standard of 75 ppb.
Higher temperatures, particularly during heat waves,
are of concern for human health. Heat related illnesses
occur during such events, even in Texas where there is
more adaptation by people and buildings to higher
temperatures than in cooler climates. Dallas
experienced extended heat waves in 1980, 1996, and
–2–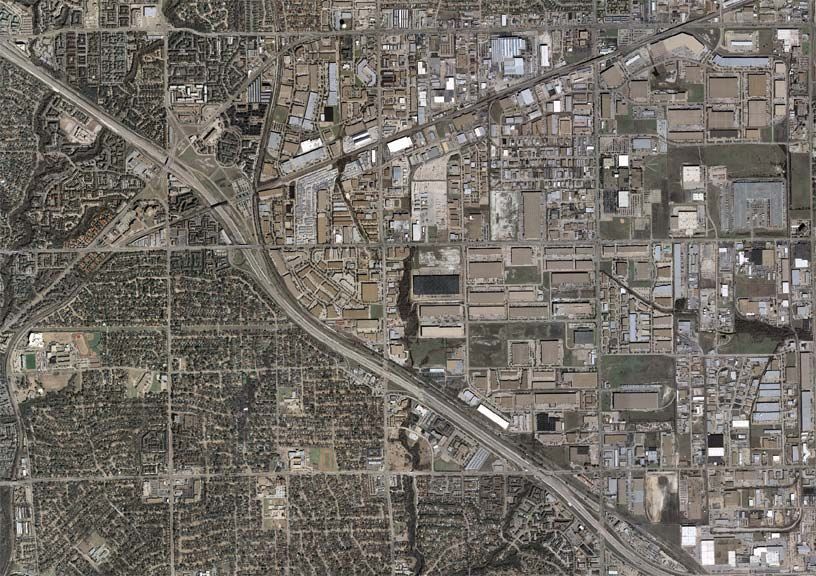
1998 with several weeks of 100º and higher temperatures. Accompanying increases in heat
                              related health impacts included at least 23 reported deaths in the 1998 event.9
                                  Reducing urban heat island effects can reduce these impacts while providing other benefits.
                              For example, adding trees helps cool the city and, at the same time, assists in the control of
                              urban runoff, improves the quality of life, sequesters carbon emissions, and contributes to
                              human well-being. Cool roofs help cool the city by reflecting solar radiation, and can pay for
                              themselves quickly through energy savings, particularly for older, less energy efficient
                              buildings. The “cooling impacts” of such roofing are essentially free at the same time that the
                               economic viability of the building is improved.
Dallas Air Quality
                                                                                  Figure 5.
Ozone is formed in the                        Scatter plot of daily 8-hour peak ozone over the Baltimore Non Attainment Area
atmosphere by                                    versus the daily maximum temperature at BWI Airport for 10
                                                                                                            the year 2002
                                                                  (May-September, N=138, Tmax ≥ 70ºF).
interactions of volatile
organic compounds
(VOCs) and oxides of
nitrogen (NOx).

Sunlight and heat are
part of this equation, with
higher temperatures
often producing higher
concentrations of ozone.

                              DALLAS SURFACE TEMPERATURES
                              The most prominent high surface temperature areas as shown in Figure 8 include: (1) an area
                              extending northwest from downtown Dallas northwest along the Stemmons Freeway, (2) the
                              two major airports, DFW and Love Field, and (3) several large industrial and warehousing
                              areas. There are also large outlying areas where bare soils reach high temperatures during the
                              day (large, plowed unplanted agricultural areas). It may seem surprising that central Dallas
                              temperatures are lower than some of the outlying areas. This illustrates one of the differences
                              between surface temperatures, which are time-specific and localized, and the urban heat island
                              effect, which is a more complex phenomenon that includes surface temperatures as one
                              component. Surface temperature imagery used in this report provides a useful indicator of
                              urban heat island conditions.
                                  Higher surface temperatures in the warmest part of the day will be found wherever
                              exposed, unshaded pavement and rooftops exist. Some paved surfaces and rooftops cool more
                              quickly after sunset than vegetated areas due to their thermal properties, such as emissivity (the
                              ability of a material to release heat energy) and thermal mass. Surfaces may release heat more
                              quickly after the energy source (the sun) is gone (after sunset). In addition, horizontal and
                              vertical air movement affects overall temperatures.
                                  The cooler daytime surface areas are due primarily to the Dallas urban tree canopy and
                              wetter areas along waterways, such as the Trinity River and all of its tributaries. In general,
                              the more tree cover, the cooler the daytime surface temperatures. Areas with older, larger trees
                              do not reflect a great deal of solar radiation, but shade surfaces that would otherwise absorb
                              and store this energy. In comparison, the air temperature in heavily vegetated urban areas (as
                              opposed to surface temperatures) may stay somewhat warmer during nighttime in the summer
                              due to reduced airflow.
                                  At a more detailed level (Figure 7), hotter surface temperatures can be found throughout
                              the city. These occur in association with commercial areas, schools, and even parks. These
                              smaller “hot spots” exist wherever large exposed expanses of heat absorbing surfaces are
                              found.

                                                                                   –3–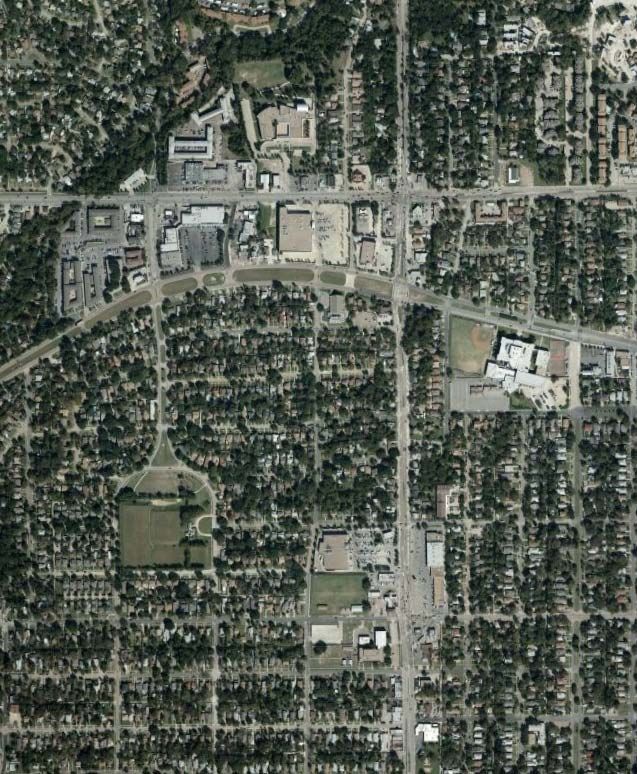
Figure 6
  Dallas Tree Canopy/Dallas County
                                                                                                   SURFACE COVER IN DALLAS
                                                                                             These two maps illustrate the major
                                                                                             features of Dallas that affect the urban
                                                                                             heat island – impervious surfaces such
                                                                                             as paving and rooftops, and the tree
                                                                                             canopy.

                                                                                                    Concentrated Tree Cover

                                                                                            Residential Neighborhood

                                                                                            Area Parks

                                     Figure 7. Impervious Surfaces
                                     These surfaces cover 15.5% of the area within the Dallas city limits.

          Concentrated Areas of
           Impervious Surfaces

Retail Center

Industrial Area

                                                                              –4–
Larger high
 temperature
 areas are
 labeled
 including
 airports, light
 industry areas
 and barren
 soil/plowed
 fields.

                                                                     Figure 8
                                                       DALLAS SURFACE TEMPERATURES
                                     Kinetic Thermal Corrected Aster Image – September 28, 2006, 5:25 pm

This thermal image of Dallas County surface temperatures was developed from 2006 ASTER satellite imagery . The hotter surfaces, shown in
red, range upwards above 150ºF. The light blue-green areas are cooler, more vegetated areas, as seen along the Trinity River Basin. The dark
blue areas are cloud cover that was present at the time the images were taken.

                                              SURFACE TEMPERATURES AND AIR TEMPERATURES
Air temperatures are usually measured at about 5 feet above the ground, where standard weather observations are gathered, such as DFW
International or Love Field. There are not enough locations in most cities to adequately measure the variety of temperatures that occur across
the city. Surface temperatures from satellite data show a snap shot in time of various surfaces, particularly flat, horizontal surfaces of rooftops
and pavement. Some surfaces, such as barren soil and plowed agricultural land have high temperatures, but change rapidly as crops are grown
or soil moisture changes.

                                                                                        –5–
REDUCING DALLAS URBAN HEAT ISLAND EFFECTS
                         “Everyone talks about the weather, but no one does anything about it.” When Charles Dudley
                         Warner, the 19th century author made this statement, he was likely unaware of how urban
                         climates have been altered. Urban heat island effects include not only higher temperatures, but
                         also rainfall locations and patterns, windflow, and moisture levels.
                             Heat island effects are primarily due to the way cities are built and the key surface
                         characteristics. Urban surfaces can be changed to reduce these effects. The primary ways of
                         accomplishing this are:

                                                SURFACE CHANGES REDUCE URBAN HEAT ISLAND EFFECTS
                                   Trees        Substantially increased tree cover and vegetation to provide shade and
                                                natural cooling due to evapotranspiration

                                   Cool Roofs   Use of roof surface that reduce heat absorption through higher reflectivity
                                                or with green roofs

                                   Cool         Use of pavement surfaces that are more reflective or that minimize
                                   Pavements    impervious surfaces

                                There are other approaches being analyzed, such as reducing waste heat from air
                            conditioning or industrial processes. Even reducing motor fuel use (gasoline and diesel)
                            reduces heat that is generated by car and truck engines. From an efficiency and engineering
                            standpoint, waste heat is energy that could have been used for more beneficial purposes than
                            making the city hotter.
                                Fortunately Dallas has already recognized many of the principles of urban heat island
                            mitigation in its plans and regulations.
                                Changing a city’s overall temperature is challenging and requires a longer term view and a
                            thorough consideration of the additional benefits that result from mitigation measures. As an
                            example of the magnitude, a multi-city study estimated that almost one million additional trees
                            would be needed in the Dallas/Ft. Worth region to reduce the hottest areas by 1ºF.11 However,
                            based on a per capita distribution of such planting, the Dallas portion would be smaller. In
                            addition, the time frame for expanding the Dallas tree cover would need to be considered, such
                            as adding trees over a five-year period or setting an equivalent annual tree planting goal.
                            Urban heat islands have been created over decades, and solutions will also take time.
                                Technologies and methods are available for the most part. Trees provide an effective
                            strategy that is welcomed by most. The effects of trees are fairly well understood, they are
                            commonly used, and they are available today. In addition, trees offer many other economic
                            and community benefits, summarized below.
                                Cool roofing technologies exist for many building applications. This includes highly
                            reflective roofing as well as newer roofing products that increase reflectivity through changing
                                                         pigment chemistry to reflect infrared rays in the solar spectrum.
Trees are embedded as a singular feature throughout the  Green roofs/rooftop gardens are also attractive for many
Dallas Comprehensive Plan, forwardDallas!.               applications, although less common in the U.S.
                                                             Cooler, more reflective pavements are already in common use
                                                         in Dallas, and there are ways of improving their effectiveness
                                                         further. Many types of porous or permeable pavement materials
                                                         are also available that provide unique attributes to help cool the
                                                         city while managing stormwater runoff. Engineers and developers
                                                         are not as familiar with porous paving materials as with more
                                                         commonly used pavements. There is less field experience that is
                                                         needed to help overcome uncertainties about such materials.

                                                      INCREASING THE DALLAS TREE CANOPY
                                                      Dallas has a large and vital tree canopy, and conditions for tree
                                                      growth are good in most parts of the city, as evidenced by existing
                                                      tree cover. However, much of today’s urban development and
                                                      redevelopment begins with clearing tree cover and vegetation.
                                                      Trees are an effective and inviting addition for Dallas, while
                                                                              –6–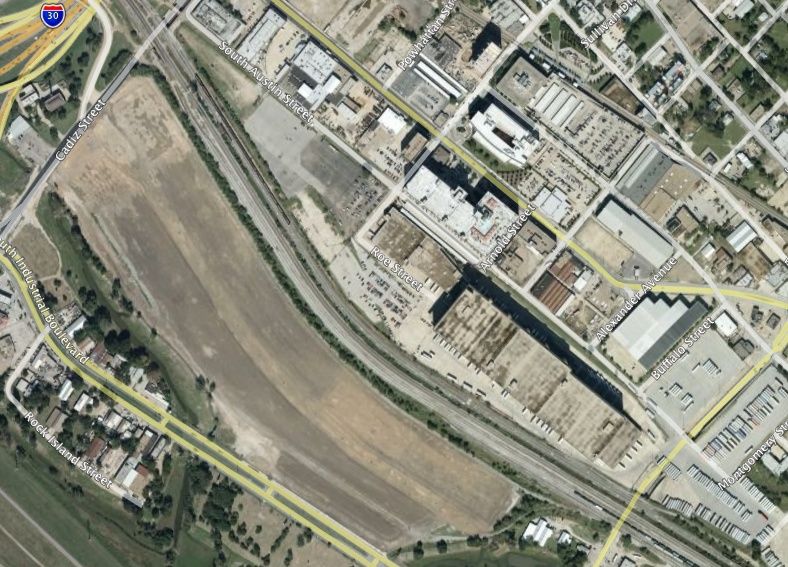
helping to counteract urban heat island effects. The challenge is
Figure 9: Dallas School with Cool Reflective Roof         to increase tree cover, while also conserving and protecting the
                                                          existing canopy.
                                                              Dallas is currently planting, protecting, encouraging, and
                                                          requiring trees as part of the urban environment. This report
                                                          outlines additional options that can be considered for enhancing
                                                          the Dallas tree canopy. Air temperature data collected across the
                                                          city in Portland, Oregon found that “the most important urban
                                                          characteristic separating warmer from cooler regions was (tree)
                                                          canopy cover, regardless of day of week or time of day.” 12

                                                             IMPLEMENTING COOL ROOFS AND GREEN ROOFS
                                                             Roof surfaces play a large role in heat island mitigation since
                                                             they cover 20 to 30% of development, and they reach higher
                                                             temperatures than other surfaces. In commercial and industrial
                                                             areas, these percentages are even higher. Residential roof surfaces
                                                             play an important role since they can account for more than half
                                                             of the total roofing area.
                                                                 Roof colors and the type of roofing material have the greatest
                          effect on roof temperatures, which rise to more than 150ºF. on clear days. The added thermal
                          load on air conditioned buildings can increase demand for electricity, produce higher peak
                          demand from the electric power grid, and possibly accelerate deterioration of the roof and
                          rooftop equipment.
                               Cool roofing materials widely available today are highly reflective and installed primarily
                          on low-slope (flat) roofs. Dallas has included cool roofs in recent building code revisions
                          aimed at environmental and energy improvements. There are also cool roof products for
                          sloped roofs, including various tiles, coated metal roofing, and, more recently, reflective
                          asphalt shingles. California has incorporated cool roofs into its statewide building code for
                          low-slope roofs, and is considering requirements for sloped roofing, which would affect the
                          residential roofing market.
                               Green/garden roofs incorporate vegetation into the roof assembly. A green roof cools the
                          building by shading the roof membrane, which keeps out moisture, and also cools the roof
                          through evaporating moisture from plants and the engineered soils holding the plants. Water
                          quality and management have been the primary driving forces for green roofs in U.S. cities and
                          in Europe. Energy savings and building standards are becoming more important in this regard.
                               Due to repair or replacement, low-slope roof surfaces are replaced or substantially changed
                          as often as every ten to fifteen years. Maintenance can include changes in surface color and
                          reflectivity over even shorter intervals of five to six years. As such, changing most roof
                                                                    surfaces is achievable in a ten to fifteen year period.
  Figure 10. Open mesh porous paving supporting vegetative cover
                                                                    Older, less energy efficient buildings particularly benefit
                                                                    from cool roofing energy savings.

                                                                 CHANGING PAVEMENT SURFACES: COOL PAVING
                                                                 Paved surfaces are the largest portion of urban surfaces,
                                                                 averaging 40% in U.S. cities. This includes streets and
                                                                 roadways, but also parking, driveways, sidewalks and
                                                                 other impervious surfaces. Most paved surfaces change at
                                                                 less frequent intervals than roofing, but cool paving can be
                                                                 incorporated in new development or possibly as
                                                                 maintenance occurs. Some paving maintenance and
                                                                 resurfacing occurs at more frequent intervals, providing
                            additional opportunities for creating cooler pavement surfaces. Redevelopment can also
                            include changes to parking design and characteristics.
                                Cool paving technologies have a more reflective surface and may also include permeable
                            pavements, which allow water to flow through creating a cooler surface. They can include
                            cement or asphalt concrete paving and overlays, and many types of pervious/porous paving
                            products.
                                Reflective pavements that use lighter color aggregates or bonding agents can be 15% to
                            30% more reflective. They can reduce surface temperatures by more than 20ºF. However,
                                                                            –7–
higher reflectivity also reduces
Figure 11. Chip Seal Overlay with Reflective Aggregate Figure 12. Porous
nighttime lighting requirements for pavement
streets and parking areas.
Pervious, cool paving products
are made from conventional
cement and asphalt sources, but
also include a wide variety of other
technologies that include pavers,
structural meshes, turf, and gravel.
Pervious paving allows water to
drain through, slowing its
movement and helping to control
urban runoff. It may also improve runoff water quality in other
ways, such as reducing the temperature of runoff. If used as
part of an area’s drainage system, pervious paving may reduce
the amount of impervious surface needed for stormwater
detention.
CONCLUSIONS
Dallas has an urban heat island problem that contributes not only to higher temperatures, but
also problems of energy use, air quality, human health, and the quality of life. Dallas has
recognized these problems and incorporated provisions in plans and regulations to help
mitigate heat island effects.
Dallas has available mitigation measures and technologies that include acceptable
strategies for adoption, demonstration, and testing. These include:
• Expanded use and care of trees and vegetation that help cool and green the city
• Cool and green roofs that produce energy savings for the Dallas economy while
helping to address air quality concerns
• Paving strategies that can reduce solar energy gain, implement various LEED
standards, and address stormwater issues
The benefits to Dallas of these measures need to be meshed within a longer term view that
incorporates several policies. Dallas leaders already understand from air quality experience
that there are no simple quick-fix solutions. Heat island effects are created incrementally year-
by-year over decades and more. Similarly, mitigation measures require systematic actions
year-by-year to reverse.
OPTIONS FOR URBAN HEAT ISLAND MITIGATION
The following page briefly summarizes options that can be applied to mitigate Dallas urban
heat island effects. Detailed descriptions of these options are included beginning on the pages
referenced with each set of options.
–8–OPTIONS FOR TREES AND THE URBAN FOREST – PAGE 30
GOALS
• Establish an overall target for tree planting, such as the “Million Trees” initiatives organized in other cities
OUTREACH AND EDUCATION ACTIVITIES
• Consolidate existing information on city-based tree and urban forest activities within a common
framework, such as a new tree planting initiative
• Actively include organizations outside of city government in achieving tree planting and conservation
goals.
URBAN FOREST MANAGEMENT DATA
• Initiate an on-going tree inventory program to establish baseline data
• Launch an urban forest analysis project
FUNDING FOR TREE PLANTING AND CONSERVATION
• Increase the Dallas Reforestation Fund to leverage additional tree planting and conservation
• Establish capital improvements set-asides for tree planting and landscaping on public projects
• Support establishment of a utility-based, energy savings program to encourage tree planting on private
property
REGULATIONS AND INCENTIVES
• Include tree planting and conservation in future State Implementation Plans (SIP) as a voluntary control
measures
• Modify landscape and tree preservation ordinances to protect larger trees, increase tree placement, and
increase trees planting during development
OPTIONS FOR COOL ROOFING ACTIONS – PAGE 50
OUTREACH
• Inform target audiences of cool roof requirements as part of Phase 1 of the Green Building Program
• Through outreach efforts, emphasize the use of cool roofing for all re-roofing of low-slope buildings
• Showcase existing green roofs for their energy and stormwater management benefits
COOL ROOF POLICIES
• Encourage other entities in the region to adopt cool roof requirements and standards
• Consider inclusion of Energy Star cool roof standards for sloped roofs (25% or greater solar reflectance)
INCENTIVES AND REGULATIONS
• Include cool roof requirements in the Green Building Program for re-roofing
• Encourage electric utilities to provide cool roof rebates as part of their energy efficiency requirements
• Create specific provisions in building codes for green roofs
• Use stormwater fees to fund demonstration projects for public sector greenroofs and porous paving
• Support explicit inclusion of cool roofs in the State’s energy code
OPTIONS FOR COOL PAVING ACTIONS – PAGE 71
DEMONSTRATION AND OUTREACH
• Foster and support cool paving demonstration projects
• Create a database of existing cool paving applications to illustrate current uses
• Provide cool paving product workshops for staff, developers, and builders
POLICIES
• Create a unified cool paving policy that applies to parking, street medians, and freeways. Incorporate
existing policies including:
o Comprehensive Plan – forwardDallas!
o Green Building Program
o LEED Rating System provisions
o Landscape Ordinance
o Storm Water Management
INCENTIVES AND REGULATIONS
• Provide points in the Green Building program for cool paving
• Ensure supportive provisions in stormwater management regulations
• Add provisions to the zoning ordinance to limit impervious surfaces
–9–TREES AND THE DALLAS URBAN HEAT ISLAND
DALLAS SUSTAINABLE SKYLINES INITIATIVE: DALLAS URBAN HEAT ISLAND STUDY
EXECUTIVE SUMMARY
Trees help cool the city and, in many parts of Dallas, they are the defining
feature. Dallas citizens and leaders are well aware that trees provide
important benefits to the city and are a valued asset.13 For example,
forwardDallas!, the City’s comprehensive plan adopted in 2006, includes
trees as a singular feature throughout. In some ways, however, unless trees
are threatened, they can be taken for granted.
We know from research that trees add
value to property; that human health Dallas residents say
responds positively to trees and greenspace; what they want to
forwardDallas! Vision that people prefer shopping areas with good
cooler and greener change most in the
landscapes and vegetation; and that trees are
city is its appearance
an important part of the Dallas quality of
life.14 We also know that areas without trees — they want it to look
can be substantially hotter. beautiful, with trees
This report identifies the role that trees and pedestrian-
play in cooling the city; it quantifies the friendly
benefits; and it sets forth actions to reduce
neighborhoods.
the urban heat island effect through
expansion and protection of the Dallas urban
tree canopy. forwardDallas! Neighborhood
Elements, 2006, p. II-7-1.
Dallas has a vibrant tree canopy over
Mature Trees much of the city, but there are many areas
that can be targeted for improvement. Like most growing cities, the Dallas
tree canopy is continually challenged by new development and
redevelopment. In addition, older and unhealthy trees are lost over time and
not fully replaced.
To keep Dallas cooler while capturing the benefits of urban tree cover, the
following conditions are needed:
• Identifying new planting areas
• Targeting of area hot spots
• Protecting the existing canopy.
• Adequately replacing trees lost as the city continues to grow
COSTS AND BENEFITS
The net benefit of trees has been found to outweigh the cost by as much as
Dallas surface temperatures 2006 three to one. The net annual benefits of street trees have been estimated to
range from $30 to $90 per tree.15 The initial cost of planting new trees can be
substantial, ranging from $200 to $400 per tree (Table 8). Cities also incurs costs such as
pruning, removal/disposal, litter management, liability, administration and inspection.
Planting costs for tree programs are often shared among property owners, neighborhoods,
businesses, and other governmental bodies. The Dallas reforestation fund, the MOWmentum
program, and the emerging Adopt-A-Median program are examples.
Economic benefits of the Dallas urban tree canopy are substantial. Studies of other cities
suggest the benefits amount to several hundred million dollars annually.16 This includes
benefits such as energy savings, carbon storage, air quality improvements, human health,
quality of life, and stormwater management. Loss of trees in the city also means loss of these
benefits, making maintenance and reforestation essential.
– 10 –OPTIONS FOR DALLAS TREES
There are many actions that can be taken for tree planting and conservation.
These are described in detail within this report and summarized to include:
GOALS
• Establish an overall target for tree planting, such as the “Million
Trees” initiatives organized in other cities
OUTREACH AND EDUCATION ACTIVITIES
Tree Lined Residential Area • Consolidate existing information on city-based tree and urban
forest activities within a common framework, such as a new tree
planting initiative
• Actively include organizations outside of city government in
achieving tree planting and conservation goals.
URBAN FOREST MANAGEMENT DATA
• Initiate an on-going tree inventory program to establish baseline
data
• Launch an urban forest analysis project
FUNDING FOR TREE PLANTING AND CONSERVATION
Downtown Tre es • Increase the Dallas Reforestation Fund to leverage additional
tree planting and conservation
• Establish capital improvements set-asides for tree planting and
landscaping on public projects
• Support establishment of a utility-based, energy savings
program to encourage tree planting on private property
•
REGULATIONS AND INCENTIVES
• Include tree planting and conservation in future State
Implementation Plans (SIP) as a voluntary control measures
• Modify landscape and tree preservation ordinances to protect
larger trees, increase tree placement, and increase trees planting
during development
Dallas area tree cover
– 11 –Figure T1.
DALLAS URBAN TREE CANOPY
This image of the Dallas County tree canopy was developed from 2006 satellite imagery (green) and higher resolution regional land
cover data (blue). Concentrations of trees are found in and around the waterways, creeks, and streams, particularly in the southeast
and southwest areas. Developed corridors heading northwest out of downtown have relatively little tree cover.
Within the city limits of Dallas there is an estimated 26.2% tree cover, roughly 90 square miles (footnote 50). Based on estimates
from other studies, the canopy likely includes more than 15 million trees with many of these located along the area’s watersheds
(footnote 51). An assessment of the Dallas urban canopy would provide more accurate measures of the number of trees, species,
sizes, and economic value.
– 12 –Figure T2
HOW TREES COOL THE CITY
Tree shade reduces surface temperatures by blocking the sun’s rays,
preventing roofs, walls, and paving from absorbing this heat. Roof and wall
surfaces have been shown to be cooled by 20 to 45ºF.17 A car parked in the HOW MUCH COOLING FROM TREES?
shade can have interior temperatures that are cooler by 45ºF.18 Tree shade and transpiration combine to lower air temperatures in
Temperatures in large parks can be 5 to 10ºF cooler than other parts of the and around urban areas.
city. We are cooler in the shade for the same reason; trees are blocking the
sun from our skin and clothing. • Peak air temperatures in tree groves that are 9ºF (5ºC)
cooler than over open terrain.
In addition to cooling through shading, trees cool the city through • Air temperatures over irrigated agricultural fields that are 6ºF
“transpiration”, a process similar to our own perspiration that cools our (3ºC) cooler than air over bare ground.
bodies. Trees draw water through their roots which is eventually released • Suburban areas with mature trees that are 4 to 6ºF (2 to 3ºC)
through the leaves. One large tree can transpire thousands of gallons of cooler than new suburbs without trees.
water per year. • Temperatures over grass sports fields that are 2 to 4ºF (1 to
2ºC) cooler than over bordering areas.
Trees also affect wind speed and flow. A stand of trees may block or redirect
the wind. While the cooling effect of breezes may be diminished somewhat, Reducing Urban Heat Islands: Compendium of Strategies: Trees
trees may be located so that they direct windflow into area for cooling. and Vegetation, see http://www.epa.gov/heatisland/
Figure T3
Kinetic Thermal Corrected Aster Image – September 28, 2006, 5:25 pm
DALLAS SURFACE TEMPERATURES
Some of the larger high
temperature areas are
labeled including
airports, light industry
areas, and barren
soil/plowed fields.
This thermal image of
Dallas County surface
temperatures was
developed from 2006
satellite imagery. The hotter
surfaces, shown in red,
range upwards above
150ºF. The light blue-
green areas are cooler,
more vegetated areas, as
seen along the Trinity River
Basin. The dark blue areas
are cloud cover that was
present at the time the
images were taken.
– 13 –INTRODUCTION
Trees are a valuable Dallas asset and without them the city would be several degrees hotter.
The following section features of the Dallas tree canopy as it pertains to the urban heat island
effect.
A. TREE COSTS AND BENEFITS
Trees in Dallas provide many benefits to the city. This section briefly describes the economic
and other contributions that trees provide, as well as costs associated with future planting and
maintenance of the urban forest.
B. PLANTING TREES FOR HEAT ISLAND REDUCTION
Trees may be planted in ways that provide the greatest level of benefits. This includes
locations that shade buildings or parking surfaces, and added tree cover in areas that are
predominately pavement and rooftops (e.g., commercial and industrial areas).
“Plantable areas” are identified as they occur in various types of developments. Those
examined here include single and multi-family housing, neighborhood tree cover, various
types of retail, office clusters, industrial/warehousing areas, and school sites.
C. OPTIONS FOR HEAT ISLAND REDUCTION
This section sets forth details of ten key options that can consider for use in Dallas for heat
island mitigation through expanded tree planting and conservation.
• People need trees and green space.
Gabriel Barbie-Mueller, CEO Harwood International, D-Magazine, 12/14,07
• Planting trees can reduce traffic-related pollution and lessen solar impact and
energy demands.
Michael Hellman, Dallas Park an Recreation Department, D Magazine, 12/14/07
• Trees contribute to cleaner air, cleaner water, cooler temperatures and many
more benefits. Every person can make a difference.
Dallas green website, www.greendallas.net
Dallas thermal image Dallas tree cover Trees in new and older areas
– 14 –A. TREE COSTS AND BENEFITS
Trees in Dallas have a cost. Governmental entities (city, county, and state)
and private property owners pay these costs whether for initial planting or
ongoing costs of pruning, pest and disease control, and irrigation. Other
costs to local government can include administration, liability, root damage,
trimming, and stump removal. For trees on private property, costs are
generally borne by property owners.
COSTS OF PLANTING NEW TREES
The direct cost of planting new trees includes the purchase cost of the tree,
Trees and DART Light Rail delivery, and planting. In reviewing tree planting programs in various cities,
direct costs range widely with a typical range of $200 to $400 per tree (Table
8). A tree in such programs would have a 1.5” to 2” caliper (tree diameter at
breast height) and be 10’ to 12’ tall. Costs and other factors from two major
tree organizations in Texas are shown in Table 1.
Planting costs for seedlings are much lower, but require more growing
time to reach an equivalent size. Other expenditures are needed for on-going
conservation and protection of urban trees. From these estimates, it is easy
to see that goals set by major U.S. cities for planting millions of trees
requires many participants, effective strategies, and sufficient funding.
Table T1
EXAMPLES OF TREE COSTS
FROM TREE ORGANIZATIONS IN TEXAS
COST FACTORS (2006)
Trees and Shade Downtown $35/tree
TEXAS TREE FOUNDATION DALLAS $4/mile for delivery
http://www.texastreesfoundation.org $20/tree for planting with $200 minimum
1.5” to 1.75” caliper
8-10 ft
COSTS (2006) SIZE
TREES FOR HOUSTON $150 15 gallon
Includes planting and tree cost $300 30 gallon
http://www.treesforhouston.org $675 65 gallon
$1,150 100 gallon
Urban Greenspace and Trees COSTS OF TREE CONSERVATION, PROTECTION AND MAINTENANCE
The loss of existing trees is also costly. Dallas, like other growing cities,
Images from forwardDallas!, the Dallas loses portions of its urban tree canopy each year, thus making conservation
Comprehensive Plan adopted in 2006 and maintenance of the existing tree canopy particularly important. The loss
of trees, especially larger trees, results in the loss of the benefits described
below. The costs of conserving and protecting urban trees are variable and
depend on the approach, whether through direct land purchases or regulatory measures.
Maintenance of the urban canopy in Dallas is limited primarily to hazard mitigation from
fallen trees and branches. Dallas costs for these activities likely range from $1 to $2 million
annually.
– 15 –FigureT 4
TREE CANOPY AND THERMAL CHARACTERISTICS
Southwest Downtown
Potential Targets for Heat Island Mitigation
These three images show heat island features in a
portion of downtown Dallas. The first image is an
aerial photo with hotter and cooler areas highlighted.
The image just below the aerial shows surface
temperatures from 2006 satellite imagery analysis.
The third image illustrates the limited tree
canopy in this area of downtown.
The hottest areas range from the Reunion Arena
parking northeast across the Convention Center
area. The Arena roof itself is likely cooler due to its
reflective surface, but is not be easily distinguished
due to overall surface temperatures.
Cooler areas shown in green are where high-
rise buildings in the east portion of downtown shade
the nearby buildings and ground surfaces, resulting
in lower temperatures.
Southwest Downtown Tree Canopy Southwest Downtown Thermal Image
– 16 –BENEFITS OF TREES
Trees more than pay for themselves in benefits. The major heat island benefits from tree cover
include saving energy, improving air quality, shading paved surfaces (i.e., human comfort,
cooler parked vehicles), and reducing urban temperatures through shade and transpiration.
Other direct and indirect benefits of trees include improved property values, human health
benefits, reduction of stormwater requirements, improved quality of life, and reduced
greenhouse gases.
Trees and Energy Savings
Trees directly save energy by shading buildings and thereby reducing the heat load. Trees
placed on the east or west side and relatively close to the building generally provide the most
energy savings. Older, less energy efficient buildings benefit more from tree shade than newer,
more energy efficient buildings. Estimates of such savings vary widely due to different
conditions and methods. Examples of energy savings include:
• Per Tree Savings
o $480 to $720 per tree over 30-year period (residential), Houston19
o $907 per tree over 30-year period, Sacramento (buildings)20
o 2 to 3% energy savings from a 5% increase in tree canopy21
• Urban Area Savings
o Ranging from $27.8 million in Chicago (added shade for residential and
commercial)22 to $131 million per year (building energy savings from
existing tree shade), Houston23
Table 2
RESEARCH SUMMARY – ENERGY SAVINGS FROM TREES24
• Joint studies by the Lawrence Berkeley National Laboratory (LBNL) and the Sacramento Municipal Utility
District (SMUD) placed varying numbers of trees around houses to shade windows and then measured
25
the buildings’ energy use. The cooling energy savings ranged between 7 and 47 percent and were
26
greatest when trees were planted to the west and southwest of buildings.
• A USDA Forest Service study investigated the energy savings resulting from SMUD’s residential tree
planting program. This study included over 250 program participants in the Sacramento, California area,
27
and estimated the effect of new shade trees planted around houses. An average of 3 new trees were
planted within 10 feet (3 m) of each house. Annual cooling energy savings were 1 percent per tree, and
annual heating energy use decreased by almost 2 percent per tree. The trees provided net wintertime
benefits because the positive wind shielding effect outweighed the negative effect of added shade.
• Another LBNL study simulated the effects of trees on homes in various communities throughout the
United States. Assuming one tree was planted to the west and another to the south of a house, the model
predicted that a 20 percent tree canopy over the house would result in annual cooling savings of 8 to 18
28
percent and annual heating savings of 2 to 8 percent. Although this particular model included benefits
from trees planted to the south of a building, experts generally suggest planting to the west and east of
29
buildings, taking care when planting to the south to avoid blocking desired solar heat gain in the winter.
Trees and Air Pollution
Trees improve air quality by removing pollutants from the air (dry deposition), and indirectly
by cooling the city. In addition, cars that are shaded in parking areas produce lower
evaporative emissions. Cooler temperatures, which result from the urban canopy, help reduce
ozone formation and concentrations.
Trees also emit volatile organic compounds (VOCs), which play a role in ozone formation.
These “biogenic emissions” could counteract some of the air quality benefits from trees.
However, since biogenic emission rates are partially dependent on temperature, lowered
temperatures can may in a net overall reduction of these emissions.30
Trees also reduce ozone. Research on New York City projected that expanding the urban
canopy by 10% would reduce ozone by about 3%.31 A study of the Houston region showed
that the loss of urban trees increased temperatures as much as 5ºF over an 8-year period.32
Another Houston study showed that increased tree cover would lower daytime temperatures
levels while slightly increasing nighttime temperatures.33 Estimates from the Mitigation
– 17 –Impact Screening Tool (MIST)34 indicate that increasing the urban canopy by 5% would
decrease ozone concentrations by 0.3 to 0.5 parts per billion (ppb). Dallas has previously
demonstrated measures that would come within a few ppb of meeting the Federal ozone
standard.
The value of pollution removal by trees has been estimated in American Forests studies and
in U.S. Forest Service studies that use the UFORE model.
Table T2
VALUE OF POLLUTION REMOVAL BY URBAN FOREST
Study Area Annual Pollution Removal Value
Houston Region35 $209 million/year
Houston 8-County Region36 $296 million/year
San Antonio Region37 $87.5 million per year
Atlanta Metro Area38 $28 million/year
The MIST screening tool was developed to provide a way of estimating the effects of
increased vegetation on ozone levels in urban areas. Estimates such as these have not been
used to date for state air quality plans, nor has modeling been done that meets State criteria for
inclusion in these plans.
Some air quality modeling experts have indicated that current modeling tools fail to
adequately capture urban heat island effects. Improving results would require improved
meteorological modeling and other changes that would better incorporate heat island effects.
The uncertainties in such analyses are substantial due to great variations in regional climate
and air modeling factors.
Trees and Stormwater Management
Trees reduce the need for and cost of stormwater infrastructure by catching and slowing
rainfall runoff. The leaves and branches catch rainfall, allowing time for more evaporation and
reduced peak flows. As estimated for Sacramento, trees may catch 35 percent of the rainfall
that hits them.39 The total capital cost savings of the stormwater function of an urban canopy
have been estimated in various studies by American Forests.
Table T3
ESTIMATED STORMWATER MANAGEMENT SAVINGS
FROM EXISTING URBAN FORESTS
Study Area Cost Savings
40
City of Garland $2.8 million*
San Antonio Region41 $2.8 billion**
Houston 8-County Region42 $133 billion**
Atlanta Metro Area43 $2.36 billion**
*Annualized savings using 6% discount rate.
**Total capital cost to replace estimated stormwater reduction by trees.
For the Houston area, the stormwater savings amount to roughly $200 per tree.
Comparisons with other cities (listed in Table 4) suggest that stormwater benefits can range
from $100 to $300 per tree in total infrastructure savings.
Greenhouse Gases
As part of the growth process, trees take up carbon dioxide, a major greenhouse gas. The
amount of carbon that is then stored by trees increases as the tree grows and is retained over
the tree’s life. Likewise, loss of trees whether through harvesting, removal, or tree death
releases stored carbon. The study of Houston’s urban forest estimated an annual value of
carbon being stored in the current tree canopy at $29 million per year. A Charleston, South
Carolina study estimated that carbon sequestration could be valued at $1.50 per tree per year.
This 2006 study included 15,000 street trees and was based on average carbon credit prices. 44
– 18 –Tree species and growth rates vary from area to area directly affecting the sequestration
values. Fast growth or higher density tree species yield greater carbon storage.
Trees also reduce greenhouse gas emissions by reducing energy demand. The direct
energy savings from shade trees and vegetation has been estimated to reduce carbon emissions
from power plants by roughly 1.5 to 5 percent (depending on types of fuel used in power
generation).45 The modeling study for this finding assumed that eight trees would be
strategically planted around all residential and office buildings and four trees adjacent to retail
buildings.
Health Benefits
Trees benefit human health by reducing air pollution, blocking harmful UV rays, and
minimizing the impacts of summer heat waves. Research also shows that human physiology
responds positively to trees and greenspace.46 UV rays have a negative effect on the skin and
eyes, and high levels of UV exposure are linked to skin cancer.47,48
Quality of Life Benefits
Most people consider trees to add substantially to the quality of life in their city. Trees and
shrubs along roadways can reduce urban noise and serve as noise barriers for highways. 49
Urban trees are found to be associated with reduced crime rates, higher property values and
positive health benefits, such as reduced stress.50,51,52,53 The replacement value of trees in the
Houston area was estimated to be $206 billion, or roughly $300 per tree (trees over 5” in
diameter).54
Other Economic Benefits
Studies have shown that trees also increase residential property values by three to ten
percent.55 In retail areas, better landscaping and trees increase the time shoppers spend in the
area and purchases are greater.56,57,58,59
THE NET VALUE OF THE DALLAS URBAN CANOPY
The net benefit of trees has been found to outweigh their costs by as much as three to one. In a
2006 study of five cities the net benefits of street trees were found to range from $1.35 to $3.10
per tree for every dollar of cost. The annual benefits ranged from $30 to $90 per tree.60 The
costs include such factors as planting, pruning, removal/disposal, litter management, liability,
administration and inspection. Benefits included energy savings, carbon storage, air quality,
stormwater management, and property value. Benefits and costs in Dallas would likely vary
from those identified in this study, but such studies have generally confirmed that tree benefits
outweigh costs by a substantial margin.
The challenge for local government is matching the costs and benefits with the questions of
“who pays” and “who benefits”. Local governments must weigh the costs and benefits of
planting and caring for trees on public lands and rights-of-way. While city government may
incur costs described above, the benefits, such as improved air quality and energy savings, go
to the broader public. Some benefits can offset city government costs including energy
savings for city buildings, decreased energy demand from cooler temperatures, increased
property values that add to the tax base, and stormwater management benefits. City
governments may also benefit from air quality improvements and other quality of life
improvements that increase the city’s economic competitiveness.
B. PLANTING FOR HEAT ISLAND REDUCTION
From an urban heat island perspective, trees should be planted and conserved in locations that
best reduce air temperatures. Planting sites include (1) locations that shade buildings to reduce
energy use, (2) locations that shade for surfaces, such as buildings and pavement, and (3)
locations that conserve and expand the urban tree canopy for an overall cooling effects. It is
important to realize that without the current tree canopy, Dallas would be several degrees
hotter.
The following section illustrates hot spot analysis for two Dallas hot spots located near
downtown. Following that various land use types are examined for locations of existing trees
and possible planting sites. These include:
• Single family and multi family developments
– 19 –You can also read