Report of the Secretary-General on SDG Progress 2019 Special Edition
←
→
Page content transcription
If your browser does not render page correctly, please read the page content below
Report of the Secretary-General
                           on SDG Progress 2019
                                     Special Edition

United Nations
Report of the
                 Secretary-General on
                 SDG Progress 2019
                 Special Edition

United Nations
New York, 2019
Introduction

Four years ago, world leaders came together at the United Nations            response and that country ownership of the 2030 Agenda remains
and adopted the 2030 Agenda for Sustainable Development.                     strong. We have also seen a significant response from regional
                                                                             governments and cities, businesses, civil society, academia, young
Governments responded to the common challenges they faced and                people and others, which, through a wide range of actions and
the changing world around them by uniting behind a truly forward-            initiatives, have identified entry points to align with and advance
looking, yet urgent, plan to end poverty and create shared prosperity        Goal implementation. The United Nations too, as a key actor, is
on a healthy and peaceful planet. It was a moment of great hope              making foundational changes, and the United Nations development
and promise, when the light of an inclusive multilateralism shone            system is undergoing the deepest reform in decades so as to be
brightly, as it did throughout 2015 with the adoption of other               better able to respond to the paradigm shift at the heart of the 2030
significant and related global agreements: the Addis Ababa Action            Agenda. I am confident that with continued support from Member
Agenda of the Third International Conference on Financing for                States and the Organization’s leadership and staff, the United
Development, the Sendai Framework for Disaster Risk Reduction                Nations will begin to see the fruits of these reforms in the quality
2015–2020 and the Paris Agreement under the United Nations                   of its support provided to Governments, as they work to accelerate
Framework Convention on Climate Change.                                      implementation at the scale needed to achieve the Goals by 2030.

In September, Heads of State and Government will gather once                 Second, notwithstanding these positive trends and the breadth of
again, this time to take stock of how far we have come in realizing          action and initiatives that the 2030 Agenda has inspired, the shift
our sustainable development commitments. Through the high-level              in development pathways to generate the transformation required
political forum on sustainable development, the Climate Action               to meet the Sustainable Development Goals by 2030 is not yet
Summit and high-level meetings of the General Assembly on                    advancing at the speed or scale required.
universal health coverage, financing for development and the SIDS
Accelerated Modalities of Action (SAMOA) Pathway, leaders from
all sectors will also have an opportunity to signal the urgent steps
they will take to increase the ambition and impact of implementation
                                                                                The shift in development pathways to
efforts.                                                                        generate the transformation required to meet
                                                                                the Sustainable Development Goals by 2030
Progress thus far                                                               is not yet advancing at the speed or scale
Though the availability of timely, disaggregated data across all                required.
countries and all targets and indicators to inform the present report
remains a challenge, a clear picture is emerging of the state of
implementation of the Sustainable Development Goals four years               It is cause for great concern that the extreme poverty rate is
on.                                                                          projected to be 6 per cent in 2030, missing the global target to
                                                                             eradicate extreme poverty; hunger is on the rise for the third
First, progress is being made and some favourable trends with                consecutive year and little progress is being made in countering
regard to the implementation of the Sustainable Development Goals            overweight and obesity among children under the age of 5;
are evident. Extreme poverty and child mortality rates continue              biodiversity is being lost at an alarming rate, with roughly 1 million
to fall. Progress is being made against diseases such as hepatitis,          species already facing extinction, many within decades; greenhouse
where the incidence of new chronic hepatitis B virus (HBV)                   gas emissions continue to increase; the required level of sustainable
infections has been reduced considerably. Certain targets regarding          development financing and other means of implementation are not
gender equality are seeing progress, including the implementation            yet available; and institutions are not strong or effective enough to
of gender-responsive budgeting. Electricity access in the poorest            respond adequately to these massive interrelated and cross-border
countries has begun to increase. Globally, labour productivity has           challenges.
increased and unemployment is back to pre-financial crisis levels.
The proportion of the urban population living in slums is falling. The       In the context of the 2030 Agenda’s central principle of leaving
proportion of waters under national jurisdiction covered by marine           no one behind, there is progress, albeit at a slow pace. Population
protected areas has more than doubled since 2010. And progress on            groups with documented disadvantages largely remain excluded.
some means of implementation is moving rapidly.                              Globally, youth are three times more likely to be unemployed
                                                                             than adults. Children are overrepresented among the poorest
This progress is an illustration of the hard work that many                  people – one child in five lives in extreme poverty. Rural and urban
Governments and their partners have been undertaking since                   differentials are also evident in such areas as education and health
2015. The voluntary national reviews provide the United Nations              care. Persons with disabilities and those living with HIV/AIDS
with additional insights. They show that Governments have                    continue to face multiple disadvantages, denying them both life
prioritized integration of the Sustainable Development Goals into            opportunities and fundamental human rights.
their national plans and policies and are creating the institutional
arrangements that will help drive and also monitor progress towards          Gender inequalities also persist. Women represent less than 40 per
the transformation needed in their economies and societies.                  cent of those employed, occupy only about a quarter of managerial
Importantly, the reviews show that there has been a near universal           positions in the world and (according to data available from a limited

Report of the Secretary-General on SDG Progress 2019                    i
set of countries) face a gender pay gap of 12 per cent. About a fifth         multilateralism, to prevention and to diplomacy is essential. And much
of those aged 15 to 49 had experienced physical or sexual partner             greater urgency and ambition regarding Sustainable Development
violence in the past 12 months. There is simply no way that the world         Goal response is required. This is especially the case when it comes
can achieve the 17 Sustainable Development Goals without also                 to the response to the existential threat of climate change, where a
achieving gender equality and the empowerment of women and girls.             failure to meet the goals of the Paris Agreement will directly threaten
                                                                              the attainment of all other Sustainable Development Goals.
Unsurprisingly, there are significant divergences across regions and
among countries in very different situations. Regrettably, the most           In this spirit, I welcome the progress made thus far, and encourage
vulnerable countries are bearing the brunt of the current obstacles           all countries and all Sustainable Development Goal partners to
to Sustainable Development Goal implementation.                               do more, and faster. I also identify a series of systemic gaps in the
                                                                              overall response to the 2030 Agenda and call for specific actions to
Third, there is no escaping the fact that the global landscape for            fill them. These include placing special focus on the most vulnerable
Sustainable Development Goal implementation has generally                     to ensure that as countries progress, they leave no one behind;
deteriorated since 2015, hindering the efforts of Governments                 ensuring adequate and well-directed financing; strengthening
and other partners. Moreover, the commitment to multilateral                  institutions and making them more effective and inclusive;
cooperation, so central to implementing major global agreements, is           bolstering local action to accelerate implementation; strengthening
now under pressure.                                                           economies and building resilience; strengthening collection,
                                                                              access and effective use of data for the Goals; and harnessing
Conflicts and instability in many parts of the world have intensified,        science, technology and innovation with a greater focus on digital
causing untold human suffering, undermining the realization of                transformation for sustainable development.
the Sustainable Development Goals and even reversing progress
already made. With developing countries hosting more than 85 per
cent of the 68.5 million people who were forcibly displaced in 2017,              The world will soon enter a decade that
pressures on existing support systems are immense.
                                                                                  will be decisive for both current and future
Direct economic losses from disasters have increased by more than                 generations and for all life on this planet. It is
150 per cent over the past 20 years, with losses disproportionately               the world’s responsibility and within its power
borne by vulnerable developing countries. Without a surge in
mitigation, global warming will continue at a rapid pace, amplifying
                                                                                  to make it a decade of action and delivery for
the challenges of adaptation and entrenching a sense of vulnerability             sustainable development.
and insecurity among large population groups.

Economic changes have also made Sustainable Development Goal                  The commitment to the 2030 Agenda remains strong. Hundreds of
implementation more challenging. Global economic growth is                    millions of young people believe in and are demanding the change
anticipated to remain slow and uneven across regions amid lingering           at the heart of this agenda. Action on the Sustainable Development
trade tensions and unsustainable levels of household and corporate            Goals is growing, and safely deployed new technologies, including
debt. Debt vulnerability in low-income countries has increased                artificial intelligence, can help the world take the next leap forward.
substantially in recent years. In addition to an expected slowdown in         I am convinced that with sufficient focus, effort, innovation, political
emerging economies, lower growth rates are projected in developed             commitment and resolve, with partners who are fully behind this
economies in general. And several Governments are taking more                 transformation and with multilateral collaboration that is focused
protectionist approaches across the board, risking growth rates,              on results, these challenges can be surmounted and the Sustainable
poverty reduction and economic diversification.                               Development Goals can be reached by 2030.

Rising income and wealth inequality risk undermining efforts to               The world will soon enter a decade that will be decisive for both
achieve the Sustainable Development Goals. They threaten to                   current and future generations and for all life on this planet. It is the
erode social cohesion, entrench insecurity and dampen productivity            world’s responsibility and within its power to make it a decade of
growth. Rising intolerance in many parts of the world threatens               action and delivery for sustainable development.
fundamental human rights and human progress. The nexus
among inequality, injustice, insecurity and lack of sufficient trust
in Governments and institutions can further hinder the necessary
conditions for advancing sustainable development.

Gearing up for a decade of action for sustainable
development
Against this backdrop, when world leaders gather again this                                                                           António Guterres
September, an honest and frank reflection on the world’s current                                                                    Secretary-General
direction of travel is necessary. A renewed commitment to                                                                        of the United Nations

                                                                         ii                                                              Introduction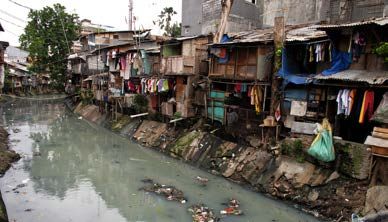
Contents

          Introduction . . . . . . . . . . . . . . . . . . . . . . . . . . . . . . . .       i

Goal 1    No poverty . . . . . . . . . . . . . . . . . . . . . . . . . . . . . . . . . .    6

Goal 2    Zero hunger . . . . . . . . . . . . . . . . . . . . . . . . . . . . . . . . .      7

Goal 3    Good health and well-being . . . . . . . . . . . . . . . . . . .                  9

Goal 4    Quality education  . . . . . . . . . . . . . . . . . . . . . . . . . . .          11

Goal 5    Gender equality . . . . . . . . . . . . . . . . . . . . . . . . . . . . .         13

Goal 6    Clean water and sanitation . . . . . . . . . . . . . . . . . . .                  14

Goal 7    Affordable and clean energy . . . . . . . . . . . . . . . . . .                   15

Goal 8    Decent work and economic growth . . . . . . . . . . . .                           17

Goal 9    Industry, innovation and infrastructure . . . . . . . .                           18

Goal 10   Reduced inequalities . . . . . . . . . . . . . . . . . . . . . . . .  20

Goal 11   Sustainable cities and communities . . . . . . . . . . .                          21

Goal 12   Responsible consumption and production . . . . . .                                22

Goal 13   Climate action  . . . . . . . . . . . . . . . . . . . . . . . . . . . . . .       23

Goal 14   Life below water . . . . . . . . . . . . . . . . . . . . . . . . . . . . .  24

Goal 15   Life on land . . . . . . . . . . . . . . . . . . . . . . . . . . . . . . . . .    25

Goal 16   Peace, justice and strong institutions . . . . . . . . . .                        27

Goal 17   Partnership for the Goals . . . . . . . . . . . . . . . . . . . .  29

          Looking beyond . . . . . . . . . . . . . . . . . . . . . . . . . . . . .          32

          Responding to gaps  . . . . . . . . . . . . . . . . . . . . . . . . .             35

          Conclusion  . . . . . . . . . . . . . . . . . . . . . . . . . . . . . . . . .  40

          Annex: Snapshot of SDG Progress . . . . . . . . . . . .                           41
Where we are in the achievement of the Sustainable
Development Goals                                         1

This chapter reviews progress in the fourth year of implementation                         data are not regularly collected by most of the countries or there is
of the 2030 Agenda. It presents highlights of progress for all 17                          no established methodology to measure them. This has a negative
Sustainable Development Goals, based on the latest available data,                         impact on the ability to fully understand Sustainable Development
and examines some of interconnections across Goals and targets. It                         Goal progress and challenges.
is important to note that for more than half of the global indicators,

                                 End poverty in all its
                                 forms everywhere

The decline of global extreme poverty continues, but has slowed. The
deceleration indicates that the world is not on track to achieve the
target of less than 3 per cent of the world living in extreme poverty
by 2030. People who continue to live in extreme poverty face deep,
entrenched deprivation often exacerbated by violent conflicts and
vulnerability to disasters. Strong social protection systems and                           back on their feet and escape poverty, but these services need to be
government spending on key services often help those left behind get                       brought to scale.

■■ The share of the world population living in extreme poverty                             ■■ Social protection systems help prevent and reduce poverty and
   declined to 10 per cent in 2015, down from 16 per cent in 2010                             provide a safety net for the vulnerable. However, social protection
   and 36 per cent in 1990. However, the pace of poverty reduction is                         is not a reality for a large majority of the world’s population. In
   decelerating, with a “nowcast” of 8.6 per cent in 2018. Moreover,                          2016, 55 per cent – as many as 4 billion people – were not covered
   baseline projections suggest that 6 per cent of the world                                  by any social protection cash benefits, with large variations across
   population will still be living in extreme poverty in 2030, missing                        regions: from 87 per cent without coverage in sub-Saharan Africa
   the target of ending poverty.                                                              to 14 per cent in Europe and Northern America.

     Proportion of people living below $1.90 a day, 1990–2015, 2018 nowcast and
     2030 projection (percentage)                                                                Proportion of employed population living below $1.90 a day, 2010 and 2018
     40                                                                                          (percentage)
           35.9
                                                                                                                                                                                                      45
                                                                                                                  Sub-Saharan Africa                                                        38
     30                                                                                                                                                                     26
                                                                                                                            Oceania*                                 20
                                                                                                                                                                           24
                                                                                                           Central and Southern Asia                       12
     20                                                                                                                                         1.6
                                                                                                   Northern Africa and Western Asia         3
                                                    9.9                                                                                     4
                                                          8.6                                        Latin America and the Caribbean            2.2
     10                                                                        6.0                                                                         11
                                                                                                      Eastern and South-Eastern Asia            1.7

     0                                                                                                                                                                                      38
                                                                                                           Least developed countries                                                 31.5
          1990    1995   2000    2005     2010     2015 2018                   2030
                                                       nowcast            projection                 Landlocked developing countries                                                 32.4
                                                                                                                                                                                26
                                                                                                                                                       9
                                                                                                       Small island developing States                 8
                                                                                                                                                                14
                                                                                                                               World                  8
■■ Despite having a job, 8 per cent of the world’s workers and their                                                                    0                 10          20             30          40          50

   families still lived in extreme poverty in 2018. The situation                                                                                                                           2010           2018

   remains particularly alarming in sub-Saharan Africa, where the                                * Excluding Australia and New Zealand.

   share of working poor stood at 38 per cent in 2018.

1   A supplementary document containing a statistical annex to the present report and a database of available global, regional and country data
    and metadata for the Sustainable Development Goal indicators will be made available at https://unstats.un.org/sdgs.

Report of the Secretary-General on SDG Progress 2019                                  6
■■ Only 22 per cent of unemployed persons receive unemployment                                              disasters as a percentage of gross domestic product (GDP) were
   cash benefits, only 28 per cent of persons with severe disabilities                                      also much higher in these countries.
   receive disability cash benefits, only 35 per cent of children
   worldwide enjoy effective access to social protection and only 41                                       Economic losses (relative to GDP) caused by climate-related disasters,
   per cent of women giving birth receive maternity cash benefits.                                         1998–2017 (percentage)

                                                                                                                               Low income                                           1.8

    Proportion of population covered by at least one form of social protection
    benefit, and children covered by social protection, 2016 (percentage)
                                              13
                    Sub-Saharan Africa        13                                                                       Lower-middle income                        1.1
              Central and Southern Asia        16
                                              14
        Eastern and South-Eastern Asia                              59
                                                                   56
       Latin America and the Caribbean                                61
                                                                                                                       Upper-middle income             0.6
                                                                                               99
             Australia and New Zealand                                          80
                                                                                          92
          Europe and Northern America                                                86

                                                         35
                                 World                        45                                                               High income       0.4
                                          0         20        40           60        80        100

                                                         Children covered by social protection
                                                         Population covered by at least one form
                                                         of social protection benefit                                                    0.0           0.5       1.0         1.5          2.0
    Note: Data for Northern Africa and Western Asia, and Oceania (excluding Australia and New
          Zealand) are not shown due to low population coverage of available data. Data on
          children covered by social protection are not shown for Central and Southern Asia due
          to low population coverage of this data for Southern Asia.
                                                                                                         ■■ Countries have reported progress in the development and
                                                                                                            implementation of national and local disaster risk reduction
■■ Disasters often lead to a downturn in the trajectory of                                                  strategies in line with the Sendai Framework for Disaster Risk
   socioeconomic development and exacerbate poverty. From 1998                                              Reduction 2015–2030. As at 31 March 2019, 67 countries had
   to 2017, direct economic losses from disasters were estimated at                                         reported progress in such alignment and 24 countries reported
   almost $3 trillion, of which climate-related disasters accounted for                                     that their respective local governments had developed local
   77 per cent of the total – a rise of 151 per cent compared with the                                      strategies consistent with national strategies and plans.
   period from 1978 to 1997 – and climate-related and geophysical
   disasters claimed an estimated 1.3 million lives. More than 90 per                                    ■■ Only one third of all countries spend between 15 per cent and
   cent of deaths reported internationally were due to disaster events                                      20 per cent of total government expenditure on education, as
   in low- and middle-income countries, and economic losses from                                            recommended in the Education 2030 Framework for Action.

                                          End hunger, achieve
                                          food security and
                                          improved nutrition and
                                          promote sustainable
                                          agriculture

Hunger is on the rise again globally and undernutrition continues to
affect millions of children. Public investment in agriculture globally
is declining, small-scale food producers and family farmers require
much greater support and increased investment in infrastructure and
technology for sustainable agriculture is urgently needed.

■■ An estimated 821 million people – approximately 1 in 9 people                                            the continent with the highest prevalence of undernourishment,
   in the world – were undernourished in 2017, up from 784 million                                          affecting one fifth of its population (more than 256 million people).
   in 2015. This represents a worrying rise in world hunger for a                                           Consistent with the continued growth in undernourishment, 770
   third consecutive year after a prolonged decline. Africa remains                                         million people faced severe food insecurity in 20172 .

2   An update on undernourishment, food insecurity and malnutrition figures will be released in The State of Food Security and Nutrition in the
    World 2019, to be published by the Food and Agriculture Organization of the United Nations in July 2019.

                                                                                                     7                                                                   Special Edition
■■ Government spending on agriculture compared to agriculture’s
contribution to the total economy has declined by 37 per cent; the
Number and proportion of undernourished people in the world, 2005–2017 ratio fell from 0.42 in 2001 to 0.26 worldwide in 2017. In addition,
and account for
(millions and percentage)
aid to agriculture in developing countries fell from nearly 25 per
16 945 1000
cent of all donors’ sector-allocable aid in the mid-1980s to only 5
855
14 813 804 821 per cent in 2017, representing a decrease of $12.6 billion.
Proportion of undernourished people
14.5 784
Number of undernourished people
800
12
12.6
11.5
10 10.7 10.8 10.9
600
from edge. Proportion of children under 5 years who are overweight, 2018 (percentage)
8
400 Northern Africa and Western Asia 9.8
6
lor bubble and Oceania* 9.1
4
200
Europe and Northern America*** 8.8
2
legend. Latin America and the Caribbean 7.5
0 0
2005 2008 2011 2014 2017
projected Eastern and South-Eastern Asia** 6.9
Number of undernourished people (millions) Sub-Saharan Africa 3.9
Proportion of undernourished people (percentage)
Central and Southern Asia 3.4
World 5.9
0 2 4 6 8 10 12 14 16
■■ Stunting has been decreasing in nearly every region since 2000.
95 per cent confidence intervals
Still, more than 1 in 5 children under 5 years of age (149 million)
were stunted in 2018. Globally, 49 million children under 5 were * Excluding Australia and New Zealand.
affected by wasting and another 40 million were overweight in ** Excluding Japan.
*** Including estimates only for the United States of America. Confidence intervals are not
2018. available.
Proportion of children under 5 years who are stunted, 2000 and 2018 (percentage)
■■ A continuous downward trend has been observed in export subsidy
outlays reported to the World Trade Organization (WTO). The
37
Oceania* 38 total outlays fell from close to $500 million in 2010 to around $120
41
Sub-Saharan Africa 32 million in 2016. This reduction in export subsidies by Governments
49
Central and Southern Asia 32 is leading to lower distortions in agricultural markets.
23
Northern Africa and Western Asia 16
26
Eastern and South-Eastern Asia** 13
17
Latin America and the Caribbean 9
Europe and Northern America*** 3 The agriculture orientation index, 2001 and 2017
2.6
33 0.23
World 22
Sub-Saharan Africa 0.20
0.24
0 20 40 60 Australia and New Zealand 0.21
0.27
2000 2018 95 per cent confidence intervals Latin America and the Caribbean 0.26
* Excluding Australia and New Zealand. 0.94
Eastern and South-Eastern Asia 0.33
** Excluding Japan. 0.10
Oceania* 0.33
*** Including estimates only for the United States of America. Confidence intervals are not
available. 0.60
Europe and Northern America 0.39
0.58
Northern Africa and Western Asia 0.45
0.20
Central and Southern Asia 0.51
0.42
■■ Strengthening the resilience and adaptive capacity of small-scale World 0.26
and family farmers, whose productivity is systematically lower 0.0 0.2 0.4 0.6 0.8 1.0
than all other food producers, is critical to reversing the trend of 2001 2017
the rise in hunger. The share of small-scale food producers in terms * Excluding Australia and New Zealand.
of all food producers in countries in Africa, Asia and Latin America
ranges from 40 to 85 per cent, compared with fewer than 10 per
cent in Europe.
Report of the Secretary-General on SDG Progress 2019 8Ensure healthy lives
and promote
well-being for all
at all ages
Major progress has been made in improving the health of millions
of people, increasing life expectancy, reducing maternal and child
mortality and fighting against leading communicable diseases.
However, progress has stalled or is not happening fast enough with
regard to addressing major diseases, such as malaria and tuberculosis,
while at least half the global population does not have access to and sustainable financing for health, to address the growing burden
essential health services and many of those who do suffer undue of non-communicable diseases, including mental health, and to
financial hardship, potentially pushing them into extreme poverty. tackle antimicrobial resistance and determinants of health such as air
Concerted efforts are required to achieve universal health coverage pollution and inadequate water and sanitation.
Reproductive, maternal, newborn and child health
Under-5 and neonatal mortality rate, 2000–2017 (deaths per 1,000 live births)
■■ An estimated 303,000 women around the world died due to
complications of pregnancy and childbirth in 2015. Almost all 160
of these deaths occurred in low- and middle-income countries,
and almost two thirds of those were in sub Saharan Africa.
These deaths are preventable with appropriate management and 120
care. Globally in 2018, 81 per cent of births took place with the
assistance of a skilled birth attendant, a significant improvement
from 69 per cent in 2012. Coverage of skilled birth attendants in 80 77
2018 was only 59 per cent in sub-Saharan Africa.
39
Proportion of births attended by skilled health personnel, 2006–2012 and
nd account for 40
2013–2018 (percentage) 31
18
47
Sub-Saharan Africa 59
51
Central and Southern Asia 79
0
2000
2017
2000
2017
2000
2017
2000
2017
2000
2017
2000
2017
2000
2017
2000
2017
2000
2017
79
Northern Africa and Western Asia 89
ric n
*
As nd
As ica
be ica
As d
er and
an d
ld
om edge. 91
ia
Af ara
n an
al an
Latin America and the Caribbean
or
a
ia
ia
an
ia
ica
d
rn l a
an
rn fr
rib er
94
W
er n
Am e
Ze ia
te A
h
he ra
Ca m
ce
n op
st ter
Sa
w ral
es rn
ut nt
e A
O
er ur
b-
Ea s
Ne st
W he
So Ce
th tin
90
h- Ea
rth E
Su
Eastern and South-Eastern Asia Au
d rt
d La
96
an No
ut
No
99
an
So
or bubble and Australia and New Zealand 97
99
Europe and Northern America 99 Under-5 mortality rate Neonatal mortality rate
egend.
* Excluding Australia and New Zealand.
69
World
81
0 20 40 60 80 100
■■ Immunization saves millions of lives and is widely recognized
2006–2012 2013–2018 as one of the world’s most successful and cost-effective health
interventions. Coverage of the required three doses of the vaccine
Note: No data available for Oceania (excluding Australia and New Zealand).
that prevents diphtheria, tetanus and pertussis increased from
72 per cent in 2000 to 85 per cent in 2015 and has remained
unchanged between 2015 and 2017. An estimated 19.9 million
■■ The under-5 mortality rate fell to 39 deaths per 1,000 live births children did not receive the vaccines during the first year of life,
in 2017, a 6.7 per cent reduction from 42 deaths in 2015, and an putting them at serious risk of these potentially fatal diseases. The
overall reduction of 49 per cent from 77 deaths per 1,000 live global coverage of pneumococcal conjugate vaccine, which has the
births in 2000. The total number of under-5 deaths dropped to 5.4 potential to significantly reduce deaths in children under age of 5,
million in 2017 from 9.8 million in 2000. Still, most of these deaths has yet to reach 50 per cent. Two doses of the measles vaccine are
were from preventable causes and almost half, or 2.5 million, required to prevent the disease and the illnesses, disabilities and
occurred in the first month of life – the most crucial period for deaths caused by complications associated with it. Coverage with
child survival. The global neonatal mortality rate has continued to the second dose of measles vaccine increased from 59 per cent in
decline after a long downward trend from 31 deaths per 1,000 live 2015 to 67 per cent in 2017, but that is still insufficient to prevent
births in 2000 to 18 in 2017, a 41 per cent reduction. this highly contagious disease.
9 Special EditionImmunization coverage worldwide, by type of vaccine, 2000–2017 (percentage)
■■ Tuberculosis remains a leading cause of ill health and death. In
2017, an estimated 10 million people fell ill with tuberculosis. The
100 burden is falling globally: incidence of tuberculosis has continued
to decline from 170 new and relapse cases per 100,000 people
85
in 2000 to 140 in 2015, and 134 in 2017; and the tuberculosis
80
72
mortality rate among HIV-negative people fell by 42 per cent
67 between 2000 and 2017. However, large gaps in detection and
60
treatment persist and the current pace of progress is not fast
enough to meet the Sustainable Development Goal target, with
44 drug-resistant tuberculosis remaining a continuing threat.
40
■■ After more than a decade of steady advances in fighting malaria,
progress has stalled. No significant gains were made in reducing
20
15 the number of malaria cases worldwide in the period 2015–2017.
Sub-Saharan Africa continues to carry the heaviest burden of
4
disease, accounting for more than 90 per cent of the global malaria
0
2000 2005 2010 2015 2017
burden. Worryingly, there were an estimated 3.5 million more
malaria cases in the 10 highest-burden African countries in 2017
DTP3 MCV2 PCV3 compared with the previous year.
■■ Expanding access to modern contraceptive methods is essential to Malaria incidence rate, 2017 (new cases per 1,000 people at risk)
ensuring universal access to sexual and reproductive health-care
services. Globally, the proportion of women of reproductive age (15
to 49 years old) who have their need for family planning satisfied
with modern contraceptive methods has continued to increase
slowly, from 74 per cent in 2000 to 76 per cent in 2019.
■■ Adolescent fertility declined from 56 births per 1,000 adolescent
women in 2000 to 45 births in 2015 and 44 births in 2019. The
level of adolescent fertility has remained high in sub-Saharan
Africa, at 101 births per 1,000 adolescent women.
0 0¬0.1 0.1¬1 1¬10 10¬50
Infectious diseases
50¬100 100¬200 200¬300 More than 300
■■ Strong and steady domestic and international commitment and
funding has fuelled an acceleration of evidence-informed HIV
prevention, testing and treatment programmes. As a result, ■■ In 2015, an estimated 325 million people worldwide were living
the incidence of HIV in sub-Saharan Africa (among adults aged with hepatitis B virus or hepatitis C virus infection. The widespread
15 to 49) has declined by 37 per cent, from 3.39 infections per use of hepatitis B vaccine in infants has considerably reduced
1,000 uninfected people in 2010 to 2.49 in 2015 and 2.14 in 2017. the incidence of new chronic HBV infections, as reflected by the
However, the rate of global HIV incidence among adults aged 15 to decline in hepatitis B prevalence among children under 5 years
49 declined from 0.44 to 0.40 between 2015 and 2017 and overall of age, from 4.7 per cent in the pre-vaccine era to 0.8 per cent in
by 22 per cent between 2010 and 2017, well short of the declines 2017.
required to meet 2020 and 2030 targets.
■■ In 2017, 1.58 billion people were reported as requiring mass or
individual treatment and care for neglected tropical diseases,
HIV incidence rates, 2010 and 2017 (new cases per 1,000 uninfected adults
down from 1.63 billion in 2015 and 2.03 billion in 2010. Improved
aged 15 to 49 years)
surveillance meant that further populations requiring interventions
3.39
Sub-Saharan Africa 2.14 against such diseases were identified in 2017. The 522 million
0.56
Oceania* 0.54 people requiring treatment and care in least developed countries
0.36
Latin America and the Caribbean 0.33 represented 52 per cent of those countries’ populations, down
0.29
Europe and Northern America 0.33 from 584 million in 2015.
0.15
Eastern and South-Eastern Asia 0.12
0.14
Central and Southern Asia 0.11
0.07
Australia and New Zealand 0.09 Non-communicable diseases, mental health and
0.06
Northern Africa and Western Asia 0.08 environmental risks
0.52
World 0.40
■■ The probability of dying from any of the four main non-
0.0 1.0 2.0 3.0 4.0
communicable diseases – cardiovascular diseases, cancers, chronic
2010 2017
respiratory diseases and diabetes – between the ages of 30 and 70
* Excluding Australia and New Zealand. was 18 per cent in 2016. The risk remains markedly higher for men
globally, at 21.6 per cent, compared with 15 per cent for women.
Report of the Secretary-General on SDG Progress 2019 10■■ Progress has been made in reducing the global suicide rate (from ■■ Inadequate and unsafe drinking water, sanitation and hygiene is
12.9 per 100,000 in 2000 to 10.6 per 100,000 in 2016). However, linked to 60 per cent of the disease burden from diarrhoea, 100 per
suicide remains the second-highest cause of death among people cent of the burden from infections with soil-transmitted helminths
aged 15 to 29 globally, with 79 per cent of suicides found in low- and 16 per cent of the burden from protein-energy malnutrition,
and middle-income countries in 2016. leading to a total of 870,000 deaths in 2016 from the three
conditions.
■■ The prevalence of tobacco use declined from 27 per cent in 2000
to 20 per cent in 2016. Prevalence fell faster for women, from 11 per
cent in 2000 to 6 per cent in 2016, compared with men: prevalence Health systems and funding
in men only fell from 43 per cent to 34 per cent. Despite the
positive trends, the number of people dying from a tobacco-related ■■ Official development assistance (ODA) for basic health from
illness was estimated to be more than 8.1 million in 2017. all donors increased by 61 per cent in real terms since 2010 and
reached $10.7 billion in 2017. In 2017, some $2.0 billion was spent
■■ The number of road traffic deaths climbed from 1.31 million in 2013 on malaria control, $1.0 billion on tuberculosis control and $2.3
to 1.35 million in 2016. Road traffic injury is the leading cause of billion on other infectious diseases, excluding HIV/AIDS.
death for children and young adults aged 5 to 29.
■■ Available data from 2013 to 2018 indicate that close to 40 per
■■ Air pollution, both ambient and household, increases the risk of cent of all countries had fewer than 10 medical doctors per 10,000
cardiovascular and respiratory disease and, in 2016, led to some people, and more than 55 per cent had fewer than 40 nursing
7 million deaths worldwide. Sub-Saharan Africa and most of Asia and midwifery personnel per 10,000 people. All least developed
and Oceania (excluding Australia/New Zealand) have the highest countries had fewer than 10 medical doctors and fewer than 5
mortality rates associated with air pollution, as a large proportion dentists and 5 pharmacists per 10,000 people, and 98 per cent
of the population still rely on polluting fuels and technologies for had fewer than 40 nursing and midwifery personnel per 10,000
cooking. people.
The proportion of countries with an insufficient number of health-care
Share of cause-specific diseases attributable to air pollution, 2016 (percentage) professionals, latest available data from 2013–2018 (percentage)
100
80
20 21
Acute lower respiratory infections
60 64
Chronic obstructive pulmonary disease 58 60
7
Ischaemic heart disease
40
Lung cancer 39
19
Stroke
20
34
0
Fewer than 10 Fewer than 40 Fewer than 5 Fewer than 5
medical doctors nursing and midwifery dentists pharmacists
per 10,000 personnel per 10,000 per 10,000
population per 10,000 population population
population
Ensure inclusive and
equitable quality
education and promote
lifelong learning
opportunities for all
Despite the considerable progress on education access and
participation over the past years, 262 million children and youth aged
6 to 17 were still out of school in 2017, and more than half of children
and adolescents are not meeting minimum proficiency standards
in reading and mathematics. Rapid technological changes present Refocused efforts are needed to improve learning outcomes for the
opportunities and challenges, but the learning environment, the full life cycle, especially for women, girls and marginalized people in
capacities of teachers and the quality of education have not kept pace. vulnerable settings.
11 Special Edition■■ In 72 countries with recent data, approximately 7 in 10 children in reading and mathematics. Of these, about two thirds were
aged 3 and 4 were developmentally on track in at least three of attending school but were not learning in the classroom, or
the following domains: literacy-numeracy, physical development, dropped out school.
social-emotional development and learning.
■■ Some 750 million adults – two thirds of them women – remained
illiterate in 2016. Half of the global illiterate population lives in
Percentage of children and adolescents not achieving minimum proficiency in
reading and mathematics, 2015 (percentage) South Asia, and a quarter live in sub-Saharan Africa.
84
Sub-Saharan Africa 88
76 Proportion of global population who are illiterate, 15 years and older, 2016
Central and Southern Asia 81 (percentage)
52
Latin America and the Caribbean 36
57
Northern Africa and Western Asia 57
5
28
Eastern and South-Eastern Asia 31 9
22
Oceania 22
Southern Asia
14 10
Europe and Northern America 14 Sub-Saharan Africa
56 49
World 58 Eastern and South-Eastern Asia
0 20 40 60 80 100 Northern Africa and Western Asia
Mathematics Reading Other
27
■■ In 2017, two out of every three children globally participated in
organized learning one year before the official primary entry age.
Such learning is linked to fostering children’s readiness for school
and their future learning experience. That rate is less than 50 per
cent in sub-Saharan Africa and in least developed countries. ■■ Many developing countries still lack basic infrastructure and
facilities to provide effective learning environments. Sub-Saharan
Participation rate in organized learning one year before the official entry age for
Africa faces the biggest challenges: at the primary and lower
primary school, 2017 (percentage) secondary levels, less than half of schools have access to
electricity, the Internet, computers and basic drinking water.
Sub-Saharan Africa† 42
Northern Africa and Western Asia 52
Central Asia 56
Proportion of schools with access to basic school resources globally
Oceania 83
and in sub-Saharan Africa, upper secondary, 2017 (percentage)
Eastern and South-Eastern Asia 87
World Sub-Saharan Africa
Latin America and the Caribbean 95
Europe and Northern America 95
57
Least developed countries† 43 50
44
Landlocked developing countries 46
40
World 69 25
0 20 40 60 80 100 64 72 76 84 90
†
Based on 2016 data.
■■ In 2015, an estimated 617 million children and adolescents of
primary and lower secondary school age worldwide – more than
50 per cent – were not achieving minimum proficiency levels Electricity Basic Computer Basic Internet
drinking handwashing
water facilities
Number of school-age children out of school worldwide, by level of education
and sex, 2000–2017 (million)
400
■■ ODA for scholarships amounted to $1.3 billion in 2017. Australia,
300 France, Japan, the United Kingdom of Great Britain and Northern
Ireland and institutions of the European Union accounted for nearly
Female, 67 two thirds of this total.
200
Male, 71
■■ Globally, there has been little progress in the percentage of primary
100 Female, 30 school teachers who are trained: it has been stagnating at about 85
Male, 31
per cent since 2015. The proportion is lowest in sub-Saharan Africa
Female, 34
Male, 30
(64 per cent).
0
2000 2005 2010 2015 2017
Primary Lower secondary Upper secondary
Note: The numbers next to the sex represent 2017 data.
Report of the Secretary-General on SDG Progress 2019 12Goal 5. Achieve gender
equality and empower
all women and girls
While some indicators of gender equality are progressing, such as a
significant decline in the prevalence of female genital mutilation and
early marriage, the overall numbers continue to be high. Moreover,
insufficient progress on structural issues at the root of gender
inequality, such as legal discrimination, unfair social norms and
attitudes, decision-making on sexual and reproductive issues and low
levels of political participation, are undermining the ability to achieve
Sustainable Development Goal 5.
■■ Recent data from 106 countries show that 18 per cent of ever- ■■ According to recent data from some 90 countries, women devote
partnered women and girls aged 15 to 49 have experienced on average roughly three times more hours a day to unpaid care
physical and/or sexual partner violence in the previous 12 months. and domestic work than men, limiting the time available for paid
The prevalence is highest in least developed countries, at 24 per work, education and leisure and further reinforcing gender-based
cent. socioeconomic disadvantages.
■■ Women continue to be underrepresented at all levels of political
Proportion of ever-partnered women and girls aged 15 to 49 years subjected to
physical and/or sexual violence by a current or former intimate partner in the
leadership. As at 1 January 2019, women’s representation in
previous 12 months, latest available data, 2005–2017 (percentage) national Parliaments ranged from 0 to 61.3 per cent, with the
average standing at 24.2 per cent, an increase from 19 per cent in
Central and Southern Asia 23
2010. At the local level, data from 99 countries and areas show
Sub-Saharan Africa 22 that women’s representation in elected deliberative bodies varies
from less than 1 per cent to 48 per cent, with the median of the
Latin America and the Caribbean 12 distribution at 26 per cent. When legislated gender quotas are
adopted, significantly higher proportions of women are elected at
Europe 6
both national and local levels.
Least developed countries 24 ■■ While women represented 39 per cent of world employment, only
27 per cent of managerial positions in the world were occupied by
Landlocked developing countries 22 women in 2018, up only marginally from 26 per cent in 2015. The
proportion of women in management has increased since 2000 in
Small island developing States 16
all regions except in least developed countries.
World 18
Proportion of women in managerial positions, 2018 (percentage)
0 5 10 15 20 25
Northern Africa and Western Asia 12
Note: Only regions where available data cover at least 50 per cent of the population are
displayed in this figure. Central and Southern Asia 14
Oceania* 27
Sub-Saharan Africa 29
■■ The practice of child marriage has continued to decline around the
world, largely driven by progress in South Asia, where a girl’s risk Eastern and South-Eastern Asia 31
Parity
of marrying in childhood decreased by about one quarter between
Australia and New Zealand
2013 and 2018. In sub-Saharan Africa, levels of child marriage have 37
declined at a more modest rate. Europe and Northern America 37
■■ At least 200 million girls and women have been subjected to Latin America and the Caribbean 39
female genital mutilation, based on data from 30 countries where
the practice is concentrated and where nationally representative World 27
prevalence data is available. In these countries, the prevalence
of this harmful practice declined by one quarter between 0 10 20 30 40 50
approximately 2000 and 2018. * Excluding Australia and New Zealand.
13 Special Edition■■ In 51 countries with data on the subject, only 57 per cent of women ■■ Over the past 25 years, there has been progress in reforming laws
aged 15 to 49, married or in union, make their own decisions about towards improving gender equality, yet discriminatory laws and
sexual relations and the use of contraceptives and health services. gaps in legal protection remain in many countries. On the basis of
data collected across four areas of law in 2018 from 53 countries,
almost a third have legal gaps in the area of overarching legal
Proportion of countries with systems to track gender equality budgeting
allocations, by level of compliance, 2018 (percentage) frameworks and public life (e.g., constitutions, antidiscrimination
laws, quotas, legal aid); more than a quarter have legal gaps in the
Europe and Northern America (6) 83 17
area of violence against women; and 29 per cent and 24 per cent
Sub-Saharan Africa (27) 11 67 22
have legal gaps in the employment and economic benefits area and
Latin America and the Caribbean (9) 11 78 11 in the marriage and family area, respectively.
Oceania* (10) 20 50 30
■■ Despite progress in implementing gender-responsive budgeting
Northern Africa and Western Asia (7) 29 43 29
globally, gaps remain in country efforts to establish comprehensive
Eastern and South-Eastern Asia (6) 33 50 17
and transparent tracking systems. Based on 2018 data from 69
Central and Southern Asia (4) 75 25 countries, 13 countries fully met the criteria of having in place a
tracking system that measures and makes publicly available gender
World (69) 19 59 22
budget data, and 41 countries approached the requirements.
0 20 40 60 80 100
Fully meets requirements Approaches requirements Does not meet requirements
* Excluding Australia and New Zealand.
Note: Numbers in parentheses reflect the number of countries for which data are available.
Ensure availability
and sustainable
management of water
and sanitation for all
Despite progress, billions of people still lack safe water, sanitation and
handwashing facilities. Data suggests that achieving universal access
to even basic sanitation service by 2030 would require doubling the
current annual rate of progress. More efficient use and management
of water are critical to addressing the growing demand for water,
threats to water security and the increasing frequency and severity of writing, most countries are unlikely to reach full implementation of
of droughts and floods resulting from climate change. As of the time integrated water resources management by 2030.
Two different guide layers for two- and three-line titles. Global coverage of sanitation, drinking water and hygiene services,
Guides for edge of right-aligned text and bars are uniform (and account for 2000 and 2017 (percentage)
■■ Globally, the proportion of population using safely managed
space for other languages).
Swatches are of full, 75%, 50% and 25% color. Sanitation Drinking water Hygiene
drinking water services increased frombe61
All bars should 0p6towide
71 per cent between 100
4
2
with 0 spacing within country categories 9 6
2000 and 2015 and remainedandunchanged
0p2 spacing betweenin 2017. An additional
country categories. 21 12 3 18
If World, LDC, LDS or SIDS categories are spaced apart,
19 per cent of the global population used basic
0p6 spacing from main regions. drinking water 80
9 3
19
services. This means that 785Number
million people still lacked even a
labels should be inside color bars (ideally) and 0p3 from edge.
If outside, left-aligned and 0p3 away.
17
8
20 22
basic drinking water service. Number line 0p2 below bottom bar. Stroke .25pt.
Tick marks 0p3 long. Text 0p1 below tick mark.
60 5
Legend categories right-aligned, 1p0 apart, 0p3 between color bubble and 29
■■ The global population using safely
text.
managed
Legend color bubble 0p6. sanitation services
increased from 28 per cent inLegend
2000 0p6 to 43number
per line
cent inAny
2015 and tolegend.
28
below labels. note 0p6 below
40
Note uses hanging indent. 71
45 per cent in 2017, with the greatest increases occurring in Latin 61 60
America and the Caribbean, sub-Saharan Africa and East and 45
20
South-East Asia. Between 2000 and 2017, the proportion lacking 28
even a basic sanitation service decreased from 44 to 27 per cent,
yet 701 million people still practiced open defecation in 2017. 0
2000 2017 2000 2017 2017
Open defecation Surface water No facility
■■ In 2017, some 60 per cent of people worldwide and only 38 per Unimproved Unimproved Limited
Basic
Limited Limited
cent in least developed countries had a basic handwashing facility Basic Basic
Safely managed Safely managed
Report of the Secretary-General on SDG Progress 2019 14with soap and water at home, leaving an estimated 3 billion people
without basic handwashing facilities at home. Implementation of integrated water resources management, 2018 (percentage)
Average score
■■ In 2016, one third of all primary schools lacked basic drinking Latin America and the Caribbean 35
water, sanitation and hygiene services, affecting the education Central and Southern Asia 37
of millions of schoolchildren, but particularly girls managing Oceania* 38
menstruation, and one in four health-care facilities worldwide Sub-Saharan Africa 40
lacked basic water services, affecting more than 2 billion people.
Eastern and South-Eastern Asia 53
■■ Approximately one third of countries have medium or high levels
Northern Africa and Western Asia 55
of water stress. Almost all countries that have registered high Europe and Northern America 67
water stress are located in North Africa and West Asia or in Australia and New Zealand 72
Central and South Asia, and these levels indicate serious water
World 49
difficulties in the supply of freshwater, at least during parts of the
year. 0 20 40 60 80 100
Very high High Medium-high Medium-low Low Very low
* Excluding Australia and New Zealand.
Level of water stress: freshwater withdrawal as a proportion of total renewable
freshwater resources, latest available year, 2000–2015 (percentage)
■■ Following several years of steady increases and after reaching $9
billion in 2016, ODA disbursements to the water sector declined
by 2 per cent from 2016 to 2017. However, ODA commitments to
the water sector jumped by 36 per cent between 2016 and 2017,
indicating a renewed focus by donors on the sector.
ODA commitments and disbursements to the water sector, 2000–2017
(millions of constant 2016 dollars)
14,000
Less than 10 10¬25 25¬70 70 or more
12,000
■■ Of 172 countries, 80 per cent have medium-low implementation 10,000
or better of integrated water resources management. However, 8,000
60 per cent of countries are unlikely to reach the target of full
implementation by 2030. 6,000
4,000
■■ A significant effort is needed to ensure that cooperation is
operational in all transboundary basins. According to data from 2,000
67 of 153 countries that share transboundary waters, the average
0
percentage of national transboundary basins covered by an 2000 2005 2010 2015 2017
operational arrangement was 59 per cent in the period 2017–2018, Commitment Disbursement
with only 17 countries reporting that all their transboundary basins
were covered by such arrangements.
Goal 7. Ensure access
to affordable, reliable,
sustainable and modern
energy for all
Access to electricity in the poorest countries has begun to accelerate,
energy efficiency continues to improve and renewable energy is
making gains in electricity sector. Despite this progress, some 800
million people remain without electricity while access to clean cooking
fuels and technologies needs dedicated attention. In addition, if
Sustainable Development Goals 7, 13 and related Goals are to be met,
much higher levels of ambition are required with regard to renewable energy, including transportation and heating.
15 Special Edition■■ The global electrification rate rose from 83 per cent in 2010 to 87 2016, though much faster change is required to meet climate goals.
per cent in 2015, with the increase accelerating to reach 89 per Even though the absolute level of renewable energy consumption
cent in 2017. However, some 840 million people around the world has grown by more than 18 per cent since 2010, only since 2012
are still without access to electricity. has the growth of renewables outpaced the growth of total energy
consumption.
■■ Global primary energy intensity (ratio of energy used per unit
Proportion of population with access to electricity, 2000 and 2017 (percentage)
of GDP) improved from 5.9 in 2010 to 5.1 in 2016, a rate of
Sub-Saharan Africa 25
44
improvement of 2.3 per cent, which is still short of the 2.7 per cent
Oceania* 29 annual rate needed to reach target 3 of Sustainable Development
63
Central and Southern Asia 60 Goal 7.
91
87
Northern Africa and Western Asia 95
Eastern and South-Eastern Asia 91
98 Proportion of renewable energy in total final energy consumption and by end
Latin America and the Caribbean 92 use, 2010 and 2016 (percentage)
98
100
Europe and Northern America
Transport
100 2010 2.5 2.5
100
Australia and New Zealand 100 2016 3.3 3.3
78
World 89 2010 15.5 8.2 23.7
Heat
0 20 40 60 80 100
2016 15.1 9.0 24.1
2000 2017
* Excluding Australia and New Zealand.
Electricity
2010 19.8 19.8
2016 24.0 24.0
■■ The global share of the population with access to clean cooking
consumption
Total final
2010 7.9 8.6 16.5
energy
fuels and technologies reached 61 per cent in 2017, up from 57 per
2016 7.3 10.2 17.5
cent in 2010. Despite this progress, close to 3 billion people still
rely primarily on inefficient and polluting cooking systems. 0 5 10 15 20 25
Traditional use of biomass Modern renewable energy
Notes: Totals may not equal the sum of parts due to rounding. Heat refers to the amount
of energy used for heat-generating purposes. Traditional biomass use corresponds to
Proportion of population with access to clean cooking fuels and technologies, the use of local solid biomass resources by low-income households that do not have
2017 (percentage) access to modern cooking and heating fuels or technologies, including consumption in
the residential sector of developing countries.
■■ International financial flows to developing countries in support of
clean and renewable energy reached $18.6 billion in 2016, almost
doubling from $9.9 billion in 2010.
International financial commitments from official sources to developing
countries in support of clean and renewable energy, 2000–2016 (billions of
0¬10 50¬99 Data not available
dollars, constant 2016 prices)
10¬50 100 Not applicable
20
16
■■ The renewable energy share of total final energy consumption
gradually increased from 16.6 per cent in 2010 to 17.5 per cent in
12
Improvement rate of primary energy intensity, 1990–2010 and 2010–2016
8
(percentage)
-0.9
Oceania* 0.1 4
-0.4
Latin America and the Caribbean -0.8
0.3
Northern Africa and Western Asia -1.0 0
-1.1 2000 2004 2008 2012 2016
Sub-Saharan Africa -1.5
-1.8 Hydropower Solar Wind Geothermal Other renewable energy
Europe and Northern America -2.1
-1.1
Note: The category “other renewables” includes bioenergy, marine and other renewable energy.
Australia and New Zealand -2.2
-1.7
Central and Southern Asia -2.5
-1.3
Eastern and South-Eastern Asia -3.4
World -1.3
-2.3
-4 -3 -2 -1 0 1
1990¬2010 2010¬2016
* Excluding Australia and New Zealand.
Report of the Secretary-General on SDG Progress 2019 16Promote sustained,
inclusive and
sustainable economic
growth, full and
productive employment
and decent work for all
Inclusive and sustainable economic growth can drive progress and
generate the means to implement the Sustainable Development
Goals. Globally, labour productivity has increased and unemployment
is back to pre-financial crisis levels. However, the global economy
is growing at a slower rate. More progress is needed to increase informal employment and the gender pay gap and promote safe and
employment opportunities, particularly for young people, reduce secure working environments to create decent work for all.
■■ In 2017, the global growth rate of real GDP per capita was 1.9 per ■■ Informal employment, which has an impact on the adequacy of
cent and is expected to remain at about 2 per cent from 2018 to earnings, occupational safety and health and working conditions,
2020. This is significantly less than the 3 per cent rate attained remains pervasive: in three quarters of countries with data on the
in 2010 and slightly higher than the 2015 rate of 1.63 per cent. subject, more than half of all persons employed in non-agriculture
Real GDP growth rate for least developed countries is expected to sectors are in informal employment.
increase from 4.5 per cent in 2017 to 5.7 per cent in 2020, which is
less than the 7 per cent envisioned by the 2030 Agenda. ■■ Based on data for 62 countries, the median hourly gender pay gap
stood at 12 per cent. The median gender pay gap exceeded 20 per
Annual growth rate in real GDP in least developed countries, 2000–2017 cent in managerial and professional occupations, among workers in
(percentage) crafts and related trades and among plant machine operators and
10 assemblers.
■■ The global unemployment rate has finally recovered from the
8
global economic crisis. In 2018, the global unemployment rate
stood at 5.0 per cent – matching pre-crisis levels. Youth were three
times more likely to be unemployed than adults.
6
Unemployment rate, by region, age and sex, 2018 (percentage)
4 Northern Africa and Western Asia 9.9
Latin America and the Caribbean 8.0
Sub-Saharan Africa 5.9
Europe and Northern America
Region
5.8
2
2000 2005 2010 2015 2017 Australia and New Zealand 5.2
Eastern and South-Eastern Asia 3.9
Oceania* 3.5
■■ Since the global economic downturn of 2009, labour productivity Central and Southern Asia 3.2
(measured as GDP per employed person) has been increasing in Youth (15–24 years) 11.8
Age
the world, recording positive annual growth rates consistently since Adults (25+ years) 3.8
2010. In 2018, the world’s labour productivity increased by 2.1 per
Women 5.4
cent, its highest annual growth since 2010.
Sex
Men 4.7
Annual growth rate of real GDP per worker, 2015 and 2018 (percentage) World 5.0
0.1 0 2 4 6 8 10 12
Sub-Saharan Africa 0.3
-1.5
Latin America and the Caribbean 0.5
* Excluding Australia and New Zealand.
0.8
Oceania 1.1
2.1
Northern Africa and Western Asia 1.4
1.3
■■ In 2018, one fifth of the world’s youth were not in education,
Europe and Northern America 2.0 employment or training, meaning that they were neither gaining
3.8
Eastern and South-Eastern Asia 4.2 professional experience nor acquiring or developing skills through
4.0
Central and Southern Asia 4.8 educational or vocational programmes in their prime years. There
World
1.6
2.1
is a stark gender difference. Young women were more than twice
-2 -1 0 1 2 3 4 5
as likely as young men to be unemployed or outside the labour
2015 2018 force and not in education or training.
17 Special EditionYou can also read


