Analysis of Developments in EU Capital Flows in the Global Context - CEPS
←
→
Page content transcription
If your browser does not render page correctly, please read the page content below
Analysis of Developments
 in EU Capital Flows in the
 Global Context
 Increasing uncertainty in the wake of the
 Covid-19 pandemic

 December 2020

A study prepared by Cinzia Alcidi with contributions by Angela
Capolongo, Daniel Gros, Marvin Jahn and Roberto Musmeci. Mattia
di Salvo provided excellent assistance in data analysis and
visualisation
EUROPEAN COMMISSION
Directorate-General for Financial Stability, Financial Services and Capital Markets
Directorate E – Financial systems and crisis management
Unit E4 – Economic analysis and evaluation
Contact: FISMA-E4@ec.europa.eu
European Commission
B-1049 Brussels
EUROPEAN COMMISSION

Analysis of Developments in
 EU Capital Flows in the
 Global Context
 Increasing uncertainty in the wake of the
 Covid-19 pandemic

A study prepared by Cinzia Alcidi with contributions by Angela Capolongo,
Daniel Gros, Marvin Jahn and Roberto Musmeci. Mattia di Salvo provided
excellent assistance in data analysis and visualisation.

 Directorate-General for Financial Stability, Financial Services and Capital Markets Union
EUROPEAN COMMISSION

 EUROPE DIRECT is a service to help you find answers
 to your questions about the European Union
 Freephone number (*):
 00 800 6 7 8 9 10 11
 (*) The information given is free, as are most calls (though some operators, phone boxes or hotels may charge you)

LEGAL NOTICE
This study has been prepared for the European Commission under contract Service Contract
FISMA 2019/049/E. However, it reflects only the views of the authors and the Commission
cannot be held responsible for any use which may be made of the information contained
therein.
More information on the European Union is available on the Internet
(http://www.europa.eu).
Luxembourg: Publications Office of the European Union, 2019
ISBN 978-92-76-17255-0
doi:10.2874/158998
© European Union, 2019
Reproduction is authorised provided the source is acknowledged.

 Directorate-General for Financial Stability, Financial Services and Capital Markets Union
Table of Contents

Table of Contents .............................................................................................. 5
List of Figures ................................................................................................... 7
List of Tables .................................................................................................... 8
Executive Summary ........................................................................................... 9
List of Acronyms .............................................................................................. 13
1 Introduction .............................................................................................. 14
2 Global trends and developments in a highly uncertain landscape ...................... 16
 2.1 An overview of global flows and stocks ....................................................... 17
 2.2 Global net and gross flows by investment class ........................................... 20
 Foreign direct investment ................................................................... 20
 Portfolio investment........................................................................... 23
 Other investment .............................................................................. 25
 2.3 Capital flows of emerging market and developing economies under the Covid-19
 pandemic ......................................................................................................... 26
 Remittances ..................................................................................... 30
 Commodity prices: the great fall of oil ................................................. 31
 Capital flows, debt and debt relief in EMDEs ......................................... 33
3 The international role of the euro ................................................................. 36
 3.1 Demand for reserves ............................................................................... 36
 Foreign exchange reserve holdings and other official holdings ................. 37
 Does the current account matter? ....................................................... 38
 3.2 Determinates of currency composition of foreign exchange reserves .............. 40
 Global trade invoicing: the role of the dollar and the euro ...................... 41
 3.3 A forward-looking perspective ................................................................... 44
 Next Generation EU ........................................................................... 44
 Capital Markets Union ........................................................................ 44
4 Intra-EU capital movements ........................................................................ 46
 4.1 Components of the EU-27 financial account: gross and net flows ................... 48
 Foreign direct investment ................................................................... 48
 Portfolio investment........................................................................... 50
 Other investment .............................................................................. 51
 The net international investment position ............................................. 53
 4.2 East-West and North-South flows .............................................................. 54
 4.3 The state of EU financial integration........................................................... 58
 4.4 Intra-Eurosystem positions and the role of TARGET2 in financial integration ... 61
5 Disentangling EU-28 FDI ............................................................................. 66
 5.1 Methodology ........................................................................................... 68
 5.2 EU-28 FDI: real and phantom investment ................................................... 70
 5.3 The real EU-28 FDI network ...................................................................... 71
 5.4 Another look at intra-EU FDI and financial integration .................................. 77
6 EU FDI under policy uncertainty ................................................................... 79
 6.1 EU-US FDI and the role of trade policy uncertainty ...................................... 82
 The impact of the US Tax Cuts and Jobs Act ......................................... 85
 6.2 Investment protection and FDI .................................................................. 85
 6.3 Remarks on FDI and uncertainty ............................................................... 86
7 Implications and conclusions ....................................................................... 88
 7.1 Implications from recent developments in capital movements ....................... 88
 7.2 High uncertainty and downside risks ahead ................................................ 89
7.3 Policy priorities and challenges .................................................................. 90
References...................................................................................................... 91
 Annex I – Decomposition of FDIs, sampling procedure using ORBIS data ................. 95
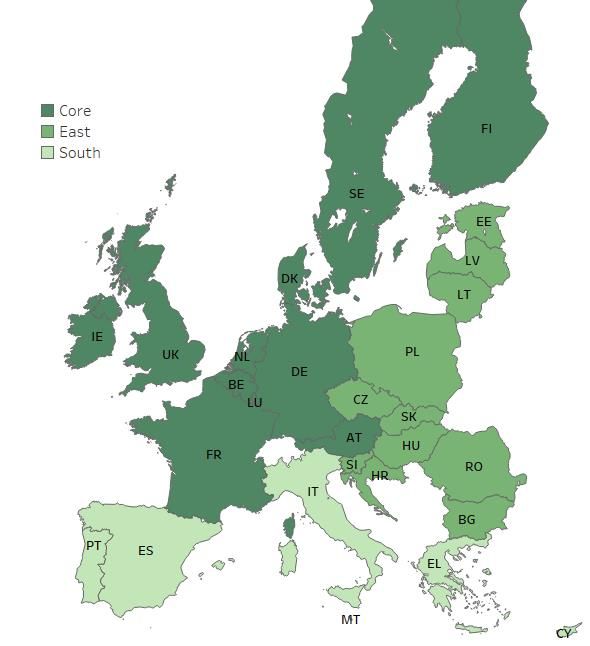
List of Figures

Figure 1. Quarterly GDP (2019Q1=100, dashed lines indicate WEO estimates from April
2020).................................................................................................................. 14
Figure 2. Current account balances, % of world GDP, 2005-2019 & 2020Q1-2 ............. 17
Figure 3. Financial account balances, % of world GDP, 2005-2020Q2 (annual and
quarterly) ............................................................................................................ 18
Figure 4. Reserve and related items, % of world GDP, 2005-19 & 2020Q1-2 ................ 19
Figure 5. Net International Investment Position, % of world GDP, 2005-19 .................. 20
Figure 6. Global FDI inflows, 1990-2019 (Indexed, 2010 = 100), average growth rates over
the sub-period ..................................................................................................... 21
Figure 7. Net Foreign Direct Investment Flows, % of World GDP - 2005-2020Q2 .......... 22
Figure 8. Foreign direct investment flows, assets, % of World GDP - 2005-2020Q2 ....... 23
Figure 9. Foreign Direct Investment Flows, Liabilities, % of World GDP - 2005-2020Q2 . 23
Figure 10. Net Portfolio Investment Flows, % of World GDP, 2005-2020Q2 .................. 24
Figure 11. Portfolio Investment Flows, Assets, % of World GDP, 2005-2020Q2............. 24
Figure 12. Portfolio Investment Flows, Liabilities, % of World GDP, 2005-2020Q2 ......... 25
Figure 13. Net Other Investment Flows, % of World GDP, 2005-19 (quarterly data for 2020
are not yet available) ............................................................................................ 25
Figure 14. Other Investment Flows, Assets, % of World GDP, 2005-2020Q2 ................ 26
Figure 15. EMEs: Net inflows in Funds, billion USD .................................................... 27
Figure 16. Emerging Markets Bond Index (basis points) ............................................ 28
Figure 17. Global Current Account Balance % of World GDP, IMF Forecasts for 2020 ..... 28
Figure 18. Exchange rates – selected EMEs, January-October 2020 ............................. 29
Figure 19. Real Effective Exchange Rate, changes April-September 2020, selected EMEs
countries ............................................................................................................. 30
Figure 20. FDI and remittances in southern countries neighbouring the EU .................. 31
Figure 21. Primary Commodity Indices, quarterly, 1995Q1-2020Q3 (2016=100) .......... 32
Figure 22. Commodity prices (index, 2014 =100): 2014-2020M8 ............................... 33
Figure 23. Regional breakdown of USD-denominated international debt issuance .......... 34
Figure 24. Snapshot of the international monetary system (2019Q4), % of total .......... 36
Figure 25. Foreign currency reserves, by country groups based on current account balance
(excluding euro area), $ billions ............................................................................. 38
Figure 26. Foreign exchange reserves and cumulated current account (2008-19):
persistent surplus countries ($ billions) ................................................................... 39
Figure 27. The USD dominates global trade invoicing (2017) ...................................... 42
Figure 28. Trade invoicing: export weighted average percentage share, 2018 .............. 43
Figure 29. Share of the euro in the invoicing of extra-euro area trade in goods (left panel)
and in the invoicing of extra-euro area trade in services (right panel), in % ................. 43
Figure 30. Number and share of funds by type and portfolio allocation ........................ 45
Figure 31. EU28 Gross flows, intra- vs extra-EU28EU-28, € millions EUR (2008Q4-2019Q4)
.......................................................................................................................... 46
Figure 32. EU27 Gross Flows, intra- vs extra-EU27, million EUR, (2015Q4-2020Q2)...... 47
Figure 33. Brexit impact: comparison of EU-27 and EU-28 (2015-2019, quarterly moving
averages) ............................................................................................................ 48
Figure 34. Gross FDI, EU-27, intra and extra, € millions, 2008Q4-2020Q2 ................... 49
Figure 35. EU FDI assets (left panel) and liabilities (right panel) by country, % of EU GDP
.......................................................................................................................... 49
Figure 36. Gross Portfolio Investment, EU-27, intra and extra .................................... 50
Figure 37. Portfolio investment Assets (left panel) and liabilities (right panel) by country,
% of EU GDP ........................................................................................................ 51
Figure 38. Gross Other Investment, EU-27, intra and extra ........................................ 52
Figure 39. Other investment, assets (left panel) and liabilities (right panel) by country, %
of EU GDP............................................................................................................ 52
Figure 40. EU-27 countries NIIP, % of EU-28 GDP (annual) ....................................... 53
Figure 41. Country groups: Core, East and South ..................................................... 54
Figure 42. EU assets vis-à-vis EU country groups: Core, South and East, averages 2000-
09 and 2010-19, % of EU GDP ............................................................................... 55
Figure 43. Core countries: FDI asset flows towards Eastern and Southern member states,
averages 2000-09 and 2010-19, in € millions ........................................................... 55
Figure 44. Core countries asset flows towards East: % of EU GDP .............................. 56
Figure 45. Core countries asset flows towards South: % of EU GDP ............................ 57
Figure 46. Quantity- and price-based indicators of financial integration in the euro area
(1999-2019M9) .................................................................................................... 59
Figure 47. Intra-EU27 cross-border holdings of equity and debt, 2002Q1-2020Q2 ........ 60
Figure 48. Intra-EU27 FDI and portfolio investment ratio, 2002Q1-2020Q2.................. 61
Figure 49. Target2 balances, end of month position, € millions, 2008M5- 2020M10 ...... 62
Figure 50. Intra-Eurosystem positions, € million, 2016M6-2020M10 ............................ 65
Figure 51. Correlation between quarterly FDI inflows and Outflows, 2013-Q1 to 2019Q1
.......................................................................................................................... 67
Figure 52. FDI Inward Positions of the EU28EU-28 by immediate investor (€ billion) ..... 70
Figure 53. FDI Inward Positions of the EU-28 by type of recipient entity (€ billion)........ 71
Figure 54. Real FDI: Share of FDIs in non-SPEs, by EU member state (2018)............... 71
Figure 55. Real FDIs, direct and indirect (2018) ....................................................... 72
Figure 56. Investor and recipient economies of direct FDIs (2018) .............................. 72
Figure 57. Investor and recipient economies of indirect real FDIs (2018) ..................... 73
Figure 58. Intermediate country of real indirect FDIs ................................................ 73
Figure 59. World Trade Uncertainty Index, 1996Q1 to 2020Q2 ................................... 80
Figure 60. Trade Policy Uncertainty at country level (2005Q1-2020Q2), selected countries
.......................................................................................................................... 82
Figure 61. EU-28 assets vis-à vis the US (lhs) and TPU in the US and the EU (rhs) ....... 83
Figure 62. EU-28 liabilities vis-à-vis the US (lhs) and TPU in the US and the EU (rhs) .... 83

List of Tables

Table 2. Estimation of real FDIs .............................................................................. 69
Table 3. Real FDIs in EU-28 (€ billions and %) ......................................................... 74
Table 4. Real FDIs in EU-28 by recipient and type (€ billions) ..................................... 75
Table 5. Real FDIs in EU-28 by type of investor (€ billions) ........................................ 76
Table 6. Real FDIs in EU-28, by recipient country groups (€ billions) ........................... 77
Table 7. Real Core FDIs by recipient country groups (€ billions).................................. 78
Table 8. Sampling procedure using ORBIS data ........................................................ 95
Analysis of Developments in EU Capital Flows in the Global Context

Executive Summary
This report presents an analysis of the main trends and developments in global and EU
capital movements up to 2019 and the challenges brought about by the Covid-19
pandemic.

The global overview of capital flows and the impact of the Covid-19 pandemic
Covid-19 has been a major shock across the world in 2020, and the impact on individuals,
the society and the economy has been pervasive. Most countries are now trying to recover
from the GDP collapse of the first half of the year, but there are significant obstacles to full
recovery. Capital movements are not independent of such developments. While
coordination and policy measures in advanced economies have helped to restore calm on
financial markets and restart capital flows quickly, the impact of the pandemic has been
sudden and large on flows, especially for emerging market economies (EMEs), and the
shock continues. Even though further sudden stops are unlikely, it is very difficult to predict
if and when flows will return to previous levels.
Furthermore, the pandemic shock is adding to a context already characterised by high
policy and political uncertainty at global level. This may lead to an amplification of pre-
existing trends but also of vulnerabilities, especially in emerging market and developing
economies (EMDEs). Overall, all these factors are very likely to result in higher volatility of
financial flows and, at least in the short term, lower flows. Real economy investments,
which are relatively small in size but are important for economic growth, are also likely to
contribute negatively as they may remain on hold. The latter consideration also applies to
advanced economies.
The virus containment measures, namely the lockdown and social distancing, have resulted
in the collapse of three crucial sources of income for several EMEs and developing
countries: exports of commodity, tourism and remittances. For several countries, the fall
in domestic income combined with weaker growth prospects may hamper the ability to
finance expenditure and even to borrow. This will certainly be the case for those countries
that have been cumulating increasing amounts of debt over the past few years and may
struggle to find a counterpart to finance current account deficits. The IMF projects current
account deficits to decline in all EMDEs in 2021. In addition, the plunge in oil prices by
reducing, or even wiping out, the surplus of oil exporters is likely to have a substantial
impact on capital inflows in EMEs. A significant part of the capital inflows into EMEs comes
from sovereign wealth funds (SWFs) in West Asia and in Europe.
China is the only country for which the current account is expected to expand in 2021.
Uncertainty dominates the euro area surplus, which may be shrinking substantially because
of the widespread lockdown measures in Europe. Against this background, the US, with its
expansionary fiscal policy, may become the main counterpart of the Chinese surplus – a
reminder of the situation before the great financial crisis, though financial accounts’
conditions are very different today than they were in 2007.
While the world economy is expected to expand strongly in 2021, longer-term prospects
for growth point to a weak outlook because of the persistence of social distancing (from
people’s attitudes as well as policy measures), the need for sectoral restructuring, much
higher debt levels, both private and public, and a protracted period of lower investments.
Intra- and extra-EU flows and the state of EU financial integration
The study looks in detail at intra- and extra-EU flows. The pandemic has not been the only
major change in 2020. At the time of writing, yet no agreement has been reached between
the EU and the UK on the latter’s exit from the EU block, but Brexit has become a reality

 9
Analysis of Developments in EU Capital Flows in the Global Context

in the statistics. Data for EU aggregates have been updated to include 27 member states
instead of 28. By definition the change will result in a reduction of intra-EU capital flows
and, in principle, an increase in extra-EU flows. In the absence of a clear deal between the
EU and the UK, however, it is difficult to predict the extent to which Brexit will simply mean
a shift from intra- to extra-EU capital flows, with no impact on the size, or whether flows
will decline as a result, and herald a lower degree of financial integration.
The study contributes to better understanding of EU capital flows on four main points.
First, intra- and extra-EU flows fell substantially from the last quarter of 2017. While
portfolio investments performed quite well (especially the intra-EU category), foreign direct
investment (FDI) dropped quite dramatically. This effect appears to be temporary in
nature, however, having been driven by a one-off change in US tax policy. The US Tax
Cuts and Jobs Act of December 2017 strongly incentivised the repatriation of profits from
abroad. The impact on intra-EU flows is likely to be related to US investment in the EU
sometimes being channelled through a different country from the final destination of the
investment. As the effect of the policy measures fade, all things being equal, flows should
return to normal. However, because of the pandemic shock, any return to normal is likely
to be offset by other factors.
Second, the state of financial integration in the EU appears strong. Following the ECB
approach, we compute indicators of resilience of financial integration to cover the EU-27.
Overall, the resilience of EU financial integration appears to have improved strongly since
the financial crisis. In the past couple of years, however, it seems to have levelled out, and
some indicators even point to a slight deterioration from late 2018. The data for the first
half of 2020 point a continuation of such trend without any major change.
Third, longer-term trends in intra-EU capital flows have experienced some major changes.
By looking at three geographical clusters of countries: Core (north and continental EU
member states), East (new EU member states) and South (euro area southern member
states), macro trends over the past two decades seem to point to the financial crisis as a
major turning point. For the Southern member states, the crisis marked the end of large
portfolio investment and a new era of substantial disinvestments from Core countries. By
contrast, FDI and other investment remained quite resilient. For Eastern countries, FDI has
represented a major source of flows and average figures do not suggest much change over
the past two decades. Only data for the past year point to a fall, which for several reasons
may indicate the beginning of a new trend. In addition, 15 years after the first Eastern
enlargement, capital markets seem to have made limited progress in terms of capacity to
attract other investment than FDI. A final point is that while Core countries have always
been the main source of capital flows, since 2010 they have also become the main
destination of investment. This group of countries is both home and host to the largest part
of intra-EU flows, which have strongly increased in size over time.
Four, TARGET2 balances provide an additional perspective for monitoring financial
integration in the euro area. Since the debt crisis in the euro area, TARGET2 balances have
received systematic attention as an indicator of imbalances that cannot be ‘naturally’
compensated by market funding streams and require resorting to the Eurosystem. In this
perspective, TARGET2 balances are a useful indicator of the attractiveness of euro area
countries and are monitored as a key indicator of the interbank market’s normalisation.
The study notes that since 2015 imbalances have started to grow again and at the end of
2016 were larger than at the peak of the financial crisis. Lack of market liquidity and falling
financial integration, however, are not the explanation for such an increase. This suggests
that, at least partly, imbalances reflect the way transactions are recorded and are not
necessarily a situation of financial distress. The study also highlights that while TARGET2
is the primary – in terms of magnitude – consolidation adjustment mechanism of the
Eurosystem, it is not the only one. Considering intra-Eurosystem positions as a whole

 10
Analysis of Developments in EU Capital Flows in the Global Context

suggests that cross-country imbalances are overall smaller and have been changing in a
much smoother fashion than the TARGET2 balances.
EU FDI
The study contributes an important analysis of the size and counterparts of EU FDI. FDI is
usually considered an important driver of international economic integration and of
economic growth. There is growing consensus, however, that current statistics about total
FDI substantially overestimate their expected productivity gains. The study looks in depth
at EU member states inward FDI positions driven by intra- and extra-EU flows, with the
purpose of distinguishing ‘real’ FDI from those channelled by Special Purpose Entities
(SPEs). The latter are often empty shells and inward FDI have no or limited impact on the
real economy of the receiving country.
In 2018, according to Eurostat data, the stock of inward FDIs in the EU-28 countries
amounted to approximately €15 trillion. More than half of this (some €8.4 trillion)
originated in other EU-28 countries, while 45% (about €6.7 trillion) came from non-EU
economies.
Following the approach of Dagmaar et al. (2019), we calculate ‘real’ EU FDI positions by
netting FDI involving SPEs. The study finds that just less than half (47.5%) of the total
inward FDI positions in the EU-28 involves SPEs. In Luxembourg, Malta and Cyprus, the
stock of inward FDIs is almost entirely (more than 90%) directed into SPEs, in the
Netherlands more than two thirds and in Hungary close to half. By contrast, in the larger
EU economies such as France, Germany, Italy and also Spain, inward FDIs are totally or
almost totally real.
Based on EU company level data, the stock of ‘real’ FDIs is decomposed by immediate and
ultimate investors. Standard statistics that rely on the location of the immediate investors
could be misleading in identifying the actual source of investment. The study finds that for
about €2.1 trillion of the stock of real FDIs in the EU-28 (about one quarter of the total),
the country of the ultimate investors is different from that of the immediate investors, i.e.
the investment decisions and the associated risks are ultimately borne by companies
residing in a different country from the one from where the FDI position is reported under
the official statistics. The US is not only the most important direct investor (where
immediate and ultimate investor country coincides) but also indirect investor into the EU-
28. The US accounts for about 40% of the indirect real EU FDIs.
Overall, it is estimated that about €1.1 trillion of FDI in the EU (about 14% of the total real
FDIs’ position in the EU-28) originates from ultimate investors residing outside of the EU-
28 countries, while the investment is intermediated by one of the EU-28 countries. Such
an amount is typically included in official statistics as intra-EU FDI. Among EU countries,
the largest difference between real immediate and real ultimate FDI investors is registered
in Luxembourg and the Netherlands. Real FDI with ultimate owners resident in Luxembourg
and the Netherlands are much lower than the total. On the contrary, the real ultimate FDIs
from the US are estimated to be some 75% larger (€1.8 trillion) than real immediate FDIs
(€1 trillion). With the exception of Switzerland, for all non-EU countries, FDI (into the EU)
based on ultimate investor location, is substantially larger than real immediate FDI.
While these results are based on estimations and exact numbers should be taken with a
pinch of salt, their magnitude leaves little doubt about the importance. This exercise has
important wider implications. A very clear one is that standard statistics based on FDI
overestimate financial integration links between EU-28 member states and underestimate
the integration between large EU economies and non-EU countries.
The international role of the euro and the asset composition of reserves

 11
Analysis of Developments in EU Capital Flows in the Global Context

The study contributes to the growing academic and policy debate about the international
role of the euro by looking into one specific aspect of the international role of a currency,
namely, demand for reserves. Evolving features of this demand, in terms of asset
composition, and the inclusion of official holdings other than foreign reserves, as demand
for international currencies, can offer a wider perspective on the potential of the euro.
Central banks that hold very large amounts of reserves are unlikely to need all their
reserves to intervene in foreign exchange markets. Some of these central banks de facto
manage the savings of their own country. This situation is similar to one in countries, most
often commodity exporters, where an SWF manages the income generated by exports.
Such central banks and SWFs manage a huge amount of resources, which, through their
investment, massively affect the international role of a currency. Yet, unlike in the case of
official reserves, the currency composition may be less important than the instrument
composition. Interestingly, when managing savings instead of the exchange rate, the
target of the investment tends to be different from traditional safe, liquid, short-term
assets, i.e. sovereign bonds. The typical instruments of official reserves are likely be
replaced by others yielding higher returns. In practice, SWFs mostly invest in equities. In
recent years, some central banks appear to have extended the maturities of their purchase
and to have moved towards riskier assets.
Both points suggest that development of equity markets in the EU could, among other
objectives, contribute to boosting the international role of the euro. Capital Markets Union
(CMU) developments can contribute to increasing the supply of euro-denominated equities
in international markets. In global markets, equities are by far and large denominated in
US dollars (USD). For investors, USD-denominated equities may not be a choice out of
preference but rather from lack of opportunities, given the limited availability of euro-
denominated assets. In a similar vein, euro-denominated EU bonds with long maturities to
be issued under the Next Generation EU (NGEU) programme are also likely to be attractive
to official holders.
Conclusions
In the short term the key policy priority for governments will be to mitigate the impact of
the pandemic and counter the recession. Yet many countries, both EMDEs and advanced
economies, are already facing the difficult dilemma of how to implement measures to
support growth (over a protracted period of time) while avoiding further build-up of debt
that will be hard to service in the future. Such developments are important for capital flows.
Investors may become more selective when choosing the destination of their funds than
they have been in the past.
A key insight from the study is that policy implications based on the analysis of statistics
that do not properly represent reality (any more) may be disappointing. The in-depth
analysis on the nature of FDI suggests that what is called FDI includes capital flows, which
have little to do with FDI in a traditional sense. This general finding is not new, and the
OECD, IMF and Eurostat are very aware of the need to improve available statistics. Our
findings show that as much as 50% of total inward FDI positions in EU countries are
directed in SPEs, and that as much as 1 trillion of FDI inward positions, believed to be intra-
EU investment, are in reality coming from abroad and intermediated by an EU country.
Disregarding this aspect can lead to serious double counting and misleading calculations.
The finding has several implications from the policy perspective: i) growth and employment
creation associated with FDI is much lower than one would expect from simply looking at
sheer numbers; ii) FDI flows, which should be a source of resilient financial integration,
may be less stable than assumed and unable to deliver international risk sharing in the
face of asymmetric shocks; and iii) tax policy measures may be more powerful than growth
strategies in affecting FDI.

 12
Analysis of Developments in EU Capital Flows in the Global Context

List of Acronyms

 APP Asset Purchase Programme
 BIT Bilateral investment treaty
 CDIS Coordinated Direct Investment Survey
 COFER Currency Composition of Official Foreign Exchange Reserves
 CMU Capital Markets Union
 ECB European Central Bank
 EMDEs Emerging Market and Developing Economies
 EMEs Emerging market Economies
 EMU Economic and Monetary Union
 EPU Economic Policy Uncertainty
 FDI Foreign Direct Investment
 NCB National Central Banks
 NGEU Next Generation EU
 NIIP Net International Investment Position
 SPEs Special Purpose Entities
 SWF Sovereign Wealth Fund
 SWIFT Society for Worldwide Interbank Financial Telecommunication
 TARGET Trans-European Automated Real-Time Gross Settlement
 Express Transfer System
 TPU Trade Policy Uncertainty
 USD US Dollar
 WEO World Economic Outlook
 WTO World Trade Organization

 13
Analysis of Developments in EU Capital Flows in the Global Context

1 Introduction
This study aims to monitor and analyse capital movements in the European Union in the
global context. Free movement of capital is a condition for economic growth and a key
pillar of the EU single market.
Views about capital movements have often fluctuated over time between seeing them as
highly desirable or a source of vulnerability, as a driver of economic growth or disconnected
from the real economy. While different judgements can hold in different periods or regions,
there is no doubt that macroeconomic conditions, uncertainty and policies strongly interact
with capital flows and affect their size, direction, instrument and outcome. In recent years,
changes in global economy conditions have altered cross-border flow and, most likely,
more change is to come.
The major, unforeseen shock of Covid-19 in 2020 has had a pervasive impact on
individuals, the society and the economy, with massive human loss across the entire
world. Most countries, in the absence of a vaccine or a cure, have been forced into lockdown
and social distancing to contain the spread of the contagion. This has led to the collapse of
economic activity and the extent of the consequences are still uncertain, not least because
the pandemic is ongoing. Unfortunately, there is no doubt that GDP losses are larger than
those of the global financial crisis of 2009 and the range of impacts will be unlike anything
experienced in the past century.
In April 2020, just two months after the outbreak of Covid-19, the IMF forecasted severe
falls in GDP for all countries, and negative real growth rates everywhere except China (and
India). The updated estimates realised in June, and which accounted for the impact of the
lockdown in Q2, forecasted even larger falls in almost all countries. This appears to be the
case especially for advanced economies, where the decline has a double-digit number and
is expected to be persistent, leading to a level of GDP below 2019Q4 until the first quarter
of 2021 (see Figure 1). In EMDEs, the revision of the estimates has been less substantial,
but it may take until 2022 to return to the level of 2019.

Figure 1. Quarterly GDP (2019Q1=100, dashed lines indicate WEO estimates from April
2020)

 115

 110
 AE April
 105 2020

 100 AE June
 2020
 95
 EMDE
 90 April 2020

 85
 EMDE
 June 2020
 80

Source: Based on IMF, WEO April 2020 and update June 2020.

 14
Analysis of Developments in EU Capital Flows in the Global Context

The partial return to economic activity over the summer resulted in better than anticipated
performance and a further revision of the forecasts. As we write, the world economy is
projected to fall by 4.4% and the euro area by 8.3%, compared with 4.9% and 10.2%
respectively, as forecasted in June (see Table 1).
Table 1. Real growth rates comparison (selected regions and countries)

 Projection Projection June
 October 2020 2020
 2019 2020 2021 2020 2021

 World 2.8 -4.4 8.5 -4.9 5.4

 Advanced economies 1.7 -5.8 3.9 -8.0 4.8
 US 2.2 -4.3 3.1 -8.0 4.5
 EA 1.3 -8.3 5.2 -10.2 6.0
 Germany 0.6 -6 4.2 –7.8 5.4
 France 1.3 -9.8 6 –12.5 7.3
 Italy 0.3 -10.6 5.2 –12.8 6.3
 Spain 2.0 -12.8 7.2 –12.8 6.3
 UK 1.4 -9.8 5.9 –10.2 6.3
 Japan 0.7 -5.3 2.3 –5.8 2.4
 Emerging market and 3.7 -3.3 6 -3.0 5.9
 developing economies
 China 6.1 1.9 8.2 1.0 8.2
Source: IMF, WEO, October and June 2020.

Yet the further spread of the virus since the beginning of the autumn has meant an increase
in the downside risks. Many countries are reinstating lockdown measures, and uncertainty
remains extremely high for the last quarter of the year.
Policymakers have taken unprecedented measures to offset the negative impact of such a
double shock to demand and supply, and to foster the recovery. The magnitude and the
length of the shock, however, make the shape of the recovery unclear and highly
dependent on the waves of the pandemic. This will be the case even if governments – and
this is clearly the case in the EU – are committed to maintaining support measures for as
long as they are necessary. The recovery that took place over the summer exposed the
strong sectoral impact of the crisis and changes in people’s behaviour that are likely to
remain even after the pandemic is under control. In addition, the longer the pandemic
lasts, the higher the probability that more countries will face a combination of economic,
financial and social crises.
Capital movements are certainly not independent of such developments. The impact of the
pandemic has been sudden and immediate. News about the spread of the virus in early
2020 led to a very quick and deep fall in cross-border flows. They stabilised in the following
months but it is still unclear if and when they will return to previous levels. In the short
run, it is also difficult to predict whether the new waves of pandemic will lead to new falls
or long lasting effects. As will be argued throughout the study, the pandemic shock is
exacerbating uncertainty in a context of already high policy and political uncertainty. All in
all, these factors are very likely to result in higher volatility for financial flows and, at least
in the short term, lower flows, as real economy investment is put on hold.
The rest of the study is organised as follows. Section 2 monitors global trends and
developments in international capital movements over the past 15 years. This is
complemented by an overview of the situation in EMEs and developing countries, with a
focus on two aspects: exchange rate and current account developments, and the ongoing
debate on debt relief in Africa.

 15
Analysis of Developments in EU Capital Flows in the Global Context

Section 3 looks at the recent debate on how to enhance the international role of the euro.
It investigates two specific aspects with a novel dimension: the accumulation of foreign
assets by SWFs, which has been growing over time and has similarities with central bank
reserves’ accumulation, and the use of international currencies in global trade invoicing.
Section 4 first offers an overview of intra-EU capital flows, then focuses on the evolution
of flows across clusters of member states over the past two decades. The third part gives
an overview of the measures of resilience of financial integration. The last part focuses on
the euro area and inspects intra-Eurosystem positions, including TARGET2, and their
meaning for financial integration.
Section 5 is devoted to EU FDI. First, it develops an in-depth analysis of EU inward FDI
positions, driven by intra- and extra-EU flows, with the purpose of distinguishing real flows
from those channelled by SPEs. The latter are often empty shells with no string links with
the local economy. In such cases, inward FDIs have no or limited impact on the real
economy where the SPEs is located. Following Dagmaar et al. (2019), we call these flows
phantom FDI. Once real flows are disentangled from phantom FDI, a full EU-28 FDI network
position (as well for each EU member state) is estimated. We distinguish positions in
countries hosting the ultimate and immediate investor. This is the basis for redefining a
real network of FDI.
Section 6 investigates the potential impact of trade policy uncertainty on EU FDI, in
particular EU-US FDI, as the US is the main source of trade uncertainty at global level and
the main investment partner of the EU.
Section 7 concludes by drawing policy considerations based on the evidence provided in
the study and highlighting the risks to capital flows associated with the pandemic.

2 Global trends and developments in a highly uncertain
 landscape

This section presents a global overview of the main components of the balance of
payments, namely current account and financial account, to show the broad direction of
capital flows across countries and over time. For clarity, countries are clustered into groups
based on similar characteristics, as shown in Box 1.

Box 1. Definition of the country groups

The identification of the country groups follows Claeys et al. (2019). Such clustering is reasonable,
makes the data visualisation readable and ensures no disruption compared with the analysis in
previous reports on EU capital movements.
Criteria for the groups are mainly common characteristics and global relevance, as measured by
GDP. The groups are:
• China
• Deficit advanced economies: Australia, Canada and New Zealand
• Deficit emerging economies: India, Indonesia, South Africa and Turkey
• Euro area: 19 countries
• Financial centres: Hong Kong, Singapore and Switzerland
• Japan
• Latin America: Argentina, Bolivia, Brazil, Chile, Colombia, Ecuador, Mexico and Uruguay
• Non euro-area Central and Eastern Europe (CEE) countries: Bulgaria, Croatia, the Czech Republic,
Hungary, Poland, and Romania
• Non euro-area Nordics: Denmark and Sweden
• Oil exporters: Norway, Russia and Saudi Arabia
• Surplus Asia: Philippines, South Korea and Thailand
• United Kingdom
• United States of America

 16
Analysis of Developments in EU Capital Flows in the Global Context

2.1 An overview of global flows and stocks
In modern economies, the current account balances, which reflect savings and
investments, are not equivalent to capital flows, which reflect the ability of a country to
lend, borrow and perform financial intermediation. Yet before moving to the detailed
analysis of the different categories of capital flows, it is instructive to look at global trends
and the state of current account balances. These are informative about resource availability
and potential constraints in lending and borrowing associated with the real economy.
Until the outbreak of Covid-19, the two countries with the largest world current account
deficit since 2009 (see Figure 2) have shown limited change in their balances. The US
deficit continues oscillating around 0.6% of the world GDP and the UK’s at around 0.12%.
Other deficit countries have slightly reduced their negative position. On the surplus side,
over time, the large current account surplus of China has almost disappeared, and it shows
a mild rebound in 2019. China’s place was taken by the increasing surplus of the EU and
of other Asian countries, including Japan. In 2019, the euro area current account surplus
exhibited a small decline compared with previous years but remained the largest on a
global scale.
According to AMECO and Eurostat balance of payment data, the euro area current account
surplus declined from 3.1% of euro area GDP to 2.7% in 2019, and the EU from 3% to
2.8%. In the euro area the decrease was driven by a smaller surplus for services (down
from €116 billion in 2018 to €68 billion in 2019) and primary income (down from €95 billion
to €81 billion). The latter was largely caused by developments in the investment
income balance (down from €65 billion to €55 billion), which mainly reflected a lower
surplus in direct investment income. Such developments were marginally offset by an
increase in the surplus for goods.
Figure 2. Current account balances, % of world GDP, 2005-2019 & 2020Q1-2

 2
 United States
 1.5
 United Kingdom

 1 Surplus_Asia

 0.5 Oil_Exporters

 NonEuroNord
 0
 NonEuroCCE
 -0.5
 Latin_America

 -1
 Japan

 -1.5 Financial_Centre

 -2 Euro_Area

 Deficit_Emerging
 -2.5
 2005

 2006

 2007

 2008

 2009

 2010

 2011

 2012

 2013

 2014

 2015

 2016

 2017

 2018

 2019

 2019-Q1

 2019-Q2

 2019-Q3

 2019-Q4

 2020-Q1

 2020-Q2

 Deficit_Advanced

 China

Source: IMF, International Financial Statistics (IFS) and World Economic Outlook (WEO), October 2020.

Note: See Box1 for group composition.

It is still too early to say how persistent the changes illustrated by the 2020 data will be,
but the first two quarters indicate a quite drastic fall in euro area surplus, an increase in

 17
Analysis of Developments in EU Capital Flows in the Global Context

the US deficit and the return of a large China surplus. To a large extent they reflect the
timing of the impact of the pandemic. China was hit before the rest of the world, and so
able to restore supply almost fully in the second quarter while the EU economy was in
lockdown and the US undertaking a fiscal stimulus.
It should be noted that the figures for 2020 presented above ‘hide’ a large fall in global
trade transactions and a fall in world GDP of about 5%. Yet, based on recent data, China’s
trade is recovering strongly, and manufactured exports are expected to reach about $2.5
trillion in 2020.1 At the moment, China is the only world country experiencing an increase
in exports. The increase has been driven by high world demand for medical and personal
protective goods and a boom in office machinery2 to facilitate remote working, two sectors
that are strengths of China. The fall in outbound travel is likely to have contributed to an
increase in China’ s current account surplus, by reducing the deficit in services.
While the drivers of China exports’ expansion look at the moment to be of temporary
nature, other world countries have reduced either their surplus or their deficit, and as
matter of fact the US deficit is the main counterpart to China’s surplus. If such
developments continue, we may see old trends re-emerging and the two main sides of the
pre-financial crisis global imbalances, China and the US, resuming their roles.
Pre-pandemic, longer-term developments in the current account balances are largely
reflected in the net financial account balances, with limited changes in 2019, compared
with the previous two years (see Figure 3). By contrast, the data for 2020 point to a
substantial reduction in the positive balances, and in particular that of the euro area and
Japan, whereas the US, the UK and the financial centres display a negative balance, similar
to in the past. More details about the drivers behind these changes are given in the
following sections.

Figure 3. Financial account balances, % of world GDP, 2005-2020Q2 (annual and
quarterly)

 2
 United States
 1.5
 United Kingdom
 1
 Surplus_Asia

 0.5
 Oil_Exporters

 0 NonEuroNord

 -0.5 NonEuroCCE

 -1 Latin_America

 -1.5 Japan

 -2 Financial_Centre

 Euro_Area
 -2.5
 Deficit_Emerging
 -3
 2013
 2005

 2006

 2007

 2008

 2009

 2010

 2011

 2012

 2014

 2015

 2016

 2017

 2018

 2019

 2019-Q1

 2019-Q2

 2019-Q3

 2019-Q4

 2020-Q1

 2020-Q2

 Deficit_Advanced

 China

Source: IMF, International Financial Statistics (IFS) and World Economic Outlook (WEO), October 2020.

1
 See OECD https://www.oecd.org/sdd/its/International-trade-statistics-Q2-2020.pdf
2
 See UNCTAD global trade update https://unctad.org/system/files/official-document/ditcmisc2020d2_en.pdf

 18
Analysis of Developments in EU Capital Flows in the Global Context

Reserve accumulation activities declined strongly after 2013 owing to changes in China’s
behaviour and the fall in surplus of oil-exporting countries (see Figure 4), low negative and
positive flows remained quite stable in 2018 and 2019. In 2020, because of the dramatic
fall in the price of oil (see next section on this point) and foreign exchange interventions
to support currency pegs, reserves of oil exporters declined in both quarters. Also, China
registered a fall in Q1, but the signs had already taken a positive turn by Q2. The swing is
likely to reflect the current account balance and interventions in the foreign exchange
markets to stabilise the renminbi. The largest increase in reserves was registered in
financial centres in both quarters of 2020. Financial centres also increased their reserve
accumulation in the aftermath of the global financial crisis.3

Figure 4. Reserve and related items, % of world GDP, 2005-19 & 2020Q1-2
 2
 United States

 United Kingdom
 1.5
 Surplus_Asia

 1 Oil_Exporters

 NonEuroNord

 0.5 NonEuroCCE

 Latin_America
 0
 Japan

 Financial_Centre
 -0.5
 Euro_Area

 Deficit_Emerging
 -1
 2010

 2016
 2005

 2006

 2007

 2008

 2009

 2011

 2012

 2013

 2014

 2015

 2017

 2018

 2019

 2019-Q1

 2019-Q2

 2019-Q3

 2019-Q4

 2020-Q1

 2020-Q2

 Deficit_Advanced

 China

Source: IMF, International Financial Statistics (IFS) and World Economic Outlook (WEO), October 2020.

Until 2019, when moving from flows to stocks, the Net International Investment Positions
(NIIP) show that most individual countries and country groups continued to reinforce their
respective position, either as creditor or debtor (see Figure 5). The main exception is the
euro area, which eliminated its negative position. Its net international investment position
vis-à-vis the rest of the world is now at zero.
In a forward-looking perspective, it is reasonable to expect that the international
investment positions will continue along the same path as in the past, and possibly widen
because of the large fall in GDP (the denominator of the ratio). From next year onwards,
the expected strong recovery in GDP, paired with persistent subdued flows, may result in
a contraction of both creditor and debtor positions.

3
 See Section 3 for a detailed analysis of developments of international reserve assets.

 19
Analysis of Developments in EU Capital Flows in the Global Context

Figure 5. Net International Investment Position, % of world GDP, 2005-19

 15
 United States

 10 United Kingdom

 Surplus_Asia

 5 Oil_Exporters

 NonEuroNord
 0 NonEuroCCE

 Latin_America
 -5
 Japan

 Financial_Centre
 -10
 Euro_Area

 Deficit_Emerging
 -15
 Deficit_Advanced

 -20 China
 2005

 2006

 2007

 2008

 2009

 2010

 2011

 2012

 2013

 2014

 2015

 2016

 2017

 2018

 2019
Source: IMF, International Financial Statistics (IFS) and World Economic Outlook (WEO), October 2020.

2.2 Global net and gross flows by investment class
This subsection monitors the evolution of the global distribution of net and gross flows by
investment class in the financial account: FDI, portfolio investment and other investment,
with special attention to the developments in 2020.4 It should be noted that net financial
account balances hide all purely financial transactions, which would be reflected in the
gross balances. Net balances thus offer a narrower perspective to capital flows.

 Foreign direct investment
From the perspective of the real economy and economic growth, FDI usually represent the
most important investment category of the financial accounts.
To better guess how trends in global FDI could evolve in the future, it is instructive to start
by looking at the long-term data of global FDI. During the past three decades, FDIs have
been characterised by three different phases with very different growth rates (see Figure
6).
After two periods characterised by a very high growth rate, FDI have stagnated since the
global financial crisis. A slightly negative average growth rate over the decade 2008–19,
compared with double-digit rates in the previus two decades, hides higher volatility than
in the past. This is caused by several factors, but on a global scale, the sharp fall in 2017
and 2018, which came after a quite strong recovery, is widely attributed to the effect of
the US tax reforms on developed economies. The recovery in 2019 is likely to have been
driven by the winding down of such effects.5

4
 It is worth recalling that net flows correspond to the difference between (net) acquisition of assets, often referred
to as gross asset flows, and (net) incurrence of liabilities, often referred to as gross liability flows. A positive net
flow (i.e. when the flow of acquisition of foreign assets exceeds the flow of incurrence of liabilities to non-
residents), thus translates into net outflows of capital. Equivalently, a negative net flow means an inflow of
investment. See Claeys et al. (2019) p. 28.
5
 See UNCTAD (2019) https://unctad.org/en/pages/newsdetails.aspx?OriginalVersionID=2118

 20
Analysis of Developments in EU Capital Flows in the Global Context

Figure 6. Global FDI inflows, 1990-2019 (Indexed, 2010 = 100), average growth rates
over the sub-period
180
 1990-2000: 22.6% 2000-2007: 2008-2019: -0.3%
 12.2%

120

 60

 0

Source: CEPS (2020) based on UNCTAD data.

More generally, the mild nature of the recovery of 2019 and the ups and downs of the past
decade seem to point to a lower growth rate in the underlying trend than in previous
decades. Reduced growth rates and increased volatility are likely to have been the result
of the geopolitical risk, trade tensions and more protectionist policies that have been
dominating the global stage and made the context less favourable for cross-border
investment.
The recovery that marked 2019 is not expected to continue. The Covid-19 pandemic has
already showed its impact on investment. According to the OECD, in 2020, FDI will fall by
more than 30%.6 UNCTAD estimates an even larger fall, of 40%. If these estimates are
correct, FDI would fall from about $1.6 trillion (net inflows) in 2019, to below $1 trillion
(close to the level of 2004).7 According to UNCTAD the fall would continue in 2021 with no
recovery until the following year. In practice, the actual flows will depend very much on
the evolution of the health crisis and the policies in place to limit contagion. The
reinstatement of lockdown measures in late 2020 is likely to slow economic activity again and
many multinational companies may reassess new projects.
When looking at the regional composition of net FDI flows (see Figure 7), while some countries
such as China, Latin America, financial centres, and deficit countries (both advanced and
emerging) are systematically net receivers of FDI, others such as Japan and, until 2018, the
euro area, are net senders. By contrast, the US and the UK seem to alternate positive and
negative net positions. For the US, 2015 was the year of the change into negative net. For the
euro area the change from net sender to net receiver was 2019. Given that this is the first time
in 15 years, it is worth monitoring whether this is occasional or the sign of a more persistent
change.

6
 https://read.oecd-ilibrary.org/view/?ref=132_132646-g8as4msdp9&title=Foreign-direct-investment-flows-in-
the-time-of-COVID-19
7
 https://data.worldbank.org/indicator/BX.KLT.DINV.CD.WD

 21
Analysis of Developments in EU Capital Flows in the Global Context

Figure 7. Net Foreign Direct Investment Flows, % of World GDP - 2005-2020Q2
 1.5
 United States

 United Kingdom
 1
 Surplus_Asia

 0.5 Oil_Exporters

 NonEuroNord

 0 NonEuroCCE

 Latin_America

 -0.5
 Japan

 Financial_Centre
 -1
 Euro_Area

 Deficit_Emerging
 -1.5
 2017
 2005

 2006

 2007

 2008

 2009

 2010

 2011

 2012

 2013

 2014

 2015

 2016

 2018

 2019

 2019-Q1

 2019-Q2

 2019-Q3

 2019-Q4

 2020-Q1

 2020-Q2
 Deficit_Advanced

 China

Source: IMF, International Financial Statistics (IFS) and World Economic Outlook (WEO), October 2020.

The preliminary data for 2020 seem to confirm that the euro area will continue to be a net receiver. It
should be recalled, however, that the EU is the main FDI partner of the US. The negative spike in US
FDI inflows in 2018 and its continuation in 2019 are related to repatriation of previous earnings from
US multinationals after the enactment of the Tax Cuts and Jobs Act of 2017.8 The US policy change
is likely to have driven adjustments in EU flows (see section 6). Over the past year and half, quarterly
data for the euro area exhibit a change of sign from one quarter to another, suggesting very volatile
flows. Lastly, the data for the second quarter of 2020 show a very large inflow (worth about 0.75%
of world GDP) into the euro area. While this may be driven by the pandemic and some flight to safety,
pre-existing volatility makes this hypothesis weak at this stage.

Interestingly, when considering the gross flows, both assets and liabilities (see Figure 8 and Figure
9) point to a substantial fall, in 2018 and 2019 and potentially also in 2020, which is not visible in
the net FDI flows.

As argued in Claeys (2019), and in line with the above, the decrease in gross FDI asset flows in 2018
was mainly driven by the US and the euro area, which both exhibited a decrease in the FDI asset
flows for the first time since 2005. The large decrease in the euro area asset and liability gross flows
of 2018 disappeared in 2019. In 2019, assets became positive again for both the US and the euro
area but remained smaller relative to the past. In the first two quarters of 2020, the same situation
seems to continue. Both in 2018 and 2019, Japan was the main source of global FDI.

As it will be argued in more detail in section 6, gross flow statistics also include flows that
intermediate investment from the country of the ultimate investor to the final destination.
This may lead to double counting and an overestimation of gross flows.
The collapse in FDI flows in 2018, and to some extent in 2019, captured in the statistics,
is very likely to be associated with the activity of SPEs, which are used as a conduit in the
EU and in other countries. They are likely to have played a role in the repatriation of profits
following the Tax Cuts and Jobs Act.

8
 See Claeys at al. (2019) for the significance of the US Tax Cuts and Jobs Act its effect on global capital flows.

 22
You can also read


