ECONOMY OF ICELAND Contents - Central Bank of Iceland
←
→
Page content transcription
If your browser does not render page correctly, please read the page content below
E CO N O M Y
    OF ICELAND
         Contents
     5 Introduction

     7 1 Country and people
   13 2 Structure of the economy

 Boxes:

 The individual transferable quota system 20

 Sectoral limitations on foreign direct investment 21

   29 3 Financial system
   39 4 Public sector

 Box:

 The tax system 44

 Iceland's fiscal framework 49

   53 5 Monetary and financial stability policies
		 Box:
		 New policy instrument to temper and affect the composition
		 of capital inflows 57

   59 6 External position
   67 7 Government, corporate, and household
      balance sheets
   75 8 Capital account liberalisation

 Box:

 Stability conditions and stability contributions 81

   83 Appendix
Published by:
The Central Bank of Iceland, Kalkofnsvegur 1,
150 Reykjavík, Iceland
Tel: (+354) 569 9600, fax: (+354) 569 9605
E-mail: sedlabanki@sedlabanki.is
Website: www.sedlabanki.is
Editorial Board and staff:
Rannveig Sigurdardóttir, chairman
Hördur Gardarsson
Elís Pétursson
Gerdur Ísberg
Jónas Thórdarson
Ragnheidur Jónsdóttir
October 2016
Printing: ODDI ehf.
Economy of Iceland is also published on the Central Bank of Iceland website.
ISSN 1024-6680
Material may be reproduced from Economy of Iceland, but an acknowledgement of source
is kindly requested.
In Economy of Iceland, monetary figures are generally presented in euros; however, in certain
instances, amounts are expressed in US dollars. The amount in Icelandic krónur is included in pa-
rentheses, as most figures are originally in krónur. Stocks at the end of the period are calculated
using the period-end exchange rate, whereas flows are calculated using the average exchange
rate for the period.
Icelandic letters:
ð/Ð (pronounced like th in English this)
þ/Þ (pronounced like th in English think)
Symbols:
* Preliminary or estimated data.
0 Less than half of the unit used.
- Nil.
… Not available.
. Not applicable.Republic of Iceland
People
Population 332,529 (1 January 2016)
Capital Reykjavík; population 122,460 (1 January 2016)
Language Icelandic; belongs to the Nordic group of Germanic languages
Main religion Evangelical Lutheran (71.6%)
Life expectancy Females: 84 years; Males: 81 years
Governmental system
Government Constitutional republic
Suffrage Universal, over 18 years of age; proportional representation
Legislature Parliament (Althingi) with 63 members
Election term Four years; last election 27 April 2013
Economy
Monetary unit Króna (plural: krónur); currency code: ISK
Gross domestic product 12 billion euros (2,205.479 billion krónur, 13.55 billion US
dollars) in 2015
International trade Exports of goods and services 53% and imports of goods and
services 46% of GDP in 2015
Per capita GDP 33.66 thousand euros in 2015 (6.7 million krónur, 46 thousand
US dollars in terms of PPP)
Land
Geographic size 103,000 sq.km. (39,769 sq.mi.)
Highest point 2,110 m. (6,923 ft.)
Exclusive economic zone 200 nautical miles (758,000 sq.km. / 292,665 sq.mi.)
Climate Cool temperate oceanic; highly changeable, influenced by the
warm Gulf Stream and Arctic currents
Republic of Iceland credit ratings
Foreign currency Local currency
Affirmed Long-term Short-term Long-term Short-term Outlook
Moody's September 2016 A-3 … A-3 … Stable
Standard & Poor's July 2016 BBB+ A-2 BBB+ A-2 Stable
Fitch July 2016 BBB+ F2 BBB+ F2 StableCentral Bank of Iceland publications in English
Annual Report
Monetary Bulletin
Financial Stability
Economy of Iceland
Economic Affairs
Informational Reports
Special Publications
Central Bank of Iceland Working Papers
These publications are available on the Central Bank website. Also available on the website are
regularly updated Central Bank statistics and Economic Indicators, a snapshot of the Icelandic
economy in charts and tables.
Useful websites
Central Bank of Iceland www.sedlabanki.is
Parliament of Iceland (Althingi) www.althingi.is
Government of Iceland www.government.is
Statistics Iceland www.statice.is
OMX Nordic Exchange in Iceland www.nasdaqomx.com
Government Debt Management www.bonds.is
Trade Council of Iceland www.icetrade.is
National Association of Pension Funds www.ll.is
Invest in Iceland Agency www.invest.is
Financial Supervisory Authority www.fme.is
The Official Gateway to Iceland www.iceland.is
Tokyo
8900 km
Copenhagen
2122 km
New York
4208 km London
1884 kmIntroduction
Economy of Iceland has been published by the Central Bank of Iceland since 1987. It is mainly
intended for an international readership. This includes international institutions that deal with
Icelandic economic matters on a regular basis, rating agencies, financial institutions, foreign in-
vestors, embassies and, more generally, everyone who is interested in the Icelandic economy.
We also hope that Icelandic readers will find this survey useful. It is published every other year.
This publication focuses on the structure of the Icelandic economy. It is intended to serve as
background material for understanding the evolution of the economy, but it does not provide a
detailed account of recent developments. A more up-to-date analysis of recent developments
and prospects is provided in the Central Bank’s Monetary Bulletin and Financial Stability reports.
The Bank‘s Annual Report describes the Central Bank of Iceland‘s general activities during the
year.
The outline of this booklet is as follows: Chapter 1 presents basic facts about Icelandic geog-
raphy, population, and society. Chapter 2 deals with the structure of the economy. It discusses
size and income levels, the composition of GDP, foreign trade, main economic sectors, the labour
market, and the Icelandic pension system. Chapter 3 provides an account of the financial system
and discusses the various challenges during the recovery following the financial crisis. Chapter
4 surveys the public sector, including division of tasks, central and local government finances,
expenditure structure, and the tax system. Chapter 5 describes the frameworks for monetary
policy and financial stability. It explains the objectives and main instruments of monetary policy,
and the role of the Monetary Policy Committee. It also elaborates on financial stability policy and
the Central Bank’s role in promoting an efficient and safe financial system. Chapter 6 presents
Iceland’s external debt position. It elaborates on the accumulation of debt in the years preced-
ing the financial crisis and developments in its aftermath. It discusses changes in foreign direct
investment and provides estimates of net foreign debt levels after the winding-up of the failed
banks' estates. Chapter 7 describes government, corporate, and household balance sheets. It
discusses the position of the Government, households, and businesses, and examines debt re-
structuring following the financial crisis. Chapter 8 discusses Iceland’s capital controls, why they
were introduced, the steps taken thus far in lifting them, and the potential risks accompanying
their liberalisation. A number of tables are provided in an appendix.
We are constantly making efforts to improve this publication. Hence we would be grateful
for any comments and suggestions that might increase the usefulness of this booklet. If you
feel that important information is missing and should be added, or if you see other scope for
improvement, please e-mail your suggestions to: sedlabanki@sedlabanki.is.1 Country and people
This chapter gives an overview of the country of Iceland – its geography and the main
characteristics of its people, society, and political and institutional structure – and of Iceland
as a welfare state. It also reviews Iceland‘s external relations and its status in a global context.
Geography
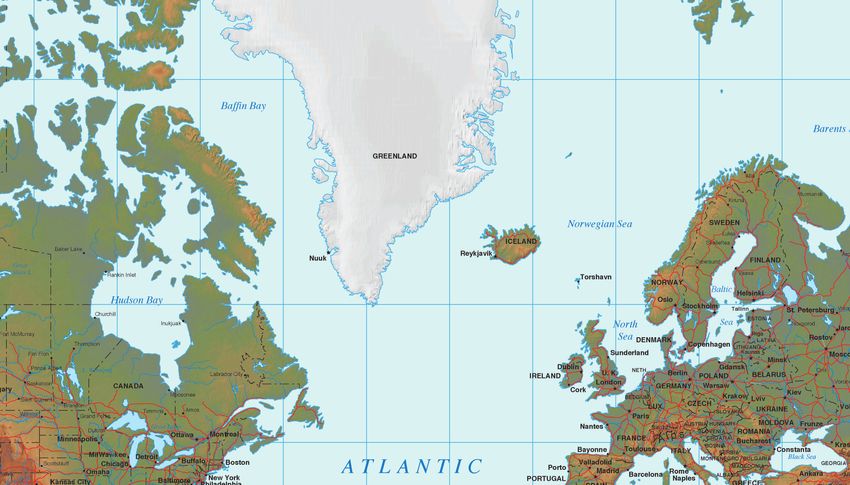
Iceland is an island located in the North Atlantic, between Norway, Scotland, and Greenland. It is
the second-largest island in Europe and the third-largest in the Atlantic Ocean, with a land area
of some 103 thousand square kilometres, a coastline of 6,088 kilometres and a 200-nautical-mile
exclusive economic zone (EEZ) extending over 758 thousand square kilometres in the surround-
ing waters.
Iceland enjoys a warmer climate than its northerly location would indicate because a part
of the Gulf Stream flows around the southern and western coasts of the country. In the capital,
Reykjavík, the average temperature is nearly 13°C in July and just above 0°C in January.
Iceland is mostly mountainous and of volcanic origin, with the highest peak reaching 2,110
metres. Lowlands stretch from the coast towards the interior, mainly in the south and the west.
Several glaciers, one of them the largest in Europe, distinguish the landscape. The coasts are
Chart 1.2
Chart 1.1 Population of Iceland1
Geography of Iceland 1
In thousands of inhabitants Year-on-year change (%)
400 3.0
23%
350 2.5
300 2.0
63%
250 1.5
3%
200 1.0
12% 150 0.5
100 0.0
50 -0.5
Vegetation (23,805 sq. km)
Wasteland (64,538 sq. km) 0 -1.0
Lakes (2,757 sq. km) ‘75 ‘80 ‘85 ‘90 ‘95 ‘00 ‘05 ‘10 ‘15
Glaciers (11,922 sq. km)
Population (left)
Population increase, % (right)
1. The size of Iceland is roughly 103,000 square kilometres.
Sources: Icelandic Geodetic Survey, National Energy Authority,
Science Institute, University of Iceland. 1. Population 1 January each year.
Source: Statistics Iceland.
Country and people 7ECONOMY OF ICELAND
rocky and of irregular outline, with numerous fjords and inlets, except for the south, where there
are sandy beaches with no natural harbours. Only around 23% of the total land area is classi-
fied as vegetated land, most of it located in the southern and western part of the country and in
several fertile valleys stretching from the coast.
Iceland is endowed with abundant natural resources. These include the fishing grounds
around the island, within and outside the country’s 200-mile EEZ. Furthermore, Iceland has
abundant hydroelectric and geothermal energy resources.
People
Iceland was settled in the ninth century A.D. The majority of the settlers were of Norse origin,
with a smaller Celtic element. A general legislative and judicial assembly, the Althingi, was es-
tablished in 930, and a uniform code of laws for the country was established at the same time.
In 1262, Iceland entered into a union with the Norwegian monarchy. When the Kalmar Union
was dissolved in 1523, Iceland came under Danish rule, which lasted for more than five hundred
years. Iceland was granted a new constitution in 1874 and obtained home rule in 1904. With the
Act of Union in 1918, Iceland became a sovereign state in a monarchical union with Denmark. In
1944, Iceland terminated this union with Denmark and founded a republic. The native language,
Icelandic, belongs to the Nordic group of the Germanic languages.
With only 3 inhabitants per square kilometre, Iceland is one of the least densely populated
countries in Europe. On 1 January 2016, Iceland’s population was almost 333 thousand. In
2000–2015, annual average population growth was 1.1% and the natural increase (births less
Chart 1.3
Chart 1.4
Age structure of the population in
Life expectancy at birth 20141
selected countries 20141
% Age in years
100 Japan
Spain
France
90 Italy
Korea
Switzerland
Luxembourg
80 Iceland
Portugal
Australia
70 Sweden
Norway
Slovenia
Israel
60 Greece
Finland
Austria
50 Belgium
Germany
Canada²
Netherlands
40 Ireland
New Zealand
United Kingdom
30 Denmark
Czech Republic
Estonia
Poland
20 Chile
United States
Turkey
10 Slovak Republic
Latvia
Hungary
Mexico
0
New Zealand
Sweden2
UK
Germany
Iceland3
US
Italy
France2
Japan2
60 65 70 75 80 85 90
Females
Males
Over 65 years
15-64 years 1. 2014 figures or OECD estimate. 2. Data are for 2012.
Under 15 years Source: OECD.
1. Ranked by share of population 65 and over. 2. Data for France, Sweden,
and Japan are for 2013. 3. Data for Iceland are for 2015.
Sources: OECD, Statistics Iceland.
8 Country and peopleECONOMY OF ICELAND
deaths) 0.8%. Around 63% of the population (almost 210 thousand) live in the capital city of
Reykjavík and its surrounding municipalities. The largest town outside the capital area is Akurey-
ri, located in North Iceland, with a population of just over 18 thousand. Most of the remaining
inhabitants live in small towns along the coast.
As in other advanced countries, the population of Iceland is ageing, but at a relatively slower
pace than in most OECD countries. In 2014, despite high life expectancy, the ratio of the total
population aged over 65 to the population of working age was 22%, eighth-lowest in the OECD.
Society and the welfare state
Iceland is a modern welfare state that guarantees its citizens access to universal health care,
education, and a high degree of social security. Spending on health, education, social security,
welfare, and other social affairs amounted to 25.7% of GDP in 2014.
Life expectancy, which is among the highest in the world, and one of the world’s lowest
infant mortality rates (2.1 per 1,000 live births in 2015) testify to the advanced state of health
care in Iceland, both primary health care and hospitals. The Icelandic health care system is a tax-
financed universal system for all persons who have had legal residence in Iceland for more than
six months. Health care services are provided mainly free of charge, although user charges have
been on the rise. The main exception is dental health care, where adult patients are charged the
full cost of service, while children under 18 years of age have most of the cost refunded.
Chart 1.5 Chart 1.6
General government expenditure by Material deprivation and risk of poverty in
function in 20141 Europe 20151
% % of total population
100 Sweden
Norway
Switzerland
90 Luxembourg
Iceland
Finland
80 Netherlands
Denmark
Austria
Germany
70 Belgium
France
UK
60 Slovenia
Estoina
Euro area
50 Spain
Czech Republic
EU
Malta
40 Portugal
Slovakia
Poland
30 Ireland
Italy
Lithuania
20 Latvia
Croatia
Hungary
Cyprus
10 Romania
Greece
Bulgaria
0
50 40 30 20 10 0 0 10 20 30
Iceland
Japan
Germany
Italy
Sweden
France
UK
US
Denmark
Ireland
Norway
Material deprivation
General public service Housing and community amenities At risk of poverty
Defence Health
1. 2015 or latest.
Public order and safety Recreation, culture and religion
Source: Eurostat.
Economic affairs Education
Environmental protection Social protection
1. Percentage breakdown of total expenditure.
Source: OECD.
Country and people 9ECONOMY OF ICELAND
The standard of education is high, and public education is compulsory between the ages of 6
and 16. Good command of English and the Scandinavian languages is widespread. Education is
offered free of charge or for a nominal fee at three levels. First, there are ten years of compulsory
education at the primary level (age 6-16). This is followed by three years at the upper secondary
level, which provides general education and vocational training in a wide range of fields. Finally,
higher education is offered at several universities.
In Iceland, as in most OECD countries, university enrolment of those completing secondary
education has increased substantially in recent years. In 2015, 39% of the adult population held
a university degree, up from 29% in 2005. The ratio of pre-school enrolment is also one of the
highest among OECD countries.
Institutional framework: the political, judicial, monetary, and financial supervisory structure
Iceland is a constitutional republic with a multi-party parliamentary system of government. The
Constitution was adopted on 17 June 1944, when the Republic was established. Legislative
power is vested in Parliament (Althingi) and the president, in that bills of legislation are passed
by Parliament and submitted to the president for confirmation by his or her signature. Upon
such confirmation, the bill in question acquires the force of law. The Government must be sup-
ported by a majority of Parliament in order to remain in power. The 63 members of Parliament
are elected from six constituencies on the basis of proportional representation, for a term of four
years. Over the past thirty years, the participation of women in politics has increased significantly
and their share of seats in Parliament has increased from 15% to roughly 40%. The president is
the head of state and is elected for a term of four years by a direct vote of the electorate.
Since Iceland gained autonomy from Denmark in 1918, its governments have normally been
formed by a coalition of two or more political parties that have together held a majority in Parlia-
ment. The most recent election was held on 27 April 2013. The results of the elections were as
follows: the Independence Party obtained 26.7% of votes and 19 seats, the Progressive Party
24.4% and 19 seats, the Social Democratic Alliance 12.7% and 9 seats, the Left Green Party
10.9% and 7 seats, and two new parties, Bright Future and the Pirate Party, obtained 6 seats and
3 seats, respectively, with 8.3% and with 5.1% of the vote. Others received a total of 8.7% of
the vote but no seats, as none of them received votes above the required minimum. A coalition
government of the Independence Party and the Progressive Party (with a total of 38 seats) took
office in May 2013. General elections are generally held every four years, but the Constitution
allows for early dissolution of Parliament, which triggers early elections. There will be elections
on 29 October 2016.
Iceland’s court system is divided into two levels: district courts, which are the courts of first
instance, and the Supreme Court, which holds the highest judicial power in Iceland.1 The Con-
stitution provides for the courts’ independence, according to which judges have judicial power,
shall only abide by the law in their official duties, and cannot be discharged from office except
by judicial decision.
1. Significant amendments were made to the Act on the Judiciary in spring 2016. Most significant is the establishment of
a new Court of Appeals, which will take effect on 1 January 2018. From then on, Iceland’s court system will be divided
into three levels: district courts (currently eight in number), the Court of Appeals, and the Supreme Court.
10 Country and peopleECONOMY OF ICELAND
The Central Bank of Iceland was established by an Act of Parliament in April 1961. The
Bank is an independent institution owned by the State but under separate administration. An
inflation-targeting regime was adopted in 2001, with the inflation target determined jointly by
the Minister and the Bank. Decisions on the use of monetary policy instruments are taken by a
five-member Monetary Policy Committee (see Chapter 5). The Ministry of Finance and Econom-
ic Affairs oversees matters pertaining to the Central Bank, insofar as they belong to the political
sphere. The Bank is supervised by a seven-member Supervisory Board elected by Parliament.
The Financial Supervisory Authority (FME) is charged with the task of supervising financial
enterprises. Its mission is to safeguard the integrity and sound operation of the financial system.
The Act on Official Supervision of Financial Activities states that the FME is an independent insti-
tution with its administration entrusted to a board of directors. The FME falls under the auspices
of the Ministry of Finance and Economic Affairs, but according to the Act, the Minister does not
have the power to affect decision-making within the institution. Since May 2014, a Financial
Stability Council and Systemic Risk Committee have served as the authorities’ official forum for
collaboration on financial stability (see Chapter 5).
External relations
Iceland participates actively in international cooperation. It belongs to the group of Nordic coun-
tries that includes Denmark, Finland, Norway, and Sweden, as well as Greenland and the Faeroe
Islands. The Nordic countries have established wide-ranging cooperation in a variety of fields,
including economic affairs and international representation, in which the Baltic countries also
play an active part. Iceland is a member of the Nordic Council, the Nordic Council of Ministers,
and specialised institutions such as the Nordic Investment Bank. Iceland is also a member of the
Arctic Council and a number of other regional bodies.
Iceland became a member of the United Nations in 1946 and is an active participant in most
of its affiliated agencies. It is a founding member of the Bretton Woods institutions established in
1945, the International Monetary Fund (IMF), and the International Bank for Reconstruction and
Development (World Bank). Iceland is a founding member of the Asian Infrastructure Investment
Bank and ratified its Articles of Agreement in 2016. The Central Bank of Iceland is a shareholder
in the Bank for International Settlements (BIS) and participates actively in its activities.
Iceland is one of the original members of the Organisation for Economic Cooperation and
Development (OECD) and of the European Bank for Reconstruction and Development (EBRD).
It joined the Council of Europe in 1950 and has participated in the Organisation for Security and
Cooperation in Europe (OSCE) since the organisation’s inception in 1975.
In 1964, Iceland became a party to the General Agreement on Tariffs and Trade (GATT), the
predecessor to the World Trade Organization (WTO). Iceland joined the European Free Trade
Association (EFTA) in 1970 and entered into a free trade agreement with the European Economic
Community in 1972. In May 1992, the member states of EFTA and the European Union signed an
agreement to establish a zone for the free movement of goods, services, capital, and persons, the
European Economic Area (EEA), which took effect on 1 January 1994. Through this agreement,
Iceland is a part of the single market of the European Union. Iceland is a party to numerous free
trade agreements (FTA) with other countries through its EFTA membership. Furthermore, Iceland
has negotiated bilateral free trade agreements with China, Greenland, and the Faeroe Islands.
Country and people 11ECONOMY OF ICELAND
Iceland is a founding member of the North Atlantic Treaty Organization (NATO), established
in 1949. The United States maintained a permanent military presence in Iceland from 1951 until
2006. The bilateral defence agreement between Iceland and the United States remains in effect.
Table 1.1 Iceland’s membership of international organisations and institutions
Year of
association
International Monetary Fund (IMF) 1945
International Bank for Reconstruction and Development (World Bank) 1945
United Nations (UN) 1946
North Atlantic Treaty Organization (NATO) 1949
Organisation for Economic Cooperation and Development (OECD) 1949
Bank for International Settlements (BIS) 1950
Council of Europe 1950
Nordic Council 1952
International Finance Corporation (IFC) 1956
International Development Association (IDA) 1961
General Agreement on Tariffs and Trade (GATT) 1964
European Free Trade Association (EFTA) 1970
Nordic Investment Bank 1975
Organization for Security and Cooperation in Europe (OSCE) 1975
European Bank for Reconstruction and Development (EBRD) 1990
Western European Union (WEU) 1992
Barents Euro-Arctic Council (BEAC) 1993
European Economic Area (EEA) 1994
Council of Baltic Sea States (CBSS) 1995
World Trade Organization (WTO) 1995
Arctic Council 1996
Asian Infrastructure Investment Bank (AIIB) 2015
12 Country and people2 Structure of the economy
This chapter focuses on the structure of the Icelandic economy, mainly with regard to size,
composition of output and expenditure, and foreign investment. Different sectors of the
economy are analysed, particularly to include recent developments and the contribution of
each sector to GDP. Finally, the labour market and pension system in Iceland are discussed.
The Icelandic economy displays the characteristics of an advanced economy, with high income
levels and a relatively large services sector. Its distinguishing features are its large marine and
energy sectors based on ample resources, a growing tourism sector, and a high labour partici-
pation rate.
Size and income level
The Icelandic economy is the smallest within the OECD, generating GDP of 16.7 billion US dol-
lars (2,205 b.kr) in 2015. This amounted to around 1/1000 of the US economy, 1/17 of the Danish
economy, and a little over ¼ of the economy of Luxembourg, while it is more than 70% larger
than the economy of Malta. The small size of the Icelandic economy mainly reflects the country’s
small population, which was 332.5 thousand on 1 January 2016. According to World Bank data,
Chart 2.2
Chart 2.1 Individual sectors' share in economic
Gross national income per capita in contraction and recovery1
OECD countries1
%
Luxembourg 15
Norway
Switzerland
United States
Netherlands
Germany
Denmark 10
Austria
Sweden
Ireland
Iceland
Australia
Belgium
Canada 5
Finland
United Kingdom
France
Japan
Italy
New Zealand
Israel 0
South Korea
Spain
Slovenia
Czech Republic
Portugal
Slovakia
Estonia -5
Greece
Poland
Hungary
Chile
Turkey
Mexico
-10
0 10 20 30 40 50 60 70 80 Manu- Con- Financial Other GDP
facturing struction services private svc.
USD thousands
(17%)² (6%)³ (7%)4 (40%)5
2015
2010 Change from GDP trough in 2010 until 2015
2005 Change from pre-crisis peak to post-crisis trough
1. Based on PPP. 1. Each sector's contraction and recovery, weighted with its share in
gross factor income during the relevant period (2015 share in parent-
Source: Macrobond. heses). 2. Manufacturing, mining, utilities, and waste handling. 3. Building
and construction. 4. Financial and insurance activities. 5. Wholesale,
retail, transportation and storage, hotels and restaurants, IT and
communications, real estate, and miscellaneous specialised services.
Source: Statistics Iceland.
Structure of the economy 13ECONOMY OF ICELAND
GNI per capita measured in terms of purchasing power parities (PPP) amounted to more than
46 thousand US dollars in 2015, the seventeenth-highest in the world and the eleventh-highest
among the OECD countries. Iceland’s GNI per capita is lower than that in Denmark, Norway, and
Sweden but higher than in Finland and above the EU average.
Drivers of growth
Historically, Iceland’s prosperity has been built largely on its comparative advantages in abundant
marine and energy resources, with investment and services the main drivers of growth. In the
few years prior to the financial crisis of 2008, the financial services and construction sectors were
the main drivers of economic growth, and conversely, the contraction following the financial cri-
sis was most pronounced within those sectors. After GDP growth resumed in 2010, however, the
contribution from the services sector has been driven by the recovery of domestic demand and
growth in tourism-related services, supported by a competitive real exchange rate, particularly in
the early phase of the recovery (Chart 2.2). This is also reflected in national accounts expenditure
figures, which show that services exports along with private consumption and business invest-
ment have contributed the lion’s share of GDP growth during the recovery period.
Composition of output and expenditure
As in other developed economies, services form the bulk of economic activity, accounting for
more than 70% of GDP in 2015. The marine sector accounted for 8.3% of GDP in 2015 and re-
mains one of the most important sources of export revenues, although its relative weight in total
export revenues has declined in recent years, as energy-intensive exports and tourism-related
services have increased more rapidly. Manufacturing (excluding marine products) accounted for
Chart 2.4
Exports of goods and services
Chart 2.3 At constant average exchange rates, based
Breakdown of GDP by sector 2015 on a trade-weighted basket of currencies
1.2% B.kr.
8.3% 800
9.7% 700
30.2%
600
5.5%
500
5.9%
400
300
12.9%
15.6% 200
10.8%
100
Financial, insurance, real estate, etc. Electricity and water supply 0
‘80 ‘85 ‘90 ‘95 ‘00 ‘05 ‘10 ‘15
Transport and communications Industry
Commerce Fishing and fish processing
Marine exports Other goods exports
Construction Agriculture
Metals Tourism
Other services
Other manufactured goods Other services exports
Source: Statistics Iceland. Source: Statistics Iceland.
14 Structure of the economyECONOMY OF ICELAND
roughly 12% of GDP in 2015, and construction accounted for nearly 6%. Financial services
(other than insurance services and pension funds) accounted for an average of 6% of GDP in
2013-2015, considerably below the pre-crisis average of roughly 9%. From 2010, the beginning
of the post-crisis economic recovery, until 2016, GDP grew by 14.2%, more than 2/3 of it due
to growth in the services sector and another 2½ percentage points due to the recovery of the
construction sector.
Private consumption contributed, on average, about 52% of GDP in 2010-2015, and public
consumption and gross fixed capital formation contributed 24% and 16%, respectively. After
the crisis struck in 2008, the investment-to-GDP ratio fell well below the long-term average of
21% of GDP, but it has been rising in recent years and was just over 19% in 2015. The ratio
of public consumption to GDP declined at the height of the pre-crisis boom, as private sector
activity outpaced public sector activity. It rose just after the crisis, however, as the private sector
contracted more than the public sector. Since 2011, the public consumption ratio has been on a
declining path, as the economic recovery has been driven by exports and domestic private sector
demand and growth in public final expenditure has been weak.
Foreign trade
Iceland is a fairly open economy, with imports and exports of goods and services amounting to
46% and 53% of GDP, respectively, in 2015. In the period 2000–2015, trade openness, meas-
ured as the ratio of imports and exports of goods and services to GDP, averaged 86%, well above
the OECD average. Although trade still involves a relatively large share of primary products and
commodities, exports have diversified significantly since the beginning of the century. Certain
factors restrict openness, however, such as geographic distance from major population centres,
limited intra-industry and transit trade, and protection of domestic agriculture.
Chart 2.5 Chart 2.6
Exports by type of goods 2015 Imports by type of goods 2015
Percentage of total exports Percentage of total imports
6%
13% 17%
22%
18%
18%
1%
13%
8%
6%
22%
17% 13%
8%
1% 6% 10%
Marine products Other products Industrial products Other consumer goods
Agricultural products Transportation Food and beverages Transportation
Aluminium and ferrosilicon Travel Fuel Travel
Other manufactured goods Other services sectors Capital goods Other services sectors
Transport equipment
Source: Statistics Iceland.
Source: Statistics Iceland.
Structure of the economy 15ECONOMY OF ICELAND
Chart 2.8
Chart 2.7 Composition of goods exports by product
Currency area share in services exports 2015 categories
18% % of total
70
14% 11%
25% 60
50
11%
40
30
7%
20
6%
16% 5%
10
Euro area Saudi Arabia 0
US 2000 2005 2010 2015
Norway
Denmark Sweden
UK Marine products Other industr. products1
Other
Energy-intensive products Other
Source: Statistics Iceland.
1. Manufacturing services are included under energy-intensive
industrial goods as in Statistics Iceland's trade figures.
Source: Statistics Iceland.
Fish and other marine products have traditionally been the mainstay of goods exports, al-
though they have been declining as a share of total exports since the early 1990s. In 2015, fish
and other marine products accounted for 42% of goods exports and 22% of total exports, down
from 63% and 41%, respectively, in 2000. Exports of manufactured goods have been growing
rapidly in importance, led by aluminium smelting and medical and pharmaceutical products, and
accounted for 53% of goods exports in 2015 (up from 31% in 2000) and 28% of total exports.
Exports of services have also increased as the economy has grown and become increasingly
service-oriented. Tourism has soared over the past few years and has been one of the main driv-
ers of export growth, contributing over 50% of the growth during the post-crisis period. Services
now account for 47% of total export revenues, up from 37% in 2000.
Iceland imports a wide range of manufactured goods and commodities, reflecting both the
small size of the economy and the limited range of natural resources. Imports of industrial sup-
plies accounted for 28% of total goods imports and 18% of total imports in 2015. Capital goods
constituted almost 21% of total goods imports and consumer goods 27% (13% and 17%,
respectively, of total imports in 2015), while services contributed around 36% of total imports.
Iceland’s ratio of services trade to total trade has risen in recent years. In 2015 it was 43%,
one of the highest in the OECD, up from 34% at the beginning of the century. The euro is the
most common currency used for services exports in Iceland, with 25% of total services exports.
Besides the euro, only three currencies have a share of 10% or larger: the US dollar (18%) and
the Danish krone and pound sterling, each with 11%.
Free trade arrangements with Europe have stimulated Iceland’s trade with the region, causing
the share of North America to fall. In 2015, 78% of goods exports went to European Economic
Area (EEA) member countries, which were also the source of 61% of imports. Currently, Iceland’s
16 Structure of the economyECONOMY OF ICELAND
Chart 2.9
Composition of manufacturing exports Chart 2.10
and share in total goods exports Aluminium production
% % Thousands of tonnes Thousands of tonnes
100 60 90 900
80 800
80 50 70 700
60 600
60 40
50 500
40 400
40 30
30 300
20 200
20 20
10 100
0 10 0 0
‘90 ‘92 ‘94 ‘96 ‘98 ‘00 ‘02 ‘04 ‘06 ‘08 ‘10 ‘12 ‘14 ‘02 ‘03 ‘04 ‘05 ‘06 ‘07 ‘08 ‘09 ‘10 ‘11 ‘12 ‘13 ‘14 ‘15
Aluminium (left) Other1 (left) Annual production (right)
Ferrosilicon (left) Share in total goods Monthly production (left)
Medical and pharmaceutical exports (right)
products (left) Source: Statistics Iceland.
1. Medicinal and pharmaceutical products are included until 2002.
Source: Statistics Iceland.
largest trading partner countries are the Netherlands, the UK, Germany, Norway, the US, and
Spain. Trade with China has increased dramatically over the past few years, and China is now
Iceland’s ninth-largest trading partner. In terms of currency, the euro area constitutes the largest
trading area, accounting for 36% of imports and 27% of exports. In recent years, Iceland has
generally had a trade surplus with the Netherlands, the UK, Russia, Nigeria, France, Japan, and
the Iberian countries, but a deficit with Brazil, China, the US, and its Nordic neighbours.
Manufacturing and energy-intensive industries
The production structure of Iceland’s manufacturing sector is unique among industrialised coun-
tries in many respects. First, the manufacturing sector is dominated by two sub-sectors, food
processing and aluminium production, which together account for roughly ¾ of total manufac-
turing. Second, production of machinery and other investment goods is relatively limited. Food
production is directed partly at the domestic market, but a larger share, or 62% (in 2015), focus-
es on seafood production for export. Other less important sub-sectors are machinery equipment
production (12%), building materials production (3%), and pharmaceuticals/chemical products
(3%).
Iceland’s largest manufacturing industry by far is the energy-intensive industry (mainly alu-
minium), which has increased substantially over the past decade, generating 38% of goods ex-
ports in 2015, up from one-fifth in 2000. Iceland’s aluminium industry is based primarily on com-
petitive energy costs, strategic location, and a skilled labour force. Production has risen sharply
since the turn of the century, from 210 thousand metric tonnes per year (mtpy) in 2000 to an
estimated 880 thousand mtpy in 2016. Iceland’s share of world aluminium production (excluding
China) increased from 1% in 2000 to 3% in 2014.
Structure of the economy 17ECONOMY OF ICELAND
A number of export-oriented manufacturing companies have emerged in the last two dec-
ades. Most of these companies are founded on product innovation, R&D, information and com-
munications technology (ICT), and strategic marketing. Three of these companies have grown
from being small or medium-sized companies to become key international players in their field,
holding a relatively large market share worldwide in medical equipment, pharmaceuticals, and
food processing and fishery equipment.
Energy
Iceland is at the forefront in the use of renewable energy resources. Of the total primary energy
supply in Iceland, nearly 90% is from renewable resources, up from 72% in 2000, compared
to an average of 1/3 in other Nordic countries. Iceland has large potential sources of renewable
energy; on the one hand, the country is located on the volcanically active Mid-Atlantic Ridge, a
potent source of geothermal energy, and on the other hand, one-tenth of the landmass is cov-
ered by glaciers, a major source and reservoir of water power for generating electricity. Iceland’s
hydropower and geothermal resources have only been partly harnessed, and Iceland is the only
country in Europe that still has a considerable amount of large-scale, competitively priced power
from these sources.
Electricity production per capita is the highest in the world, at 55 megawatt hours (MWh) per
capita, more than twice that in Norway (23 MWh), which comes second. In 2015, total installed
hydropower was 1,986 MW in 40 power plants with a combined capacity of 13,800 gigawatt
hours (GWh), or 70% of generated electricity. At year-end 2015, combined installed geo-power
for electricity generation was 665 MW from seven plants and 5,000 GWh capacity.
Chart 2.11
Primary energy consumption by source Chart 2.12
in Iceland Contribution of renewables to energy supply
in OECD countries 2014
In physical units, PJ (petajoules)
180 Iceland
Norway
New Zealand
160 Sweden
Chile
Austria
Finland
140 Denmark
Portugal
Switzerland
Slovenia
120 Canada
Italy
Spain
Estonia
100 Germany
Greece
Poland
Turkey
80 OECD
Mexico
Slovak Republic
Czech Republic
60 Hungary
France
Ireland
Belgium
40 Australia
United States
United Kingdom
Israel
20 Japan
Netherlands
Luxembourg
South Korea
0
‘60 ‘65 ‘70 ‘75 ‘80 ‘85 ‘90 ‘95 ‘00 ‘05 ‘10 ‘15 0 10 20 30 40 50 60 70 80 90
% of total primary energy supply
Geothermal (for indoor heating and electricity generation)
Hydro Oil Coal Source: OECD.
Source: National Energy Authority.
18 Structure of the economyECONOMY OF ICELAND
Iceland has been in the lead globally in the use of geothermal energy for purposes other than
generating electricity. Geothermal energy accounts for 66% of primary energy used in Iceland,
most of it as geothermal heat for space heating (70%) and the rest for swimming pools, green-
houses, aquaculture, and other industrial use. The total primary energy supply per unit of GDP is
the highest in the world, nearly four times higher than the OECD average. Well over 90% of all
homes are heated by geothermal energy in the form of hot water at only a fraction of the heating
cost in other Nordic countries. For the general public, the price of electricity is one of the lowest
in the world, about half of the price to consumers in the European Union (EU27).
Marine sector
Throughout most of the 20th century, the marine sector was of key importance to the Icelandic
economy. To a large extent, economic growth was generated by the marine sector. Fisheries and
fish processing are still one of the main pillars of export activities in Iceland: in 2015, 42% of
goods exports and roughly 22% of all export earnings from goods and services came from fish-
eries. However, as exports of manufactured goods have been growing rapidly, the share of the
marine sector in goods exports has fallen, from around 63% in 2000 to 42% in 2015. Despite
this, the sector’s contribution to GDP has remained relatively constant in the past five years at
8-10%, down from 12% in 2000.
The marine sector is highly diversified in terms of species, processing methods, and markets.
Fishing and processing of groundfish (primarily cod, but also haddock, saithe, and redfish) and
pelagic species (mackerel, herring, and capelin) are the principal focus of Iceland’s marine sector.
The introduction of value-added processing techniques has helped to offset stagnant or allow-
able groundfish catch volumes in recent years. Value has also been boosted by a shift towards
fresh seafood products instead of frozen and salted products, as fresh products yield considerably
Chart 2.13 Chart 2.14
Fish catch by Icelandic vessels Marine exports
Thousands of tonnes % of goods exports %
2,500 70 13
60 12
2,000
50 11
1,500
40 10
30 9
1,000
20 8
500
10 7
0 0 6
‘70 ‘75 ‘80 ‘85 ‘90 ‘95 ‘00 ‘05 ‘10 ‘15 ‘00 ‘02 ‘04 ‘06 ‘08 ‘10 ‘12 ‘14
Total catch Marine product exports (left)
Cod and other demersal fish Marine sector contribution to GDP (right)
Herring, capelin, and other pelagics
Source: Statistics Iceland.
Source: Statistics Iceland.
Structure of the economy 19ECONOMY OF ICELAND
Box 2.1
The individual transferable quota system
Fishing of all commercially important marine species is regulated under the individual transferable
quota (ITQ) system. The current quota system is based on the following factors:
• Each year, the total allowable catch (TAC) is set by the Minister of Fisheries, after the Minister
has received advice from the Marine Research Institute based on a biological assessment of
the stocks and forecasts for their development in the near future.
• The quota shares that determine each year’s quotas must be registered to a fishing vessel.
• A vessel’s annual quota for a species is equal to its quota share for that species multiplied by
the TAC, after adjusting for special allocations; e.g., for regional support and coastal fisheries
of small vessels.
• Quota shares and annual quotas are transferable and can be traded on the quota market,
subject to certain restrictions.
The law prescribes maximum holdings of quotas by individual fishing companies. Regulations
cover quota holdings both for individual species and in the aggregate.
In 1995, a harvest control rule (HCR) for cod was introduced, setting the TAC for the next
consecutive quota year (September through the following August) at 25% of the mean of the
fishable biomass in the assessment year and the following year. This share was lowered to 20%
in 2007. HCRs have been used for capelin and herring for many years. More recently, HCRs have
been introduced for haddock, saithe, and golden redfish, and the aim is to introduce HCRs for all
important species.
All fisheries are subject to an annual fishing fee. In July 2015 the fee was fixed for a period
of three (quota) years. The fee is to be calculated on the basis of earnings before taxes (EBT) in
fishing and fish processing, using the most recent estimates published by Statistics Iceland. The
fishing fee for the quota year 2016-2017 is estimated at approximately 60 million euros (4,780
b.kr.), or 3% of the total 2015 catch value. The fee is part of the State budget.
higher prices in the markets. The importance of pelagic species has increased significantly in the
last ten years, from one-sixth of the total export value of fish and seafood products in 2006 to
25-30% in the last three years. Cod products are still the mainstay of exported fish and seafood
products, at around 40% of total marine exports.
The comprehensive fisheries management system (FMS) based on individual transferable
quotas (ITQ) was implemented in 1990 to manage the fish stocks and promote sustainability and
economic efficiency (see Box 2.1). The FMS adopted in Iceland is science-based and market-driv-
en. A key role has been assigned to marine research, as the use of available scientific knowledge
is fundamental. Another pillar of the FMS is the commitment to take into account the effects of
various measures or policies on the ecosystem.
In the last two decades, fisheries companies have been actively seeking to enhance efficiency
and benefit from economies of scale through mergers, acquisitions, and vertical integration of
all parts of the value chain. The largest fisheries and processing companies – mainly vertically
integrated firms with harvesting, processing, and marketing within the same company – have
expanded, and the concentration of quota holdings has risen. The 10 and 15 largest fisheries
20 Structure of the economyECONOMY OF ICELAND
Box 2.2
Sectoral limitations on foreign direct investment
The only restrictions on investment by non-residents in Iceland apply to foreign direct investment
in fisheries and primary processing of fish, energy production and distribution, aviation companies,1
and real estate.2 Restrictions on investment in the fisheries sector, the only restrictions applying to
European Economic Area (EEA) residents, have the purpose of protecting the nation’s exclusive
rights to the fishing grounds surrounding Iceland. Direct foreign ownership of fisheries companies
is prohibited, but companies that are up to 25% foreign-owned (33% in certain circumstances)
may own fisheries. Combined direct and indirect ownership of up to 49% is possible, however.
Energy harnessing rights and production and distribution of energy are restricted to EEA entities.
Entities domiciled outside the EEA may not own more than 49% of shares in Icelandic aviation
companies.
1. Act on Foreign Investment in Enterprises, no. 34/1991.
2. Act on the Right of Ownership and Use of Real Property, no. 19/1966. Exemptions may be granted.
companies in terms of quota holdings owned 50% and 63%, respectively, of total quota hold-
ings as of July 2016.
Financial sector
Iceland’s financial services sector grew substantially in the first decade of the 21st century, cata-
lysed by financial globalisation and deregulation in the 1990s and the privatisation of two com-
mercial banks, which was completed in 2003. By year-end 2007, the banking system’s assets
were nearly 10 times GDP. In autumn 2008 and early 2009, roughly 97% of the banking system
(measured in terms of assets) collapsed.1
The financial system has changed radically since then. Three new banks were established and
took over the domestic operations of the collapsed banks, and other smaller financial institutions
have also undergone financial restructuring or lost their operating licences. Four commercial
banks and four savings banks are currently operating in Iceland. The State is the major owner
of two of Iceland’s commercial banks and holds a minority stake in another one. The assets of
the banking system are about one-and-a-half times GDP. Six other credit institutions currently
operate in Iceland: two payment card companies; two investment credit funds; an asset financ-
ing company; and the State-owned mortgage lender, the Housing Financing Fund (HFF) (see
Chapter 3 for further discussion of the financial system).
Tourism
Tourism has been among the fastest-growing industries in Iceland in recent years and has estab-
lished itself as the third main pillar of the Icelandic economy. Over the past decade, the number
of foreign tourists has increased from 320 thousand in 2005 to 1.3 million in 2015. The vast
majority of tourists travelled through Keflavik Airport, or roughly 1,260 thousand, while oth-
1. See Box 3.2 in the 2014 edition of Economy of Iceland.
Structure of the economy 21ECONOMY OF ICELAND
Chart 2.15
Number of foreign tourists and revenues Chart 2.16
from tourism
At constant exchange rate 2015
Nationality of tourists
Thousands EUR millions %
1,500 1,500 100
1,400 1,400
1,300 1,300
1,200 1,200 80
1,100 1,100
1,000 1000
900 900 60
800 800
700 700
600 600 40
500 500
400 400
300 300 20
200 200
100 100
0 0 0
‘90 ‘92 ‘94 ‘96 ‘98 ‘00 ‘02 ‘04 ‘06 ‘08 ‘10 ‘12 ‘14 2002-2003 2008-2009 2012-2013 2014-2015
Number of foreign tourists excluding cruise visits (left) North America European countries2
Number of arrivals of cruise visitors (left) United Kingdom SE Asia
Revenues from tourism (right) Nordic countries1 Other countries
Sources: Icelandic Tourist Board, Central Bank of Iceland. 1. Norway, Denmark, Sweden, Finland. 2. France, Netherlands, Italy,
Spain, Switzerland, Germany. Two-year average.
Source: Icelandic Tourist Board.
ers travelled through other airports and the Smyril Line ferry at Seyðisfjörður. The number of
incoming tourists by air and ferries is projected to exceed 1.6 million in 2016. In addition to these
figures, the number of cruise ship passengers in 2015 was around 103 thousand, up from 72
thousand in 2010. The rapid increase in tourism is also reflected in the number of airlines flying
to Keflavík and destinations available from Keflavík Airport. In the winter of 2015-2016, a total
of 14 airlines offered flights from Keflavík to 57 destinations. In comparison, three airlines offered
scheduled flights from Keflavik in 2010.
The ratio of tourism-generated foreign exchange revenues to total export revenues averaged
31% in 2015, compared to just under 19% in 2010. Of single countries, the US and the UK
accounted for the largest number of tourists, with a combined 38% of the total, followed by
tourists from Germany, at roughly 8%. Until 2015, Central and Southern Europe had been the
largest market, but that year, following a sharp rise in the number of tourists, Northern America
emerged as the largest market area.
This increase in the number of tourists has had a significant impact on Icelandic businesses.
From 2010 to 2015, the increase in turnover in businesses related to the tourist sector was nearly
49% in real terms, and the number of employees on their payroll rose by 65% over the same
period.
Technology and communications
The technological sector of the services industry, the software industry in particular, has diversi-
fied and grown significantly in the last 10-15 years. Between 70 and 80 companies of all sizes are
active in the software sector, specialising in medical, ICT, computer games, logistics, and operat-
22 Structure of the economyECONOMY OF ICELAND
ing management systems. Most of the businesses in software technology are engaged in export
activities, owing to the small size of the home market.
Exportation of expertise in the development of renewable energy is growing, and several
Icelandic companies are engaged in exporting geothermal and hydropower expertise and consul-
tancy to a number of areas, including the US, China, Germany, Central America, and Southeast
Asia.
Iceland’s telecommunications infrastructure is extensive and reaches all parts of the country,
with fibre optic cables, broadband networks, and an extensive mobile phone system with wide-
spread geographical coverage reaching nearly 100% of the population. International connec-
tions are based on satellite earth stations and three intercontinental cables enabling and facilitat-
ing efficient high-speed international connections.
In 2015, 96% of Icelandic households were Internet-connected, the highest percentage in
Europe, compared with 81% in the EU27 and 92% in the other Nordic countries. Nearly all in-
ternet connections are high-speed connections, and around 97% of connected households are
regular users, compared to 92% in other Scandinavian countries and 75% in the EU27.
Transport
The domestic transportation network consists of roads and air transportation. The road sys-
tem totals 13 thousand kilometres, some 5.5 thousand kilometres of which are primary (paved)
roads. Between 2003 and 2010, 22 kilometres of tunnels were built, bringing the total length of
tunnels to 43 kilometres, and four tunnels with a combined length of 24 kilometres are under
construction. Private motor vehicle ownership is widespread and among the highest in the world,
with 670 passenger cars per 1,000 inhabitants, compared to 455 cars per 1,000 inhabitants in
Chart 2.17 Chart 2.18
Paved roads Support to agriculture 20151
Km. % %
6,000 70 3.5
60 3.0
5,000
50 2.5
4,000
40 2.0
3,000
30 1.5
2,000
20 1.0
1,000
10 0.5
0 0 0.0
Zealand
1970-1980 1980-1990 1990-2000 2000-2008 2015
Korea
Canada
European
US
OECD2
Iceland
South
Switzer-
Japan
Norway
Union
New
land
Source: The Icelandic Road Administration (ICERA).
PSE (left) NPC (right)
1. PSE measures transfers as a share of gross farm receipts. NPC is
the ratio between the average price received by producers and the
border price. 2. Provisional figures.
Source: OECD.
Structure of the economy 23ECONOMY OF ICELAND
the other Nordic countries. A weekly ferry connection for passengers, private vehicles, and cargo
operates between East Iceland, Denmark, and the Faroe Islands.
The air traffic infrastructure in Iceland covers all parts of the country. Four international air-
fields are operated, and three major international AOC (aircraft operating certificate) holders
operate in Iceland, offering passenger service, international cargo service, and charter flights.
During summer 2016, a total of 25 airlines offered direct passenger service between Iceland and
84 destinations in Europe and North America, and in the winter of 2016-2017, 17 companies will
offer service to 55 destinations. Roughly 80% of all passenger destinations are in Europe. As of
2016, 11 airlines offer year-round service.
Iceland’s two main shipping lines operate scheduled services to major ports in Europe and
the east coast of the US. Both of them operate transport networks on land and sea in Iceland,
Europe, and North America, as well as offering freight forwarding around the world.
Agriculture and farming
Approximately 1/5 of the total land area of Iceland is arable land or pasture. Less than 5% of
this area is cultivated, with the remainder used for grazing or left undeveloped. Meat and dairy
products are mainly for domestic consumption, and the principal crops are hay, cereals for animal
feed, root vegetables, and green vegetables, which are cultivated primarily in greenhouses heat-
ed with geothermal water. Imports of meat, dairy products, and some vegetables that compete
with domestic production are subject to tariffs, import quotas, and non-tariff import restrictions.
Icelandic agriculture is heavily subsidised, with total on-budget transfers to farmers amount-
ing to 0.8% of GDP in 2015. In terms of the OECD producers support estimate (PSE), Iceland
was third-highest in the OECD in 2015, with a PSE of 56%, compared to the EU15 average of
19% and the OECD average of 18%.
Environment
Sustainable use of fish stocks and other natural resources is an important part of Iceland’s envi-
ronmental policies. Iceland is relatively unpolluted compared to other developed countries, ow-
ing to its sparse population and heavy reliance on renewable energy. The marine environment
surrounding Iceland is relatively unpolluted as well.
Although air pollution is generally low, some pollution – i.e., particulate matter – occurs in
the greater Reykjavík area. Soil erosion has been a longstanding problem due to the cutting of
woodlands and overgrazing on sensitive volcanic soil. The intensity of grazing has been falling,
however, and a concerted effort is made to reclaim eroded land and plant trees.
Iceland complied with its Kyoto commitments for 2008-2012. For the second commitment
period, 2013-2020, Iceland will fulfil its commitments jointly with the EU and its Member States,
in accordance with Article 4 of the Kyoto Protocol. Over 40% of Iceland’s greenhouse gas emis-
sions are regulated under the EU Emissions Trading Scheme (ETS), due to the EEA Agreement.
Joint fulfilment of Kyoto targets with the EU implies that greenhouse gas emissions from Icelan-
dic industry are regulated in a manner comparable to that applying to EU Member States. Iceland
ratified the Paris Agreement in September 2016 and has stated its intention to take part in joint
fulfilment of targets with the EU under the 2015 Paris Agreement.
Because almost 100% of Iceland’s stationary energy comes from renewable sources, actions
taken to reduce net emissions focus on decreasing emissions from transport and fisheries and
24 Structure of the economyYou can also read