Our capital starts with people - Fonds de solidarité FTQ
←
→
Page content transcription
If your browser does not render page correctly, please read the page content below

Our capital starts with people

        S uite 200
 545 Crémazie Blvd. E ast
Montréal, Qué bec H2 M 2W4
 Telephone: 514 383-8383
     Fax: 514 383-2502
 Toll free: 1 800 361-5017
     www.fondsftq.com

                             2007 ANNUAL REPORT_solidarity fund qfl

                                                                      2007
                                                                      ANNUAL REPORT
                                                                      solidarity
                                                                      fund qfl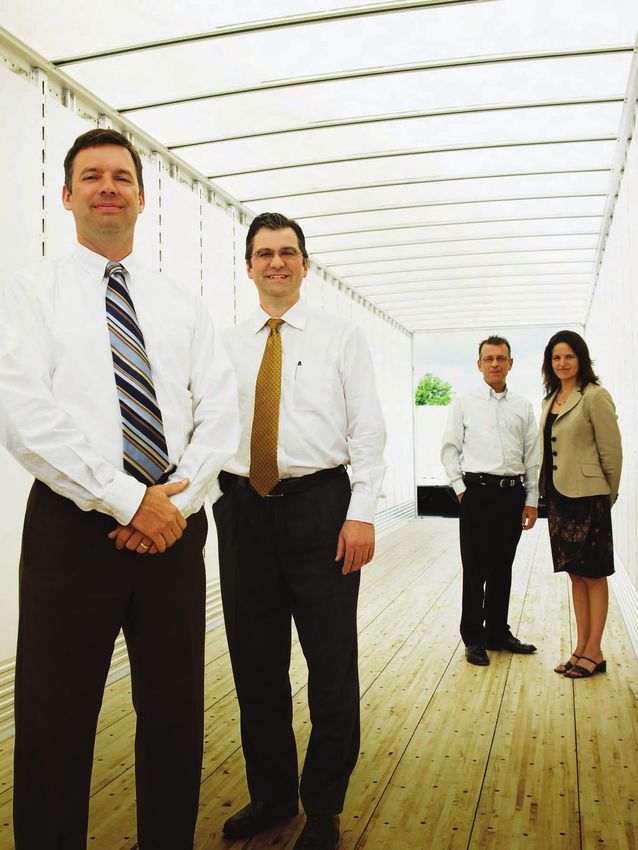
Mission

Create, maintain or protect jobs
Invest in companies impacting the Québec economy and
offer them services to further their development and create,
maintain or protect jobs.
Train workers
Promote economic training for workers so they can increase
their influence on the economic development of Québec.
Develop the Québec economy
Stimulate the Québec economy through strategic investments
that benefit both Québec workers and companies alike.
Prepare for retirement
Make workers aware of the need to save for retirement
and encourage them to do so, as well as encourage them
to participate in the development of the economy by
purchasing Fund shares.

                                                                                                Go i n g Carbon- Neutral
                                                                                                At the Annual General Meeting and the national local representative meeting preceding it, the Solidarity Fund QFL decided to
1                             6                  17                      89                     adhere to the principles of a conference encouraging the reduction of polluting emissions. Therefore, to reduce greenhouse
Highlights                    Shareholder Base   Financial Information   Management Committee   gas emissions (GGE), we encouraged the participants of these meetings to use public transportation.
                                                                         Special Boards
2                             10                 86                                             The Fund also hired Planetair, a not-for-profit organization, to calculate the GGE generated by these two meetings
                                                                         Committees
Message from the Chairman     Training           glossary                Union                  (transportation, meal preparation, etc.). Once the results are final, the Fund will remit to Planetair a compensatory amount in
of the Board OF DIRECTORS
                              12                 88                      90                     keeping with current practice. This money will be invested in renewable energy or energy efficiency projects that will reduce
4
                              Investments        Board of Directors      Permanent Employees    GGE at their source in developing countries.
Message from the President
and Chief Executive Officer
HIGHLIGHTS

   Key data 1
   For the years ended
   (in millions of dollars except Class A shares, in thousands)

                                                               JUNE 30                                                   MAY 31
                                                                     2003                       2004                     2005                     2006                   2007
                                                                                         (11 moNTHS)

   Statement of earnings
   Revenues                                                      (209.1)                       347.0                    372.5                   463.3                   588.9
   Net earnings (net loss)                                       (325.5)                       247.3                    271.1                   366.5                   475.0

   Balance sheet
   Net assets                                                   4,620.2                    5,233.3                     5,955.2              6,607.1               7,239.0
   Class A shares outstanding                                  225,956                    243,946                     264,845               277,466              284,628

   Ratio2
   Operating expenses/Average net assets                            1.8%                      1.8%3                      1.5%                    1.4%                   1.4%
   1. Comparative data has been restated to reflect new accounting standards affecting investment companies.
   2. The operating expense ratio does not include capital tax.
   3. Annualized.

As at May 31
(except 2003, as at June 30)

Net value per share                                           Rate of return of the Fund                       1, 2
                                                                                                                             Share issues
( I n  d o l l arS )                                          ( a s  a  p e rc e nta g e )                                   ( in mi l l i o n s o f  d o l l ar s )

2003                                       20.36              2003                          			 (6.9)                        2003                                         724.7
2004                                       21.37              2004*		                         		 5.2                         2004*                                        554.2
2005                                       22.41              2005		                          		 5.0                         2005                                         706.5
2006                                       23.74              2006		                           		 6.0                        2006                                         613.8
2007                                       25.36              2007                                7.1                        2007                                         570.7
                                                              * (11 months)                                                 * (11 months)
                                                              Average annual return since inception: 5.1%

NUMBER OF JOBS CREATED,                                       Number                                                         Number of partner
MAINTAINED OR PROTECTED IN QUÉBEC                             of shareholders                                                companies
BY THE FUND AND ITS PARTNERS                                                                                                 ( F u n d  an d  n e t w o r k )

2003                                       91,694             2003                                          550,119          2003		                                       1,666
2004                                       96,000             2004                                          554,796          2004		                                       1,722
2005                                      105,596             2005                                          568,383          2005		                                       1,683
2006                                      116,644             2006                                          573,086          2006		                                       1,681
2007                                      122,460             2007                                          574,794          2007                                         1,696

Redemptions                                                   FAIR VALUE OF INVESTMENTS                                      investments 3
( in mi l l i o n s o f  d o l l ar s )                       IN PARTNER COMPANIES 3                                         ( in  M I LL I O N S  o f  d o l l arS )
                                                              ( in mi l l i o n s o f  d o l l ar s )

2003                                       313.0              2003                                          2,633.5          2003                                         368.5
2004*                                      188.5              2004                                          2,695.4          2004*                                        404.7
2005                                       255.6              2005                                          2,900.8          2005                                         492.2
2006                                       328.7              2006                                          3,342.5          2006                                         642.8
2007                                       402.3              2007                                          3,741.9          2007                                         667.7
* (11 months)                                                                                                               * (11 months)

1. Earnings (loss) per share divided by the share price at the beginning of the fiscal year.
2. Return does not take into account tax credits for shareholders.
3. These investments include the funds committed but not disbursed as well as funds for guarantees and suretyships.

2 0 0 7 ann u A l R EPO R T 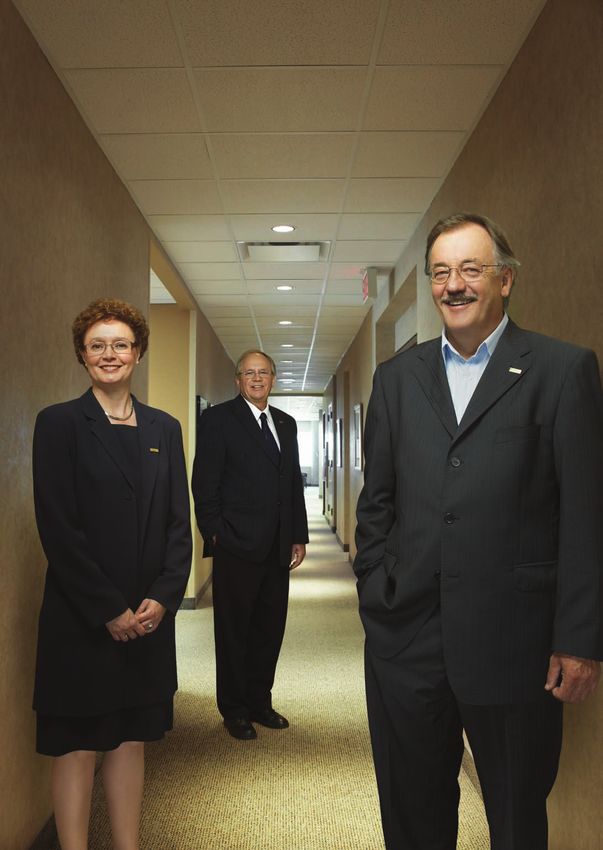
Sustained efforts
    to create and
    maintain jobs

                                                                 From left to right
                                                                 LOUISE ST-CYR
                                   Chairholder, Chair of Small and Medium-Sized
                                        Businesses, HEC Montréal, and President
                                              of the Audit Committee of the Fund
                                                                       RENÉ ROY
                                          General Secretary, QFL, and Secretary
                                            of the Board of Directors of the Fund
                                                                   HENRI MASSÉ
                                                   President, QFL, and Chairman
                                            of the Board of Directors of the Fund

   2 0 0 7  ann u A l R EPO R T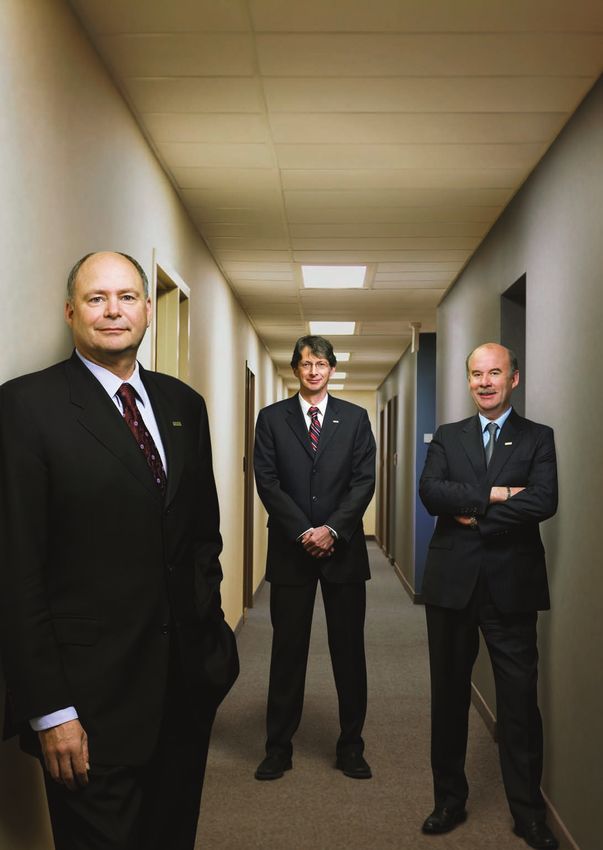
ME S S A G E F R OM T H E C H A I R MAN
OF T H E BOA R D OF D I R E C T O R S

Fiscal 2006-2007 was a remarkable year for the Fund, one in          We must back any worthwhile initiative that will help
which we fulfilled our role as investor in SMEs and had a major      entrepreneurs in this sector adapt to the current context,
impact on the Québec economy. Our efforts reflect our                which means modernizing, developing new markets, and
commitment to build a stronger Québec economy and keep               boosting exports. While wealth creation is necessary, it must
jobs here at home.                                                   be well distributed and focus on employment.

For us, investing is part of an approach to create collective        Our collective priority must therefore be the Québec economy.
wealth by focusing on quality jobs: those we can create and          Once again, I do not understand why governments are still
those we must preserve. That’s why we invest throughout              not doing everything they can to help entrepreneurs and
Québec. We made this decision from the outset and it has made        promote the restructuring and modernization of our industries.
us pioneers in local and regional development. With our SOLIDE       Except in the forestry sector, no concrete measure has been
(Sociétés locales d’investissement dans le développement             implemented to help workers suffering the fallout of the
de l’emploi) and regional and specialty funds network, we have       changes in the manufacturing industry.
invested with our collaborators and partners in projects that
                                                                     A medium- and long-term vision
are of interest to all the regions. Together, we have created a
                                                                     It certainly is no secret that I am against purely speculative
unique, responsible investment model that is founded on the
                                                                     investments, particularly those made by U.S. private funds.
importance of supporting economic development across Québec.
                                                                     There is no medium- and long-term vision behind these
Working together                                                     strategies; the investors are not at all concerned with
I have always stressed the vital economic role government            the survival of the companies in which they invest. Their sole
corporations play and would like to highlight the efforts made       interest is to turn a quick profit. To be sure, we have nothing
by some of them. Although, in my opinion, they could still do        against seeking out attractive returns to increase wealth,
more, at least they are becoming more economically focused.          but not to the detriment of our social values or mission to
In this regard, the work of the Caisse de dépôt et placement du      create and protect jobs and help grow the economy.
Québec, for example, merits acknowledgment. By partnering
                                                                     In fact, since 2003, the Fund has invested hundreds of millions
with other organizations last May and launching the Centre
                                                                     of dollars in more than 30 private funds in a variety of sectors.
international sur la prospérité des entreprises du Québec,
                                                                     We make these types of investments when they generate
the Caisse was on the right track, since the success of our
                                                                     concrete economic spin-offs for Québec and help our
local companies requires that they adapt their business plans
                                                                     entrepreneurs build solid businesses, create jobs and take
to globalization. I was part of the working group that set up
                                                                     up the challenge of international competition.
this centre, and now, the Fund’s President and Chief Executive
Officer, Yvon Bolduc, has taken the reins to help ensure that        In closing, I would like to congratulate all the Fund’s employees
all this economic prosperity also translates into quality jobs       for their remarkable work, to which we owe this year’s excellent
for Quebecers.                                                       results. I would also like to thank our local representatives for
                                                                     their tremendous contribution.
As for our companies, we must all work together to help them
grow. The tough economic times we are experiencing,                  And finally, a very special thanks to you, our shareholders,
particularly in the manufacturing sector, concerns us all. No        for your valued trust for which we are extremely grateful.
one is spared. Our manufacturing sector has been permanently
weakened: since 2002, more than 100,000 jobs have been
swept away by the wave of globalization. Everyone is affected
by this disastrous situation, and with a strong Canadian dollar
nearing parity with the U.S. dollar, volatile oil prices, a global   Henri Massé
economic slowdown, unrelenting Asian competition, and                Chairman of the Board of Directors
a graying population, our problems are far from over.
Consequently, we must all join forces and work together:
employers, unions, governments, government corporations and
all the organizations concerned.

2 0 0 7 ann u A l R EPO R T 
Success based
    on expertise
    and teamwork

                                            From left to right
                                             YVON BOLDUC
                                        President and Chief
                                           Executive Officer
                                            GAÉTAN MORIN
                                   Executive Vice-President,
                                                Investments
                                            DENIS LECLERC
                                   Executive Vice-President,
                                      Shareholder Services

   2 0 0 7  ann u A l R EPO R T
ME S S A G E f r o m T H E P R E S I DEN T
AND C H I EF E X E C U T I VE OFF I C E R

As you may recall, last year was a record year for profits and        The strength of our networks
investments. Well, this year we beat those records! Indeed, fiscal    I would now like to acknowledge the contribution of all those
2006-2007, ended May 31, was a great year, and I am extremely         who contribute from near and far to the Fund’s success. Our
pleased to report our results. But first, I would like to highlight   organization is a group of networks comprising hundreds of
the excellent work of the Solidarity Fund QFL’s employees.            thousands of people who subscribe to our values and economic
Their expertise, professionalism and unwavering commitment            development mission. Firstly, this group consists of our
are the reason we were able to make so many quality                   investment network, composed of our multidisciplinary
investments and why our partners and shareholders are                 investment teams at headquarters, our specialty funds, and
so satisfied with our services. I sincerely thank them.               our regional and local investment funds that cover all of Québec.

Our share value rose for the ninth consecutive time to $25.36         Next, we have our shareholder network, which as at May 31,
on July 5. Net earnings amounted to $475 million, which               boasted 574,794 shareholders. We are particularly proud of their
translated into a return of 7.1%, our best in the last seven years,   participation: more than half a million Quebecers who band
and our net assets reached $7.2 billion. But that’s not all. We set   together to help the economy become more competitive so that
a new record of $668 million in investments! Despite an               Québec can thrive. The Fund is also made up of its vast network
increasingly competitive environment, our multidisciplinary           of 2,127 local representatives (LRs) who volunteer their time
investment teams put forth colossal efforts which bore fruit. Our     to promote the Fund’s mission and RRSP in their workplace.
investment portfolio generated a gross return of 10.1% for the        This exceptional and vital network is an integral part of the
year. Through these investments, the Fund provides growing            Fund’s success. I would therefore like to thank all the LRs for
support in all the economic sectors of Québec. For example,           their invaluable work.
during the year we invested $20 million in Spectra Premium and
                                                                      Lastly, the Fund is a network of entrepreneurs, business leaders
$75 million in Van Houtte. These two strategic transactions
                                                                      and workers who have decided to capitalize on the added value
allowed us, among other things, to set ourselves apart in terms of
                                                                      of our approach and services, including our unique economic
buyouts and succession planning and to expand our role into new
                                                                      training program. They have chosen the Fund because it offers
stages of the financing chain for Québec companies. I would also
                                                                      more than money: we stand by them as they grow by providing
like to point out that 47% of our investments were made in
                                                                      patient capital tailored to their ambitions and projects and by
manufacturing companies. Helping to boost the competitiveness
                                                                      placing all our expertise at their disposal. As they themselves
of local manufacturers that have been especially hard hit by
                                                                      have told us, these are the reasons they chose us as partner in
global competition and the rising Canadian dollar is a priority.
                                                                      their growth.
Given these additional challenges, we are all the more proud of
our performance this year.                                            I am very pleased with the Fund’s performance in 2006-2007
                                                                      and sincerely thank each and every one of you for contributing
I would like to congratulate Québec’s entrepreneurs for
                                                                      to our success.
the adaptability, creativity and boldness they have shown
these last few years in response to their many challenges,
and for converting their good ideas into action to enhance
their competitiveness.

                                                                      Yvon Bolduc
                                                                      President and Chief Executive Officer

2 0 0 7 ann u A l R EPO R T 
Jocelyne Bourget
    Pratt & Whitney employee
    and Spouse of Claude Bourget
    “It’s true that the Solidarity Fund
    provides impeccable customer
    service, and we’re not just
    saying that – we’ve experienced
    it first hand!”

                                          Claude Bourget
                                          Pratt & Whitney employee
                                          and Fund shareholder
                                          “Buying a house is a big deal and
                                          a little stressful! I’m really happy
                                          to have been able to redeem my
                                          Fund’s shares to use the Home
                                          Buyers’ Plan and make this
                                          wonderful purchase. It’s really great,
                                          especially since everything went
                                          smoothly and quickly.”

                                                                    Daniel Grisé
                                                                    Local Representative
                                                                    of the Fund and
                                                                    Pratt & Whitney employee
                                                                    “I always take a lot of pride in
                                                                    showing my colleagues the
                                                                    advantages of the Fund’s RRSP.
                                                                    It was a real pleasure to help
                                                                    Jocelyne and Claude use their Fund’s
                                                                    shares to take advantage of the
                                                                    Home Buyers’ Plan.”

Your contribution
creates rewarding
opportunities
     2 0 0 7  ann u A l R EPO R T
S H A R E H O L DE R BA S E

The Shareholders’ Booklet turns 10!                                  “My online account”
Introduced in 1997, the shareholders’ booklet is a communication     One of the concerns of the Executive Vice-President,
tool that has set itself apart over the years by its quality and     Shareholder Services was to offer shareholders a totally
personalized information. This tool was a singular success           secure website where they could make even more
from the start and is increasingly valued by shareholders, who       transactions. On April 2, 2007, the Fund launched such a
not only pay careful attention to the information it provides on     site, and now, besides being able to consult their accounts,
their portfolio’s performance and the growth scenarios for their     shareholders can also sign up for payroll deduction or
retirement savings, but also recognize the quality of the booklet    preauthorized withdrawal, and even change the amount of their
itself. As a direct result of the time and effort invested in this   contribution online. This is one more way to encourage
special means of communication, the booklet has played a key         systematic savings, which accounted for 74% of all
role in building shareholder loyalty over the last 10 years.         subscriptions in 2006-2007.

This success pushed us to pursue further efforts to personalize      Since most of these transactions are processed electronically,
the booklet, which led to the creation of a new generation of        we can make it easier for shareholders to access these
fully personalized booklets that now also contain a regional         contribution methods by cutting down on paper forms and
dimension. This newly added element provides an opportunity          processing time. This also helps us maintain a high standard
to remind our shareholders of the Fund’s commitment to their         of service quality. Also, one of the greatest advantages of
region and reassert how important that commitment is to us.          this new site is that it provides another tool to facilitate our
                                                                     LRs’ work in the field.
Also, in the interest of efficiency and economy, we have merged
three mailings into one. Now when shareholders receive their         Shareholder services
booklet, they also receive their Relevé 10 and extracts of the       On May 31, 2007, the Solidarity Fund QFL had 574,794
Fund’s most recent financial statements.                             shareholders. It should be noted that, in the last year, our
                                                                     agents fielded nearly 340,000 calls, including more than 134,000
                                                                     during the RRSP campaign. This front-line, person-to-person
                                                                     (no automated voice response) service, adapted to our
                                                                     shareholders’ needs, remains a priority for the Fund.

                                           Carine Bonnardeaux
                                           Fund Shareholder

                                           “I was really proud to receive my shareholders’ booklet! I think it
                                           is well put together and a great communication tool for personal
                                           finances. The information on my transactions and RRSP and non-RRSP
                                           portfolio is clear. It also provides different personalized scenarios
                                           showing my portfolio’s future growth so I can easily see how much
                                           money I will have to iMPROVE my quality of life during retirement.
                                           This is truly a helpful tool!”

2 0 0 7 ann u A l R EPO R T 
S H A R E H O L DE R BA S E

Our first network                                                       Each year they also participate in three activities designed
As at May 31, 2007, the Fund had 2,127 local representatives            exclusively for LRs by the Fund as part of a continuous
(LRs). This network – our very first – is a tremendous                  training program. In September 2006, they attended
source of pride. And it is thanks to our LRs, who explain               a workshop on the tax impact of retirement savings plans and
the advantages of payroll deduction so well, that so many               in January 2007, participated in an in-depth session on the
shareholders enjoy payroll deduction and the immediate tax              Home Buyers’ Plan and the Lifelong Learning Plan. During
savings with each pay. Thanks to the LRs’ promotional efforts,          regional meetings last spring, our LRs learned about retirement
thousands of Fund shareholders are not only enjoying a more             income, more specifically, the Registered Retirement Income
comfortable retirement, but using the popular Home Buyers’              Fund (RRIF).
Plan (HBP) to purchase their first home (see table below).
                                                                        LRs also receive support on a daily basis from their primary
Because they are present in the workplace, the LRs can                  source of coaching, the coordinators at the Fund’s Subscription
better inform shareholders about the Fund’s economic mission            Development Department. And besides the many reference
and the important role its shareholders play in Québec’s                tools we make available to them, they can call LR Services at
economic development.                                                   any time to obtain information or documents. In fact, they have
                                                                        their own dedicated call centre.
Solidly trained people
The LR network was created at the same time as the Solidarity           Solidarity above all
Fund QFL. The Fund’s founders and affiliated unions were                The Fund’s LRs are motivated by a sincere desire to heighten
right when they insisted that union activists promote the Fund,         their co-workers’ understanding of the importance of saving
its mission and RRSP in the workplace. Today, this network              for retirement. They believe in the Fund’s mission and want
is the envy of many financial institutions.                             to encourage workers to support it.

LRs acquire solid training and ongoing support to help them             Our LRs can be described as activists with people skills who
execute their mandate as the Fund’s representatives. In                 want to learn and master all the subtleties of the Fund’s shares
addition to the basic training they receive when they join the          and RRSP for the benefit of their co-workers.
network, the LRs attend follow-up meetings within six months
                                                                        We’re proud to be able to count on them.
to review what they learned and clarify certain points.

    Redemption breakdown by criterion                                                 Shareholder profile
    For the year ended May 31, 2007                                                   As at May 31, 2007

    Criteria	                                     NUmbEr   Millions $     %           N u m b e r o f sh a r e h o l d e rs
    Retirement and early retirement
    Access to home ownership
                                                  33,337
                                                   4,418
                                                                 321
                                                                  34
                                                                          80
                                                                           8
                                                                                      574,794
    Unforeseen events (job loss or other)          4,816          16       4
    Death, disability, redemption                                                     st a t u S
     within 60 days                                2,026          23       5
    Return to studies                                399           2       1
    Other criteria                                   627           6       2
     (capital injection into a business,
     emigration, redemption of pension                                                Unionized                        Non-unionized
     credits and ineligibility for tax credits)
                                                                                      332,184                          242,610
    Total                                         45,623         402    100           58%                              42%

   2 0 0 7  ann u A l R EPO R T
NUMBER OF
LOCAL REPRESENTATIVES
AT YOUR SERVICE:
2,127
Melvin Marquis
LOCAL REPRESENTATIVE
“Long Live Systematic Savings!
Many years ago, I witnessed some layoffs and saw some of my
co-workers retire without enough savings. I said to myself, ‘Never
again!’ For more than 15 years now, I’ve been promoting the Fund’s RRSP
as an ideal complement to a pension plan. I’m a firm believer in payroll
deduction because it makes saving for retirement easy. Not only does it
become a habit, but with the immediate tax reduction, people don’t even
notice the difference on their net pay!”
2 0 0 7 ann u A l R EPO R T Gabriel Charky
President and
Chief Executive Officer
Allianz Madvac
“The Fund’s economic training
program is a very effective program
that is worth getting to know.
Investing in the workforce in this
way, we’re investing in the future of
the company.”
Diane du Tremble
Training Advisor,
Guy Croteau Solidarity Fund QFL
Training Advisor, “Many entrepreneurs shared
Solidarity Fund QFL with us extremely positive
“Economic training gives management reactions to the economic
and employees a common understanding training program.”
of the company’s challenges, which
allows them to communicate using the
same language.”
Training: a value-added
advantage of the Fund
10 2 0 0 7 ann u A l R EPO R TTRAINING
The economic training provided by the Fund is geared toward Many entrepreneurs have noticed that each time a training
all the employees of its partner companies, and springs from session is offered, the participants’ questions become
the Fund’s desire to contribute to their growth. more specific. This is because the courses are well adapted
to the experience of the participants and motivate them to take
By counting on transparency and good communication practices
part in the company’s success.
between management and employees of the companies
receiving training, the economic training program seeks, among Continuous training for LRs
other things, to establish a common understanding, from a During the year, the Fondation de la formation économique,
financial perspective, of the issues and challenges the working closely with the Fund’s subscription coordinators,
companies face. In this way, everyone “speaks the same continued to develop ongoing training activities for our LRs
language” and is better equipped and mobilized to make (for more details, see page 8).
suggestions that may help secure the company’s future while
The Fondation also introduced a global evaluation process
maintaining and creating quality jobs.
for LR training aimed at ensuring that the content continues
Since 2006, it has truly become a training program, and during to adequately meet the needs and reflect the experience
the last year the program has been comprehensively applied. It of our LRs.
is no longer a question of training sessions, but a real economic
training “program” spread over three years and designed in
response to the needs of both employers and employees. Training activities
Year ended May 31, 2007
This past year, in addition to the courses on business plans,
financial health analysis and financial communication practices, Participants coursES
we added a course on the situation of companies in the context Local representatives 3,111 212
of globalization. In the workplace 2,264 132
Network members 570 26
Students 396 21
Total 6,341 391
Manon Bélec
Regional Sales Manager, Eastern Canada, Laura Secord
“The Fund’s economic training was well adapted to our employees’ needs
and experience. Now everybody has the same level of understanding
of the company’s financial issues. They all found the program very
interesting and they now have a global picture of Laura Secord, one
that goes beyond store sales. They understand that everything we do
affects the bottom line. This course was a real catalyst, motivating
them to work as a team.”
2 0 0 7 ann u A l R EPO R T 11Charles Dutil
President and Chief
Operating Officer, Manac
“The Fund’s investment allowed us
to reposition our product line in
order to maintain our growth pace
in the competitive environment
of our industry.” Richard Cloutier
Senior Marketing
Advisor
Sonia Lévêque
Legal Advisor
Two members of the Fund’s
multidisciplinary team that worked
closely on the company’s repositioning
and contributed to its success.
Raynald Aubin
Portfolio Manager –
Investments, Transportation
Equipment and Automobile
Sector, Solidarity Fund QFL
“Manac is a great example of
regional economic development and
our sectoral teams’ expertise
contributed to this success.”
Our teams back you
at every level
12 2 0 0 7 ann u A l R EPO R Ti n v e st m e n ts
Our success is based on expertise and patient capital business valuation, taxation, legal support, marketable
To help our partner companies meet the numerous challenges securities, due diligence and social audit) are well known by
they face, we provide patient capital – capital that will truly our partners. They also know that in order to modernize their
allow them to carry out modernization or expansion projects equipment, conquer new markets, develop and launch new
and to boost their competitiveness. Our advisors all have products, or innovate, grow and make acquisitions, they need
solid investment expertise and are competent business people a solid backer whose financial products and financing offer
who speak the same language as entrepreneurs. Indeed, the can be tailored to their needs. And that is exactly what we do.
figures bear this out: for the year ended May 31, 2007, the Fund Moreover, because of our mission and size, we can stand by
alone invested $668 million, setting yet another annual record. our partners through tough times when they need the most
Including the investments made by our regional funds, we support to carve out a competitive position or to grow.
backed 145 companies, including 92 new ones. Our investment
According to a study conducted by SECOR,1 jobs increased 31%
portfolio generated a gross return of 10.1% over the last year.
in companies in which the Fund invested, compared to 23% in
As we can see, our achievements this past year clearly show
other businesses, our partner companies export three times
that our capital is not only patient but also profitable.
more than the Canadian average and invest nearly four times
We also set ourselves apart on the SME private equity as much in research and development as their competitors.
market here at home, where we are one of the leaders. The
Successful partners
Fund alone accounted for nearly one third of all venture
The Fund’s success is first and foremost our partners’
and development capital investments in Québec. And thanks
success. In this regard, the testimonials are clear: thanks
to our patient capital approach and unique positioning,
to the Fund, “we were able to make acquisitions” (CVTech),
Québec entrepreneurs are now fully aware of the Fund’s
“we succeeded in penetrating the U.S. market” (Allianz
advantages. They choose to partner with us because of our
Madvac), “we built a business network, designed new products
large investment capacity and our extensive knowledge of
and conquered new markets” (Manac). Some business
SMEs and of Québec’s economic fabric. For these reasons
owners have also told us that we were a big help in improving
the Fund is increasingly becoming the partner of choice
their succession plan (Labrie Environmental Group).
for entrepreneurs.
The Fund’s specialized Investment teams and the impressive
resources of its multidisciplinary teams (market analysis, 1. SECOR and Regional Data Corporation, February 2005.
Gilles Fradette and Dany Dumont
co-prEsidents, Glendyne, Saint-Marc-du-Lac-Long
“Glendyne had a tough start. In 1995, slate extraction did not exist
in Québec and since no one really had the right training, the trade
had to be learned. Many were sceptical, but the Fund believed in us,
and because of their backing, we’ve been able to surpass every target
we set. It’s clear that, thanks to their patience, we’ve been able to
grow and become leaders in our market.”
2 0 0 7 ann u A l R EPO R T 13i n v e st m e n ts
Others point out how we helped them structure their company Moreover, these investments give our partner companies
or set up their board of directors. These are the types access to specialized expertise and to a network of contacts
of value-added services that convinced them to choose the that will facilitate their expansion in foreign markets.
Fund as a financial partner.
We also invest directly in companies targeting high-potential
Major transactions niches such as Cellfish Media, Bluestreak Network,
Backing start-ups, enabling larger acquisitions and Oz Communications, Trellia Networks, Envivio and
stimulating SME growth are all vital to building a stronger Coveo Solutions.
Québec economy.
We are proud of how well our focus on patient capital has
In 2006-2007, we positioned ourselves as an important paid off, particularly in the biotech sector. In the last 10 years,
economic player in a number of major transactions, such as we have invested hundreds of millions of dollars in this
the $20 million investment in Spectra Premium, the support cutting-edge sector, where we have over 50 partners, of
that allowed Kruger to acquire Maison des Futailles, and more which 18 are publicly traded. Québec has become a major life
recently, the $75 million investment in coffee giant Van Houtte. sciences hub in North America, and this sector is responsible
Among other things, these investments have allowed some for thousands of quality jobs here at home.
of our Québec flagship companies to keep their operations
We meet all types of financing needs (seed, start-up,
in Québec, preserve jobs or even to take a step further in
consolidation, expansion, export, IPO) and are present in all
their growth.
spheres of activity. Moreover, because of our size, we play
As well, to ensure Québec has a healthy, diversified and a fundamental role in the regions: as at March 31, our network
vibrant venture capital industry, we invested in specialty of regional funds had 261 partner companies in Québec.
private funds both here and internationally. These investments
No matter the sector we invest in, our strategy is the same:
not only stimulated the Québec venture capital industry by
to help our partner companies grow. And as this year’s results
spawning new funds (MSBI II and GO Capital, for example) and
show, it is a winning strategy.
attracting foreign funds to Québec, they also provided access
to capital for businesses in the seed or start-up stage.
FROM LEFT TO RIGHT
Oz Communications
Sk u li M o g en son
MethylGene
D ona l d f. Corcoran
CVTech
M onia C ôt é
14 2 0 0 7 ann u A l R EPO R TINVESTMENTS
FOR THE YEAR:
$668 M
Jean Bourgeois
Chief Executive Officer
Labrie Environmental Group
saint-nicolas
“In addition to greatly facilitating our succession process, the Fund’s
financial backing also allowed us to make a major acquisition in the
U.S. We were the first to introduce selective waste collection trucks
on the market, and our product line revolutionized the industry.
By focusing on innovation and growth, we are now among the leaders
in our industry.”
2 0 0 7 ann u A l R EPO R T 15i n v e st m e n ts
122,460 jobs created,
maintained or protected in Québec
by the Fund and its partners
As at May 31, 2007
Distri b u ti o n
INDIRECT JOBS DIRECT JOBS
31,016 64,794
Solidarity Fund QFL 4 1,657
Regional and local funds 20,395
INDUCED JOBS Specialty funds 2,742
26,650 64,7941
1. With its partners, the Fund has helped create, maintain or protect more than 102,000 direct jobs since inception.
Change in investments
(at cost) 2006-2007 1
Balance as at May 31, 2006 2 Investments Disinvestments Balance as at May 31, 2007
REgions 3 No. Millions $ % No. Millions $ % No. Millions $ % No. Millions $ %
Western Québec 15 82 3 3 2 0 4 10 2 14 74 2
Montréal Region 138 1,222 39 47 313 47 39 142 29 146 1,393 42
Central Québec 17 112 3 8 25 4 7 9 2 17 128 4
Québec City Region 32 363 12 5 12 2 14 32 6 28 343 11
Eastern Québec 31 215 7 2 19 3 11 98 20 29 137 4
All of Québec 43 869 28 8 143 21 16 79 16 45 933 28
Outside Québec 34 264 8 12 154 23 14 120 25 37 297 9
Total 310 3,127 100 85 668 100 105 490 100 316 3,305 100
SectOrs
Real estate 9 295 9 3 43 6 2 23 5 10 315 9
Regional development 4 29 377 12 1 17 3 3 7 1 23 386 12
Industries, services,
natural resources
and consumer 146 1,530 49 46 474 71 66 376 77 157 1,628 49
Technology
investments 5 126 925 30 35 134 20 34 84 17 126 976 30
Total 310 3,127 100 85 668 100 105 490 100 316 3,305 100
1. Excludes stock held in Entreprises publiques québécoises à faible capitalisation and includes the funds committed but not disbursed as well as funds for
guarantees and suretyships.
2. The breakdown by regions and sectors as at May 31, 2006 has changed to account for reorganizations undergone by companies in the portfolio.
3. Regional groupings: Western Québec: Abitibi-Témiscamingue/Outaouais. Montréal Region: Montréal/Laval/Laurentides/Montérégie/Lanaudière. Central Québec:
Estrie/Mauricie/Centre-du-Québec. Québec City Region: Capitale-Nationale/Chaudière-Appalaches. Eastern Québec: Bas-Saint-Laurent/Saguenay–Lac-Saint-
Jean/Gaspésie–Îles-de-la-Madeleine/Côte-Nord/Nord-du-Québec. All of Québec: Investments impacting more than one region. Outside Québec: Investments
in companies headquartered outside Québec.
4. Regional funds, local funds and regional investment companies.
5. Life sciences, information technologies, telecommunications, industrial innovations, and bio-food.
16 2 0 0 7 ann u A l R EPO R TFINANCIAL
INFORMATION
Fonds Fondation de la formation
d e s o li da rité économique du fonds de
d e s tr ava ill e u rs solidarité des travailleurs
d u q u é b e c ( f. t. q . ) du québec ( f. t. q . )
19 Financial Statements
as at May 31, 2007 AND 2006
MANAGEMENT’S DISCUSSION
AND ANALYSIS 80
Auditors’ Report
Financial Statements 81
as at May 31, 2007 AND 2006 Statements
33 OF FINANCIAL POSITION
Management’s Report 82
and Auditors’ Report Statements OF OPERATIONS
34 83
Balance Sheets Statements
35 of Changes in Net Assets
Statements of Earnings 84
36 Notes
to Financial Statements
Statements of Changes
in Net Assets
37
Statements
of Cash Flows
38
Notes to
Financial Statements
investments made
as at may 31, 2007
54
Auditors’ Report
55
Schedule of Investments
at Cost
INVESTMENTS made
by the Specialty Funds
as at may 31, 2007
62
List of Investments
at Cost made by
the specialty funds (unaudited)
2 0 0 7 ann u A l R EPO R T 17Finance:
a strategic role
in the organization
From left to right
MICHEL PONTBRIAND
Executive Vice-President,
Finance
ANDRÉ McDONALD
Director, Financial Services
SYLVAIN PARÉ
Vice-President,
Financial Management
and Strategy
18 2 0 0 7 ann u A l R EPO R TM A N AG E M ENT’S DISCUSSION AND ANALYSIS
F O R T H E YEAR ENDED MAY 31, 2007
This Management’s Discussion and Analysis (“MD&A”) is intended to help the reader to assess the Fund’s financial position and any
material changes that occurred therein during the year ended May 31, 2007. To have a thorough understanding of events and
uncertainties, this MD&A should be read together with our financial statements and the notes thereto.
This MD&A contains forward-looking statements about the Fund’s activities, results, and strategies. Because forward-looking statements
involve assumptions, uncertainties and risks, it is possible that a number of factors may cause forecasts not to materialize. For example,
legislative or regulatory changes, economic and business conditions and the level of competition are just a few of the major factors
that could influence the accuracy of the forward-looking statements in this report. This MD&A is dated June 21, 2007.
A N A LY S I S O F R E S U LT S
The 2006 results presented in this section were restated to reflect the new accounting standards affecting investment companies.
Accordingly, interests in investment companies are measured and presented at the fair value and are no longer consolidated.
This change does not affect net earnings, earnings per share, or net share value but does result in some reclassifications in
the financial statements.
Ov e r a l l Re s ults
Solid performance characterized the year ended May 31, 2007, during which the Fund recorded net earnings of $475 million, an increase
of $109 million or 30% over last year’s record net earnings of $366 million. With these solid results the Fund generated a return
of 7.1% for the year, higher than the 6.0% return generated the previous year and above the forecasts that were made last year. These
results mark the Fund’s best performance since the technology bubble burst at the beginning of this decade.
The two main sectors of the Fund, investments and other investments, were both major contributors to the excellent results posted
for the year. The assets managed by the investments sector are essentially mission-driven investments in public and private partner
companies in the form of shares, units or loans. The 2006-2007 gross return for this sector reached 10.1%, a higher return than the
8.2% generated the previous year. The average assets in this sector represented $2.5 billion or 36% of the Fund’s average assets
under management.
The other investments sector manages the remaining assets not invested in partner companies, which consists of bonds, money market
securities, sector-based shares, funds of hedge funds and a portfolio of high-revenue securities.1 The gross return for this sector for
the fiscal year ended May 31, 2007 was 7.9%, which was also higher than last year’s return of 7.1%. The average assets of this sector
amounted to $4.3 billion, or 64% of the Fund’s average assets under management.
Our concern with operational efficiency and controlling our operating expenses also significantly contributed to our results, as evidenced
by the ratio of operating expenses to average net assets of 1.4% for the fiscal year ended May 31, 2007, which equals last year’s ratio.
Including income and capital taxes, the ratio of expenses to average net assets is 1.7%. This slight increase compared to the 1.6% ratio
posted for fiscal 2005-2006 is the result of a higher income tax expense compared to the previous year.
Return by sector
Years ended May 31
2007 2006 (restated)
Average Weight Return Contribution Average Weight Return Contribution
assets under assets undER
managemenT management
$M % % % $M % % %
Investments 2,452 36.2 10.1 3. 7 2,21 7 35.7 8.2 3.0
Other investments 4,327 63.8 7.9 5.1 3,986 64.3 7.1 4.6
6,779 100.0 8.8 8.8 6,203 100.0 7.6 7.6
Operating expenses (1.4) (1.4) (1.4) (1.4)
Income and capital taxes (0.3) (0.3) (0.2) (0.2)
Fund return 7.1 7.1 6.0 6.0
1. The portfolio of high-revenue securities is comprised of preferred shares, high-dividend shares, and income trust units.
2007 ANNUAL REPORT 19S e c to r Re s u lts
The performance of the investments sector is influenced by various factors, including the behaviour of the financial markets, the economic
and business conditions in which our partner companies operate, and active management of our investments. The 10.1% return of the
investment sector for fiscal 2007 is largely explained by the following:
• Significant improvement of the results of our portfolio of private securities and specialty funds, which continued to improve during fiscal
2007, generating a 9.9% return on an average portfolio of $1.7 billion, compared to a return of 2.8% recorded the previous year. With
a 14.6% return, compared to 5.2% in fiscal 2006, the private securities portfolio was largely responsible for the investment sector’s
performance this past year. Taking into consideration the continuous increase in the annual investment volume over the last four years,
these results are evidence of our efforts and rigor in managing our portfolio over the years;
• The stock market’s solid performance over the last year, which led the portfolio of listed securities of our investment sector to achieve
a return of 10.4% on average assets of $736 million. This outstanding performance follows the exceptional return of 21.6% generated
by the portfolio in last year’s bull market.
The strategies adopted, combined with the evolution of the interest rates and the performance of the stock markets, are the determining
factors in analyzing the performance of the other investments sector. Accordingly, the results achieved by this sector are influenced
by the behaviour of the financial markets and the conditions affecting the economic environment in which the Fund operates. The return
of 7.9% of the other investments sector for the year ended May 31, 2007 is largely explained by the following:
• The performance of the stock markets magnified the results of the sector-based strategy implemented three years ago to convert
our large-cap stocks into publicly traded securities in four specific sectors2, thereby resulting in a return of 18.3% on average assets
of $1.0 billion. This strategy, implemented to reduce our overall portfolio’s volatility, delivered the expected results, and the solid
performance of the stock markets helped generate a higher than expected return. This performance follows returns of 21.0% and
20.3% recorded for the years ended May 31, 2006 and 2005, respectively;
• A return of 4.4% earned on our portfolio of fixed-income securities during the last year on outstanding assets of $3.2 billion in
a Canadian financial market characterized by volatility in interest rates, which were lowered in the first half of the fiscal year, followed
by a sharper increase in the second half of the fiscal year. The hedging strategy implemented to mitigate the anticipated interest rate hike
was fruitful, notably at the end of the fiscal year, allowing us to reduce the impact of the depreciation of the bond portfolio caused
by the increase in interest rates. The 4.4% return for the year represents an improvement over the 3.0% generated last year in an
environment characterized by rising interest rates.
Return by asset class
Years ended May 31
2007 2006 (restated)
Average Weight Return Contribution Average Weight Return Contribution
assets under assets under
managemeNT management
$M % % % $M % % %
Investments
Private securities
and specialty funds 1,716 25.3 9.9 2.6 1,578 25.4 2.8 0.7
Listed securities 736 10.9 10.4 1. 1 639 10.3 21.6 2.3
Other investments
Fixed-income securities 3,186 47.0 4.4 2.1 3,036 49.0 3.0 1.5
Sector-based shares 2
and other investments 3 1,141 16.8 17.8 3.0 950 15.3 20.0 3.1
6,779 100.0 8.8 8.8 6,203 100.0 7.6 7.6
2. Sectors are materials, energy, consumer staples and utilities.
3. Other investments include funds of hedge funds and the portfolio of high-revenue securities (including preferred shares, high-dividend shares, and income trust units).
20 2007 ANNUAL REPORTA N A LY S I S O F C A S H F L O W S , B A L A N C E S H E E T ,
AND OFF-BAL ANCE SHEET ITEMS
Cash flows from operating and financing activities totalled $355 million in 2006-2007, down from the $433 million recorded a year
earlier. This decrease stems primarily from the combined effect of a reduction in shares issued to $571 million during the year to comply
with the lower contribution limit in effect, and an increase in shares redeemed, which reached $400 million for the year, on a cash flow
basis. In 2005-2006, shares issued and shares redeemed totalled $614 million and $324 million, respectively.
The Fund’s direct investments in partner companies reached $668 million for the year, representing an increase over last year’s record
investments of $643 million. Once again, the investment sector outperformed its historic records and the goals set at the beginning
of the year. Including the regional fund network, investments were made in 145 partner companies, of which 92 were new partners.
The 2006-2007 proceeds from the disinvestment of direct investments amounted to $459 million, a higher amount than the $248 million
recorded the previous year. This increase is largely the result of the sale of our three joint-interests with Hydro-Québec International,
which accounted for $126 million of the disinvestments for the year.
Balance sheet investments increased from $2.7 billion as at May 31, 2006 to $3.1 billion as at May 31, 2007. This increase is the result
not only of net investments made during the year (investments made less disinvestments), but also of the equally important appreciation
recorded by the portfolio over the year.
Canada’s Venture Capital & Private Equity Association (CVCA) proposes classifying private equity investments into three categories:
buyout capital, venture capital and mezzanine capital investments.4 Applying this definition to our $2.3 billion investment portfolio5, at
cost, as at May 31, 2007, 37.8% of the portfolio was invested in buyout capital, 26.6% was invested in venture capital, and mezzanine
capital represented 35.6% of the portfolio.
Breakdown of investment portfolio5
by category (at cost) buyout Capital
As at May 31, 2007 37.8%
Mezzanine capital
35.6%
Venture Capital
26.6%
Other investments increased by some $300 million over the year to reach $4.5 billion as at May 31, 2007. This rise is principally the
result of net cash inflows (share issues less redemptions) as well as interest and dividends earned on Fund assets and the appreciation
of shares resulting from the solid performance of the stock market.
Thus, net assets rose by $632 million to reach $7.2 billion as at May 31, 2007. The net value per outstanding Class A share continued
its rise this year, increasing by $1.62 to $25.36.
4. Based on the classification proposed by the CVCA, a buyout capital investment is made by purchasing shares of an established private or public company looking to grow organically or
through acquisition. A venture capital investment is made by purchasing shares of a company that is generally unlisted and is in the start-up or the early development stage. Mezzanine
capital consists of subordinated debt or preferred shares with or without a variable portion in equity warrants.
5. On a fund disbursement basis, excluding investments in real estate funds and in listed shares acquired on the secondary market.
2007 ANNUAL REPORT 21Change in net value per Class A share
Years ended May 31
(in dollars)
2007 2006 (restated)
Net value at beginning 23.74 22.41
Change in accounting policy (0.04) –
Increase due to operations
Interest and dividends 0.87 0.85
Gains on investments and other investments 0.61 0.04
Change in unrealized appreciation or depreciation 0.60 0.82
Operating expenses (0.33) (0.33)
Income and capital taxes (0.07) 1.68 (0.03) 1.35
Variance due to share issues and redemptions (0.02) (0.02)
Net value at end 25.36 23.74
VALUAT I O N o f Finan c ial Assets
Investments and other investments are recorded on the balance sheet at their fair value. The fair value of other investments was
established as at May 31, 2007 based on the closing bid price on the stock and bond markets, or, in the case of unlisted financial
instruments, by professional valuators using appropriate and acknowledged pricing models.
With regards to investments, listed securities were also valued based on their bid price at market close as at May 31, 2007. The value of
private securities and listed securities for which the market price exceptionnally is not representative of their fair value, was established
using recognized valuation techniques by specialized business valuators who possess the necessary expertise and experience. These
valuation techniques are based on international guidelines that ensure that fair value6 is established in a reliable manner. The specialized
valuators report to the Executive Vice-President, Finance, and follow a structured process comprising several verification and validation
steps to ensure the quality, uniformity and integrity of the work performed and of the resulting fair value.
The fair value of our investments in specialty funds is established based on the latest audited financial statements of those funds.
The fair value may be adjusted by the specialized valuators employed by the Fund to incorporate more recently available
financial information.
ACCO U N T I N G PO L I C I ES
New accounting standards issued by the Canadian Institute of Chartered Accounts (CICA) resulted in changes to the Fund’s accounting
policies, as described in Note 3 of the financial statements.
Effective June 1, 2006, the Fund modified the valuation basis of financial instruments to use the bid price instead of the closing price.
The effect of this change was a reduction of $11.5 million of the investment and other investment portfolio and net assets. This change
does not affect the comparison between the years ended May 31, 2006 and May 31, 2007, even if the comparative figures are not
restated, as the impact on net earnings and earnings per share for those years and net value per share as at May 31, 2007 is not material.
The Fund early adopted the new standards published by the CICA in March 2007 regarding investment companies. Interests in
investment companies are therefore presented at the fair value under Investments and are no longer consolidated. For comparability
purposes, the previous year was restated. This change did not affect net earnings and earnings per share for the years ended
May 31, 2006 and 2007, or net value per share as at May 31, 2006 and 2007.
The Fund does not anticipate adopting any new accounting policies that would materially affect next year’s net earnings or the value
of its net assets as at May 31, 2008.
CONTRIBUTION TO QUÉBEC’S
ECONOMIC DEVELOPMENT
The economy did not improve much in 2006-2007, especially for companies in the manufacturing sector. In fact, Québec’s small and
medium-sized businesses (“SMEs”) must reposition themselves and streamline their operations to remain competitive in the face of
a weaker U.S. dollar and U.S. demand, continuously climbing raw material and energy costs, and ever present foreign competition.
6. Using fair value is a best practice recognized by venture capital firms and private equity funds. Fair value is defined as the amount of the consideration that would be agreed upon in an
arm’s length transaction between knowledgeable, willing parties who are under no compulsion to act.
22 2007 ANNUAL REPORTOn the other hand, a wave of mergers and acquisitions is happening across the world, fuelled by money from certain large funds
that specialize in these activities. These funds often initiate these transactions and are playing an increasingly important role
in the financial market. Some of our best companies are at risk of being acquired unless they can manage to become acquirers.
The Fund remains sensitive to such structural changes of our economy, which strongly affect companies in the manufacturing sector.
This sensitivity significantly contributed to generating record investments of $668 million in 2006-2007. Of that amount, 47%, or
$314 million, was used to support the development of our Québec-based SMEs in the manufacturing sector.
The Fund is always concerned with supporting entrepreneurial efforts in Québec and continues to support companies in the
start-up phase with $119 million invested in 2006-2007, for a total of more than $550 million invested over the last four years.
The support provided by the Fund to funds specializing in start-ups significantly increased access to financing sources and expertise
for our Québec-based entrepreneurs.
In the context of its strategic investment program7, the Fund intends to inject new momentum into our larger SMEs by supporting
the major players in their market or those operating in sectors that are strategic for our economy, or those wishing to improve their
productivity. A $75 million investment was authorized in April 2007 to support the officers of Van Houtte Inc. in the transaction to
privatize the company and allow it to implement an expansion strategy that would encourage job preservation and creation in Québec.
In addition, a new investment of $20 million allowed the privatization of Les Industries Spectra Premium Inc., an automobile parts
manufacturer. Its acquisition by members of management assured the preservation of these jobs in Québec, and also helped the
company implement a strategy to increase its competitive position in a sector with fierce international competition.
Over the years the Fund’s investments under the Policy for investment outside Québec8 have had large economic benefits for Québec,
in compliance with the requirements of the Policy. In terms of investments in companies impacting on the economy, during fiscal
2006-2007 the Fund spent an amount equivalent to CA$88 million through five investments that have sizeable and immediate economic
benefits for Québec. The Fund also sold its interest in three companies jointly held with Hydro-Québec International this year. These
investments generated notable economic spin-offs for Québec while contributing to the Fund’s return.
In fiscal 2005-2006, the Policy for investment outside Québec was amended to include two new categories of eligible foreign
investments: investments in certain private funds outside Québec that invest in Québec and investments in large-scale projects
in Québec executed by certain companies outside Québec.
The Fund’s investments in foreign private funds are conditional on reinvestment in Québec companies of an amount at least equal
to the amount invested by the Fund. The foreign private funds should also provide their partner companies specific expertise and an
international business network necessary for their development. During the past year the Fund has invested an amount equivalent
to CA$57 million in four private funds outside Québec and anticipates that each of these funds, in addition to supporting the Fund’s
efforts in developing the Québec economy, will invest in Québec companies at least the same amount as they received.
In terms of the second new category of eligible investments, the Fund has not yet made an investment in companies outside Québec
that execute large-scale projects in Québec.
T h e F u n d N e t wo rk
Since its inception in 1983, the Fund has built a solid investment network that provides entrepreneurs who follow their ambitions with
patient capital based on their needs. A veritable business hub brimming with ideas, talent and knowledge, this network offers the Fund’s
partner companies the opportunity to share common concerns with other SMEs, learn from past experiences and forge new business ties.
The Fund’s investment network revolves around four levels of investment:
• The Solidarity Fund QFL offers $2 million and up for large companies.
• The 16 Regional Solidarity Funds QFL offer $100,000 to $2 million per company to meet the needs of Québec’s regional companies.
The Equity Loan and the Growth Loan are the two main products offered by the regional funds.
7. The 2003-2004 Québec budget allowed the Fund the opportunity to move forward with strategic investments in large Québec companies with assets under $500 million or equity
less than $200 million.
8. Since 1998, the Fund has been authorized by the Québec Minister of Finance to invest outside Québec provided certain clearly defined conditions are met, particularly with regards
to economic spin-offs. The main group of eligible investments are companies impacting on the economy, private funds and large-scale investment projects (expansion financing,
modernization, productivity improvement).
2007 ANNUAL REPORT 23You can also read