DESIGN PROGRESS BY 2016 - Imperial Equities
←
→
Page content transcription
If your browser does not render page correctly, please read the page content below

PROGRESS BY
DESIGN

        2016
        ANNUAL REPORT

TABLE OF CONTENTS

1    2016 PRESIDENT’S REPORT

7    MANAGEMENT’S DISCUSSION & ANALYSIS

15   PERFORMANCE HIGHLIGHTS

37   PROPERTY PERFORMANCE

61   FINANCIAL STATEMENTS

93   BOARD OF DIRECTORS

95   CONTACT INFORMATION

2016
PRESIDENT’S REPORT

1   ANNUAL REPORT 20 1 6
Accomplishing goals and attaining                                        producing properties remain relatively high. Although current
                                                                         activity in the oil and gas sector has negatively impacted certain
milestones are the driving objectives                                    real estate submarkets throughout Alberta, especially Calgary’s
of the management team behind the                                        office market, Statistics Canada has reported that 70% of Alberta
operations at Imperial Equities.                                         building permits issued in Q2, 2016 were in Edmonton. The
                                                                         value attributed to these permits is over $1 billion dollars and
                                                                         with approximately $3 billion in construction projects currently in
Our quest to build a strong public enterprise with a collection          progress, Edmonton seems to be holding its own.
of industrial and commercial properties throughout Alberta and
Canada has become a reality and more importantly, the backbone           Other geographical areas in the Province have not fared as well
of our organization. Imperial has been resolute in ensuring the          as Edmonton. Fort McMurray which is highly dependent on the
quality of its assets are superior and the scale of its tenant base      oil industry is especially experiencing the effects of low oil prices.
being primarily international, national or large regional. Our           During the past decade, Fort McMurray’s industrial lease rates
steadfast resolution to stay committed to these principals has           were some of the highest in Canada and vacancies were rare. The
certainly allowed us to forge forward on a solid foundation. The         demand for raw industrial properties was unprecedented and the
Imperial philosophy of building and maintaining relationships with its   supply was almost nonexistent consequently creating a perfect
tenants has also been fundamental to our growth. By continuously         storm for escalating lease rates. During the past several quarters,
developing new relationships and strengthening existing ones             industrial vacancies are prevalent, real estate prices seemed to
with a business ethic that has come to be known and trusted is           have stabilized and the exorbitant lease rates that prevailed have
largely why our industrial real estate portfolio is 100% occupied, an    begun to marginally decline. The two developed properties in
impressive record by all accounts.                                       Fort McMurray owned by Imperial Equities have long term lease
                                                                         contracts in place. Our tenants are strong multinational corporations
For the past eighteen years Imperial Equities has grown into a very      that are not necessarily dependent on the oil industry and are
well recognized corporate entity throughout Alberta. Year after year     expected to honor their lease commitments with relative ease.
we have continually grown our asset base to over $171 million and
with projects currently under consideration we are likely to surpass     A preferred type of acquisition for Imperial is a single tenant
the $200 million mark by Q4, 2017. Imperial’s strong work ethic          building that is occupied by the current owner who will sell the
and a genuine focus on developing a respected, Canadian based,           property and remain as a tenant. This type of transaction known
public real estate company can best be described as Progress by          as a “sale leaseback” was presented to Imperial in Q3, 2016.
Design.                                                                  The property located in central south Edmonton has a 75,000 ft2
                                                                         building situated on 6.8 acres of prime industrial land with excellent
Our pursuit to grow a large portfolio of industrial real estate          exposure to major thoroughfares in south Edmonton. We completed
properties has us exploring throughout Canada. Management has            our due diligence and negotiated a long-term lease agreement
been very active in searching for revenue producing properties that      at prevailing market rates. The transaction agreement between
fit our criteria. Properties in markets throughout Alberta as well as    Imperial and Scotland based Weir Group PLC was in the amount of
cities in other parts of Canada such as Vancouver, Winnipeg and          $12,250,000.00 and closed on September 30, 2016. The property
Toronto have been vetted and remain under close consideration.           will continue to serve as headquarters for Weir Seaboard Canada
It is interesting to note, that although there is much rhetoric about    a manufacturer of cost-effective wellhead products and pressure
the current state of Alberta’s economy that would suggest a buyer’s      control equipment designed for the oil and gas industry around
market, that is not necessarily the case. Many of the current            the globe. This acquisition is characteristic of the ideal transaction
sales statistics in Edmonton relating to industrial properties would     whereby Imperial’s tenant base remains largely international in
indicate that prices continue to hold firm. Industrial rental rates in   scope.
Edmonton have traditionally been high compared to markets such
as Vancouver and Toronto and despite the negative outlook that           Our willingness to grow our real estate portfolio can also be
low oil prices have triggered throughout Alberta, industrial lease       demonstrated by the proposed developments within our own
rates in Edmonton have remained relatively stable.                       Coppertone Industrial Common. In 2004, Imperial created this
                                                                         industrial development that is situated within the Mitchell Industrial
The greater Edmonton region is the de facto location of the service      district, a most desirable industrial area in Edmonton. The common
sector for the oil and gas industry in Alberta. Specific industrial      theme among the newly constructed buildings is the copper
areas such as south Edmonton (Nisku) has been affected by the            cladding and curtain wall finishes that make these industrial
dramatic decline in the price of oil and ironically, despite Nisku’s     buildings superior to any other buildings in the area. Coppertone
reported 20% industrial vacancy rate, asking prices for revenue          I and Coppertone II have been completed and are fully occupied

                                                                                                            ANNUAL REPORT 20 1 6               2
“             IMPERIAL’S STRONG WORK ETHIC AND
                                                              A GENUINE FOCUS ON DEVELOPING A
                                                              RESPECTED, CANADIAN BASED, PUBLIC

                                                                                                                                                “
                                                              REAL ESTATE COMPANY CAN BEST BE
                                                              DESCRIBED AS PROGRESS BY DESIGN.

with international tenants. The planning stages of Coppertone III        of the Coppertone Industrial Common. The Property is situated
are now completed and a development permit has been issued.              on 2.82 acres of prime commercial/industrial real estate with
Construction of a new copper cladded structure will likely begin         considerable frontage along the highly utilized 149 Street in
in Q2, 2017 and is expected to be completed in Q1, 2018. This            northwest Edmonton. Built in 1999, the 47,652 ft2 building is an
13,000 ft2 structure will be built on a 1.25 acre site adjacent to       aesthetically pleasing multi tenanted building which is fully occupied
our Coppertone II property. Although we have seldom constructed          with long term tenants including the government of Canada. It has
buildings without a prearranged tenant, this one will likely be          excellent curb appeal and superb exposure to one of Edmonton’s
spoken for prior to its completion. Its size, appearance, layout         most travelled thoroughfares. The location of the Property is
and location all contribute to making it the most desirable type of      strategic to Imperial’s long term goal of creating an attractive and
property in Edmonton!                                                    functional industrial area in northwest Edmonton. The property
                                                                         borders the most easterly part of Imperial’s “Coppertone Industrial
Over the past several months Management has been considering             Common” which has become one of northwest Edmonton’s desired
the idea of building three more smaller buildings on the 2.24            locations. The Property will certainly be a very appealing addition
acre site in our Coppertone Industrial Common. The buildings             to Imperial’s growing industrial and commercial real estate portfolio
would be constructed of precast concrete and would incorporate           and will soon be renamed to Coppertone VII. The $9.8 million
the copper cladding and curtain wall features that are present in        purchase price has been agreed upon and closing will take place in
all our Coppertone buildings. Preliminary designs are complete           Q2, 2017.
and budget costs are currently being analyzed. The size of each
building being proposed is very desirable for a small to medium          The ability for a company to finance its real estate assets at the
sized distributor or contractor. The potential to lease out any of       lowest rates possible is as prudent as negotiating the highest priced
these three buildings will likely be relatively easy given the current   lease rate. Interest rates in Canada have fluctuated dramatically
demand in Edmonton for this type of product. Construction would          over the past three decades and lately, reduced to the lowest
take place on a strata title plan which would afford the Company an      levels our company has ever experienced. Despite some minor
opportunity to lease, finance or sell each building individually.        fluctuations, for every quarter in each year that we’ve been
                                                                         reporting our weighted average interest rate, Imperial’s weighted
Prior to year-end we also completed the due diligence on a property      average rates have been declining. During Q3 we renewed a
located near our Coppertone Industrial Common. The property              large mortgage that for the past five years had carried a rate of
consists of a relatively new 7,266 ft2 building on 1.84 acres of fully   4.13% per annum. The new five-year renewal rate was set at
serviced land. The building has a generous amount of energized           2.88%, which once again had established a new record low for
parking stalls as well as a completely paved and fenced yard. The        our weighted average rates. At September 30, 2016, we placed
purchase price is $2,050,000.00 and have closed the transaction          a new five-year fixed rate mortgage on our newest acquisition,
post Q4, 2016. The current owner has vacated the building and            the Weir Seaboard Building. The 2.47% interest rate obtained on
Imperial has begun marketing the property to prospective tenants.        this mortgage was the lowest achieved in our corporate history.
Because of the proximity to our Coppertone Industrial Common,            Imperial’s mortgage liabilities now have a weighted average interest
this acquisition will be a good addition to the collection of land       rate of 3.10% and is expected to be further reduced as current
and buildings we already own in the area and will be renamed             higher priced mortgages mature. Our negotiation leverage with
Coppertone VIII.                                                         lenders and financial institutions is a testament to their confidence
                                                                         in our management and financial strength.
Currently in Edmonton, Imperial has an unconditional agreement
to purchase another property that is adjacent to the east boundary       Imperial’s industrial real estate portfolio now consists of hundreds

 3   ANNUAL REPORT 20 1 6
of thousands of leasable square feet throughout Alberta.                   natural disaster. It has been estimated by the Insurance Bureau
Maintaining a standard worthy of being included in the portfolio           of Canada (IBC) that the costs associated with this giant forest
requires continuous care and upkeep of each property. Our asset            fire that was dubbed ‘the beast”, are expected to be in excess of 4
management team is continually vigilant of potential maintenance           billion dollars.
problems and recommends the appropriate corrective actions
when identified. This process serves to ensure that our properties         Throughout the ordeal, we attempted to get any information
remain in good condition with contented tenants. Ensuring that our         regarding the condition of our properties. There was absolutely
properties are fully leased and generating revenue is paramount.           no civilian access and the Fort McMurray airport was shut down.
                                                                           Notwithstanding the challenges of receiving information, any
It is no secret that Alberta’s economy is largely dependent on             reports we were able to get indicated that the Imperial properties
the oil and gas sector and northeastern Alberta and the Fort               were intact and had likely only suffered some smoke damage.
McMurray region in particular is the major oil producing region in
all of Canada. In late spring of this year and just as some optimism       At the first opportunity, our property management team inspected
in the industry was beginning to set in, a major natural disaster          the properties and determined that with the exception of some
struck the region thus further jeopardizing the multi-billion dollar oil   smoke damage to our Strongco building, our properties had
industry. What started out as a rogue forest fire soon turned into         survived the wildfires essentially unscathed. Our tenants have
a raging wildfire that ravaged the city of Fort McMurray, Alberta          resumed their respective commercial operations and all lease
and threatened not only human life and property, but the very life         obligations to Imperial Equities have continued unabated.
blood of its economy. As the entire city of 80,000 people was being        Preceding the wildfires, Imperial agreed to a month to month land
evacuated, first responders were primarily focused on ensuring             lease arrangement with Hertz Equipment Rentals to lease them
the safety of the evacuees and then protecting the homes and               the 2 acres of raw land. The lease commencement date was set
properties throughout the community. Miraculously there was no             for May 1, 2016, the very day the fire entered Fort McMurray and
loss of life attributed directly to the wildfires.                         triggered the evacuation. Upon receiving approval for businesses to
                                                                           return to Fort McMurray, Hertz began utilizing the lands for outdoor
On May 1, 2016, the wildfire began southwest of Fort McMurray              storage of their equipment.
and by May 3rd it swept through the community destroying
approximately 2,400 homes and buildings and forcing the largest            A major development this year is the sale of our wholly owned
wildfire evacuation in Alberta history. It continued to spread across      pharmaceutical distribution division, Imperial Distributors Canada
northern Alberta and into Saskatchewan consuming forested areas            (IDCI). We grew IDCI from a small startup in 2006 to a full line
and impacting Athabasca oil sands operations. The fire spread              distributor and a major player in the pharmaceutical supply chain
across approximately 590,000 hectares (1,500,000 acres) before it          throughout Canada. Despite fierce competition within the industry,
was declared to be under control on July 5, 2016. It has turned out        IDCI was able to eke out a niche that no competitor was able to
to be the costliest natural disaster in Canadian history.                  replicate. Management needed a competitive advantage and was
                                                                           able to identify a strategy and implement it. Annual revenues within
By June 10, 2016, more than one month after the fires started,             IDCI which were just over $1 million in 2006 and grew year after
evacuees began to return to Fort McMurray to begin the process             year to close out at over $75 million.
of rebuilding the community. The task of rebuilding the destroyed
homes and properties as well as restoring the internal economy             The prices of pharmaceuticals throughout Canada vary dramatically
began very quickly. Insurance companies and contractors                    from province to province. It is truly amazing that in this
scrambled to assess the damages sustained by this massive                  technological and knowledge based age we still haven’t found a

                                                                                                             ANNUAL REPORT 20 1 6               4
method nor the political will to have uniform pricing throughout our headline “TOP 1000, the good, the bad and the disastrous”.
country. This inconsistency in pricing creates a major challenge for Inside, the article listed the 1000 largest publicly traded Canadian
a distributor with only one distribution center in Alberta. Sales to corporations and once again the Canadian chartered banks lead
customers beyond the boundaries of the province would mean the the way. In the case of Imperial Equities, the most recent fiscal year
segregation of product in our warehouse based on each province’s would be September 30, 2015 and remarkably but not surprising,
provincial formulary pricing. Expanding IDCI with a distribution Imperial Equities is ranked number 312. This is the fifth straight
center in another province made sense and expanding into British year that Imperial Equities has been included in the ranking and
Columbia’s lower mainland made enormous sense. has shown strength each year. An outstanding achievement from
the previous year where we were ranked 382 but most flattering
Imperial accepted an offer to sell its interests in IDCI to a group with knowing that just five years ago, Imperial was ranked number 523.
ties to a British Columbia based pharmaceutical distributor. The Being included among Canada’s most successful corporations is
total purchase price had an aggregate value of approximately $10 in itself quite an accomplishment and a proud achievement for a
million which included all shares of IDCI, its inventory, receivables, relatively young company to realize such a standing!
payables and existing debt. The share sale which closed on
December 31, 2015 will have IDCI continue with its operations in From its inception Imperial Equities has been a caring corporate
Alberta and expand into the lower mainland. With this expansion citizen. Backed by a strong belief in supporting the community
IDCI would now be able to efficiently and economically service its through health care, sports, arts and general people initiatives,
customer base throughout Alberta and British Columbia. These Imperial has become a leader in charitable giving. Throughout this
two most westerly Canadian provinces represent almost one third year, we donated more than $70,000 to 11 different charities in the
of Canada’s population and provided that the new management Alberta. With so many organizations doing so much great work,
maintains its competitive advantages, IDCI should continue to determining to who and when to place our support has become
flourish. increasingly difficult. Placing an emphasis on “people wellness” has
certainly been a path we’ve followed and will continue to do so.
The thought process with regard to the disposition of IDCI was
treated no differently than we would with any of our real estate As we look ahead to 2017 we are encouraged by the possibilities
assets. Imperial has always subscribed to the belief that there that may exist for Imperial Equities. Economic downturns in certain
comes a time with every property when its potential is maximized sectors will likely create opportunities in other sectors. With such
and the disposition of the asset would be beneficial to the a low interest rate environment and an encouraging economic
Company. The M & D Drafting Building was acquired by Imperial outlook, we are eagerly looking forward to 2017 with vigor and
in 2012 with the intent to build equity in the property. The 1.24 optimism.
acre property situated along 76 Avenue in Edmonton’s south east
industrial corridor comprises a newer single tenant, purpose built The enthusiasm and determination within management and staff
office building. This office property which has been impeccably at Imperial Equities will continue to drive revenues up quarter after
maintained, is the only office property in Imperial’s portfolio. In Q3 quarter and propel our Company to greater heights. We remain
Management completed its negotiations with the existing tenant focused at the task at hand and as always, we would like to thank
and Imperial Equities Inc. MD&A as at December 13, 2016 pg. 6 our shareholders for their ongoing support and do invite you to
signed a new long term lease agreement. Although not actively contact any of the directors with comments, concerns or investment
marketed and given that the property was outside of Imperial’s opportunities. Additional information on our Company can be
“industrial” focus, Management deemed its disposition to be viewed on line at our website www.imperialequities.com or
beneficial. An unsolicited offer to sell the property was accepted www.sedar.com.
and the sale was completed in Q4, 2016.
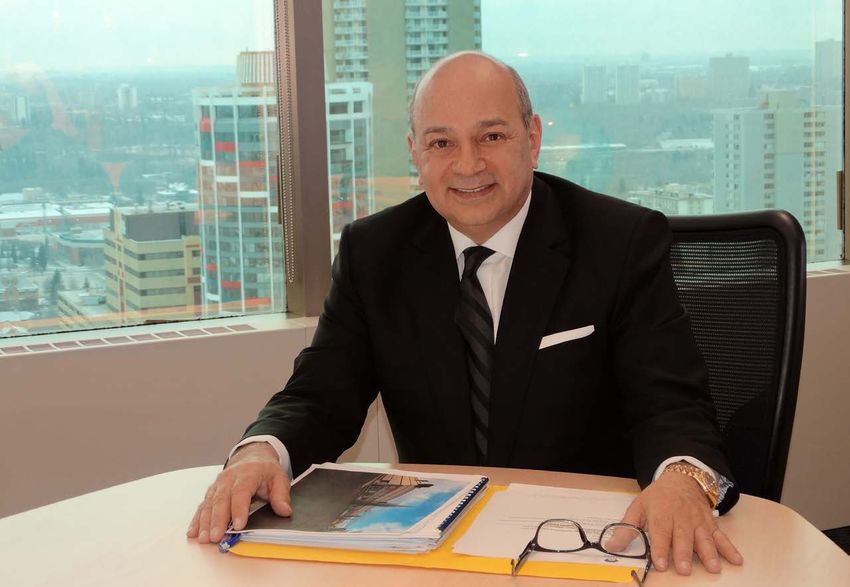
Sincerely,
The ability to gauge the success of a company by comparing it
to its rivals is very exciting and also quite motivating. The Globe
and Mail publishes the Report on Business magazine that delivers
insightful content through stories behind market moves, industry
developments and emerging business opportunities. Once a year
it also publishes a ranking of Canada’s top 1000 public companies
according to their after-tax profits in their most recent fiscal year. Sine Chadi
This year the cover of a recent issue had the attention getting CEO & Chairman of the Board
5 ANNUAL REPORT 20 1 6
YEAR AFTER YEAR WE HAVE CONTINUALLY
GROWN OUR ASSET BASE TO OVER
$171 MILLION AND WITH PROJECTS
CURRENTLY UNDER CONSIDERATION
WE ARE LIKELY TO SURPASS THE $200
MILLION MARK BY Q4, 2017.

                            ANNUAL REPORT 20 1 6   6
MANAGEMENT’S DISCUSSION & ANALYSIS
for the year
ending September 30, 2016
7 ANNUAL REPORT 20 1 6AS AT DECEMBER 13, 2016 ADDITIONAL NON-IFRS MEASURES
The following Management’s Discussion and Analysis Throughout the MD&A, management will use measures
(“MD&A”) is intended to provide readers with an explanation of the that may include Adjusted EBITDA, (income from operations before
performance of Imperial Equities Inc. (“Imperial” or the “Company” interest, taxes, depreciation and amortization, valuation gains and
or “Imperial Equities”) and its subsidiaries. This MD&A should straight-line rental revenue) and NOI (net operating income from
be read in conjunction with the audited consolidated financial properties which includes property revenue less direct property
statements for the fiscal year ended September 30, 2016 and the operating expenses and excludes non-cash and extraordinary
related notes. Imperial Equities Inc. trades on the TSX Venture items, administrative expenses, amortization, valuation gains or
Exchange under the symbol “IEI’. Additional information on the losses, gains or losses on sales of investment property, stock
Company may be obtained by visiting www.sedar.com. based compensation, interest and income taxes). Different issuers
may use the same term(s) to refer to different calculations or
may vary the definitions of a particular term from one period to
RESPONSIBILITY OF MANAGEMENT another period. Securities regulators require that companies
AND THE BOARD OF DIRECTORS caution readers that earnings and other measures adjusted to a
basis other than IFRS do not have standardized meanings and
Management is responsible for the information disclosed are unlikely to be comparable to similar measures used by other
in the MD&A and is also responsible to ensure that appropriate companies. Management believes its use of Adjusted EBITDA
procedures and controls exist internally that will provide reasonable and NOI provides the shareholders and prospective investors with
assurance regarding the reliability of the Company’s financial an additional performance measure to show the cash flow from
reporting and its compliance with International Financial Reporting operations that is available to finance debt and further growth of the
Standards. In addition, the Company’s Audit Committee and Board Company. A detail of the calculation and a further description can
of Directors provide an oversight role with respect to all public be found in this MD&A.
financial disclosures by the Company and have reviewed and
approved this MD&A and the accompanying consolidated financial FORWARD-LOOKING INFORMATION
statements.
In our report to shareholders, management may talk about
BUSINESS OVERVIEW the current economy and express opinions on future interest rates
and capitalization rates that we might experience or speculate on
Imperial Equities Inc. (“Imperial” or “the Company”) is an future market conditions. This forward-looking information is based
Edmonton, Alberta based business with a focus on the acquisition, on management’s current assessment of market conditions based
development, and redevelopment of commercial and industrial on their expertise as well as the opinions of other professionals in
properties in its targeted Edmonton and Alberta markets. The this industry. While management may consider these statements to
Company’s common shares are traded on the TSX Venture be reasonably optimistic and favorable, the opinions and estimates
Exchange under the symbol “IEI”. of future trends are subject to risk and uncertainties. Readers are
encouraged to read the risk factors identified in Note 21 of our 2016
Since operations began in 1998, Imperial Equities has achieved consolidated financial statements and this MD&A. Any forward-
solid growth quarter after quarter for the past 18 years. In 2006 looking statements in our report should not be relied upon as facts,
Imperial acquired a pharmaceutical distribution business which as actual results may differ from estimates.
it renamed Imperial Distributors Canada Inc. This business
acquisition diversified Imperial’s operating activities and split
the focus of the Company into two very different business
environments. After nine years of building this division and
achieving record sales each quarter, the Board of Imperial
accepted an offer to sell the pharmaceutical company to a British
Columbia pharmaceutical distributor looking to expand. The sale
was completed in Q1, 2016.
ANNUAL REPORT 20 1 6 8DISCONTINUED OPERATIONS
MATERIAL CHANGE
PHARMACEUTICALS
Imperial Distributors Canada Inc. (“IDCI”)
At December 31, 2015, Imperial Equities Inc. sold its interest At December 31, 2015, the Company closed the sale agreement for
in Imperial Distributors Canada Inc. The discontinued operations a transaction value of approximately $10,000,000 which included
at December 31, 2015 consist of the operations of IDCI which $1,500,000 for all the issued and outstanding shares of IDCI and
was previously considered an identifiable operating segment of the assumption of all IDCI’s liabilities which shall be paid out within
the Company. IDCI was a wholly owned subsidiary that allowed 90 days of the closing date. The IDCI liabilities include all trade
the Company to diversify its core business to include the sale and payables, bank lines of credit and the Company shareholder loan
distribution of pharmaceuticals to institutional and retail customers in the amount of $2,761,212. The shareholder loan amount was
throughout Canada. The Company acquired IDCI in 2006 which at received in Q2 2016 and the line of credit was paid out in Q3 2016.
the time had total annual sales of $1.1 million. With a trained and The Company is carrying a non-interesting bearing loan receivable
cohesive team of management and operations personnel, IDCI of $1,000,000 less a present value discount of $43,250 at the
positioned itself as a valued member of the pharmaceutical supply sale date. Payment of the loan receivable shall be made in two
chain, building its customer base throughout Canada. Management instalments of $500,000 each on the first and second anniversary
grew the business year over year and by September 30, 2015 had of the sale date. The sale is subject to certain escrow conditions
achieved annual sales of $74 million. and contemplates all aspects of the operations of IDCI to remain as
a going concern.
Over the past several years, competition for market share within
the pharmaceutical distribution industry has been fierce which Going forward, the Management of Imperial Equities is excited to
has created a downward effect on profit margins. There has been focus on growth in the real estate sector and operate under one
a considerable amount of consolidation within the industry to industry segment. Management believes there are viable real
counter the effects of lower margins and to remain competitive. estate prospects in the current market and has taken steps to
The purchaser is affiliated with a Vancouver based pharmaceutical position the Company to take advantage of all opportunities as they
distribution company servicing the British Columbia market and the become available.
acquisition of IDCI will greatly enhance their ability to service an
expanded customer base throughout western Canada.
9 ANNUAL REPORT 20 1 6STRATEGIC DIRECTION
Imperial’s Board of Directors along with Management are focused on the real estate market throughout Alberta and Canada are
committed to continue building a strong portfolio of investment properties.
The fundamental strategic goals that drive our company are:
Acquire industrial Acquire fully occupied, Proper due diligence
properties in the most single tenanted industrial on all acquisitions and
sought after areas for properties with long term evaluating the strength
capital appreciation lease agreements and of the tenant(s) before
rental rates commensurate entering into contracts
with the location with international, national
or large regional tenants.
Finance acquisitions aintain our assets to
M
with the lowest cost of high standards including
Maximize the revenue
capital available structural, mechanical and
potential of each
asset in its region cosmetic to showcase
our existing properties to
Achieve a defined rate prospective new tenants
of return on each asset or purchasers
ispose of older assets
D
Preventative maintenance Charitable giving in the
that may have reached
on the properties to communities where the
their maximum earning
reduce operating costs Company does business
potential to reduce
and to maximize longevity
the overall age of the
of the buildings
properties in the portfolio
Imperial’s team of professionals are dedicated and motivated to grow our real estate portfolio and earn value for our
shareholders. With a relatively small share base for a real estate company of our size, Management has no immediate plans to
issue new shares which would dilute an investor’s holdings. We believe in building value in those shares through a commitment
to acquire and develop high quality properties and gain capital appreciation to benefit our shareholders. As part of our strategy,
we would consider the disposition of properties where the Company believes that we have maximized their potential and its
disposition would be beneficial to the Company.
ANNUAL REPORT 20 1 6 10KEY PERFORMANCE DRIVERS
Imperial Equities continues to engage a dedicated team of select tenants that we feel are best able to weather an economic
professionals to manage and oversee the business activities. The downturn. This assessment will include the size of the tenant, the
CEO and CFO have been with the Company since going public 18 length of time they have been in business, their operations and
years ago. There is a strong Board of Directors with significant real exposure to the oil and gas industry; all of these factors will be
estate experience to guide decisions surrounding strategic direction a part in our evaluation of the strength of their lease covenant.
and achieving the goals and objectives of the Company. This Another external driver to our success is interest rates related
dedication and professional experience of Imperial’s management to financing of our properties. The investment properties are
team has helped the Company achieve positive earnings every financed with conventional mortgages that leave the Company
quarter the Company has been in business. with an exposure to possible increases in interest rates, affecting
our operating income and cash flow. We have been fortunate
Management monitors the success of Imperial by measuring how to consistently have lower weighted average interest rates each
well we are meeting our strategic directives. External performance quarter since the inception of the Company. For the foreseeable
drivers that affect our business include the overall economic future, the Company does not consider rising interest rates to have
health of industries operating in the province of Alberta. Alberta is a significant impact on the operating cash flows.
reliant on the oil industry to a large degree and we are careful to
Internal performance drivers that measure our strategic objectives include the following:
Maximizing the cash flow from Selecting mortgage terms that
operations to ensure funding provide a low cost of capital and
for growth opportunities utilizing debt leverage opportunities
Monitoring the quality of tenants in Maintain high occupancy rates
the portfolio to reduce the risk of to recover carrying costs of
defaults on leases the properties
Ensure that maintenance on the properties is done to high
standards involving monitoring the quality of work provided by
our business partners while ensuring the costs are competitive
Maximize the revenue per
property and secure long Minimize higher rate short term
lease terms to reduce the borrowings to reduce the cost
turnover of tenants of capital
11 ANNUAL REPORT 20 1 6SUMMARY OF PERFORMANCE INDICATORS
FOR THE YEARS ENDING SEPTEMBER 30
2016 2015
Number of leasable properties 17 17
Total leasable square feet 629,757 569,027
Occupancy year to date 99.3% 100%
Average lease term to maturity in years 4.56 5.56
Total square footage of leases up for renewal
In the next twelve months 103,662 14,126
% operating cost recoveries to operating costs 82% 86%
Weighted average interest rates on mortgages 3.10% 3.56%
Other financing NIL $2,925,000
Number of properties held for future development 3 4
Total leasable square feet had a net increase of 60,730 square feet in 2016. The Company sold the only property that
was classified as office space which had 14,270 square feet, and acquired a 75,000 square foot industrial building in Edmonton.
There are five leases up for renewal in the next twelve months totalling 103,662 square feet. Typically, the landlord and tenant
will begin to negotiate a renewal of the lease within 180 days of the lease expiry. One lease with 2,396 square feet was up for
renewal at September 30, 2016. The existing tenant is overholding and will likely remain on a month to month basis. There were
two leases renewed during 2016.
AVERAGE ANNUAL LEASE RATES
PER SQUARE FOOT
Increases in the average lease rates for 2016 compared to 2015 are due to rental increases in the
contracted revenue stream.
2016 2015
Edmonton and surrounding area, Alberta $ 10.48 $ 10.07
Red Deer, Alberta* $ 24.19 $ 23.95
Fort Saskatchewan, Alberta* $ 43.77 $ 42.94
Fort McMurray, Alberta $ 46.27 $ 45.65
*Leases include a large land component which skews the average rate per square foot.
ANNUAL REPORT 20 1 6 12LEASE PROFILES
TOTAL SQUARE FEET OF LEASED SPACE
SINGLE TENANT BUILDINGS EXPIRY YEAR MULTI-TENANTED BUILDINGS EXPIRY YEAR
- 2016 4,365 2016
93,254 2017 8,439 2017
16,758 2018 2,431 2018
22,939 2019 32,762 2019
25,580 2020 64,850 2020
33,500 2021 972 2021
95,694 2022 113,819 Weighted Average Remaining
58,393 2023 Terms 3.30 years
43,396 2024
26,400 2026
75,000 2028
25,024 2029
515,938 Weighted Average Remaining
Terms 6.37 years
The risks to the Company when a tenant does not renew a year. Tenants are notified of the review and budgets for the next
lease is to absorb the ongoing operating costs of a vacant space. year are set accordingly.
These costs include property taxes, insurance, utilities and any
maintenance items. If a single tenant building becomes vacant, Weighted average rates on the mortgages have decreased in 2016
additional vacancy costs include mortgage payments, if applicable. compared to 2015 with continued lower interest rates on new and
Management works closely with tenants to ensure retention rates renewed financing from the Company’s lenders. The Company took
remain high, and operating cost recoveries are maximized. advantage of leverage opportunities combined with low rates to
secure additional proceeds upon renewal of some of the mortgages
Operating cost recoveries are budgeted annually and reconciled during the current year. These additional funds were used to repay
every 12 months on a tenant by tenant basis. All the Company’s other financing that carried higher rates of interest.
leases are triple net leases which allow the Landlord to recover
operating costs. Management will decide on large maintenance Land banked for future development is in the west end of
items as to how it will treat the recovery of those costs from the Edmonton. The Company is currently considering a 13,000 square
tenant, so as not to incur hardship on their operations. Sometimes foot building on one parcel of land, and a larger development is
this means allowing the tenant to pay over time. Some leases have being considered for another location nearby. Construction has not
lower management fees than other leases dependent upon the yet begun on either development and the Company has no related
responsibility of performing maintenance remaining with the tenant commitments at this time.
or the landlord. Because of these variations, there will always be
a percentage of operating costs not recovered by the landlord. There are 12.89 acres of vacant land classified as investment
Historical optimal recovery percentages will be in the range of properties held for sale as Management is committed to a disposal
80%-86%. Reviews of operating expense recoveries comparing plan for this property.
budgeted to actual expenditures are done at September 30 each
13 ANNUAL REPORT 20 1 6IMPERIAL’S INDUSTRIAL REAL
ESTATE PORTFOLIO NOW
CONSISTS OF HUNDREDS OF
THOUSANDS OF LEASABLE
SQUARE FEET THROUGHOUT
ALBERTA.
ANNUAL REPORT 20 1 6 14PERFORMANCE
HIGHLIGHTS
DURING THE YEAR
Earnings per share, generated $.46 The Company sold its
per share from continuing operations
plus $.12 from discontinued operations
pharmaceutical operations
at December 31, 2015 to allow
on total comprehensive income of
management to focus on growth
$5,536,946 (2015-$.69 per share on total
opportunities in real estate.
comprehensive income of $6,646,113).
Real estate properties The Company completed a
sale leaseback agreement New long term
have a 99.3%
with a Scotland based mortgage financing of
occupancy rate
year to date at multi-national company, $16,594,000
September 30, 2016 Weir Group PLC. The 75,000 received in Q1 2016 was
(100% at September square foot building is used to pay out existing
30, 2015). situated on 6.8 acres of prime mortgages and current
industrial property in south debt liabilities.
Edmonton.
15 ANNUAL REPORT 20 1 6The new acquisition at
Two mortgages were September 30, 2016 added
renewed this year at lower an additional $8,900,000
rates of interest. of financing at the lowest
interest rate ever realized in
the Company.
The weighted average rate Net valuation gains
of all the mortgages is at an on investment property
historic low of were $1,135,699 this year;
3.10% primarily the result of increasing
revenues on the properties due
(September 30, 2015 - 3.56%). to contracted lease rates.
The Company’s liquidity
The Company’s total
position improved during
the current year. The quick equity is $8.15 per share at
ratio is 3.32 at September 30, September 30, 2016
2016 (cash, receivables and ($7.54 at September 30, 2015).
payables) compared to 1.23 at
September 30, 2015.
ANNUAL REPORT 20 1 6 16PERFORMANCE RESULTS for the year
RENTAL REVENUE PROPERTY NOI ADJUSTED EBITDA
(Thousands) (Thousands) (Thousands)
9,000 9,000 8,000
8,000 $8.8 8,000 7,000
$8.6 $8.2 $8.3 $7.3
7,000 7,000 6,000 $7.0
6,000 6,000
5,000
5,000 5,000
4,000
4,000 4,000
3,000
3,000 3,000
2,000 2,000 2,000
1,000 1,000 1,000
0 0 0
2015 2016 2015 2016 2015 2016
Property net operating income (“NOI”) for the real estate Income taxes are removed from the earnings because they
segment is defined as net rental income from properties which often include deferred taxes which are non-cash. Removing the
includes property revenue (excluding amortization of tenant interest expense also allows an investor to see the operating cash
inducements) less direct property operating expenses including flows from properties without the influence of how the Company
property taxes, insurance, management fees and maintenance. has financed its properties. When comparing other real estate
Management believes that this is a useful measure of cash companies, the differences in how Companies finance their assets,
available from operations to assess performance of the real estate together with their individual tax situations are taken out of the
portfolio and measure the income generated by properties to equation.
support finance repayments. Commercial property net operating
income, together with capitalization rates applied on a property by NOI and ADJUSTED EBITDA are non-IFRS financial
property basis, is widely used to value investment property in the measures used by most Canadian real estate companies and
real estate industry. should not be considered as an alternative to net income or
comprehensive income, cash flow from operating activities or any
Management is of the opinion that ADJUSTED EBITDA as other measure prescribed under IFRS. This measure does not
calculated below is another useful measure for investors to use have any standardized meaning prescribed by IFRS and therefore
when evaluating the ability of the Company to generate cash to may not be comparable to similar measures presented by other
service interest on debt, and facilitate growth in the Company. companies.
ADJUSTED EBITDA AT SEPTEMBER 30 2016 2015
Net income from continuing operations $ 4,413,983 $ 6,626,366
Add (subtract):
Valuation gains on investment property (1,135,699) (5,018,680)
Straight-line rental revenue (112,541) (251,853)
Interest 2,365,610 2,731,633
Amortization 370,164 319,678
Income taxes 1,397,846 2,582,287
ADJUSTED EBITDA from continuing operations $ 7,299,363 $ 6,989,431
17 ANNUAL REPORT 20 1 6RESULTS OF CONTINUING
OPERATIONS AND CASH FLOWS
For over two years the Company has enjoyed better than 99% occupancy in its properties. There have been no significant changes
in operations for each quarter during 2016 or 2015, except for fluctuations in earnings resulting from the fair valuations of investment
properties.
Net valuation gains (losses) per quarter:
2016
Q1 2016 Q2 2016 Q3 2016 Q4 2016 TOTAL
$367,076 $491,789 ($436,113) $739,947 $1,135,699
2015
Q1 2015 Q2 2015 Q3 2015 Q4 2015 TOTAL
$2,573,336 $1,404,526 ($168,615) $1,209,433 $5,018,680
All other inputs being equal, an increase in property revenue for Income from operations at September 30, 2016 is up over
the ensuing twelve months will have a positive impact on the fair September 30, 2015 with the added benefit of a full year of revenue
values. With continued low interest rates, investors are eager to generated from the Essential Energy building acquired in Q1 of
expand their portfolios creating a healthy, competitive environment 2015.
in which to acquire property which should keep the cap rates
very competitive. During the 2016 reporting period, Management Administrative expenses were $992,405 at September 30, 2016
decided to marginally increase the cap rates on some of the compared to $1,000,718 at September 30, 2015. Non-recurring
properties where the Company believes property values and lease expenses in the prior year included consulting fees that were
rates may decrease slightly; the result of more product coming on offset by an increase in accounting fees this year. Administrative
stream from developers eager to lease up vacant buildings. The expenses include professional fees, accounting fees, wages
net losses at Q3 are the result of small increases in the revenue and benefits, rent, charitable donations, costs associated with
stream which typically cause fair value increases, netted against communications to shareholders, listing fees and other sundry
items capitalized. Capitalized building improvements are typically items. Charitable donations are $71,900 this year compared
performed in the warmer summer months of Q3. The capitalized to $58,500 last year as the Company continues to support the
building improvements generally exceed any incremental fair value community in which it operates. Management has a strong belief
increase as a result of the improvements, and will therefore have in giving back to those initiatives that give their time and energy
the effect of a negative adjustment to the properties’ value, to bring to better enhance the community we live in, as well as the lives of
it to fair value at the reporting date. those less fortunate residing within.
During Q4 2016 the Company leased the only vacant space in the Amortization includes amortization of deferred leasing costs,
portfolio which was vacant for 5 months. The new tenant lease and intangible assets and transaction costs associated with new
revenue stream increased the value of the property in addition to mortgages. Investment property leasing fees charged on the
other property increases where revenue increased. signing of new tenants or on lease renewals are amortized over
the life of the respective leases varying from one to fifteen years.
In the prior year, some of the properties had a large increase in During Q1 2016 the Company fully amortized the intangible
value due to the renewal of leases at higher market rates than the assets that had less than one year remaining in their useful life at
previous leases generated. September 30, 2015. Amortization of transactions costs associated
with financing is higher this year as the Company obtained five new
mortgages and renewed an additional two mortgages this year,
compared to obtaining one new mortgage in the prior year.
ANNUAL REPORT 20 1 6 18FAIR MARKET VALUE of INVESTMENT PROPERTY
(excluding property held for sale) - at September 30
200
150
160.0
Millions
148.6
100 125.7
110.3
101.4
50
-
2012 2013 2014 2015 2016
Market values at each reporting date are estimated by management using the actual annual contracted current year revenue stream
less a reserve allowance, applying a capitalization rate to this normalized income, and deriving a fair value. Capitalization rates used to
estimate fair market value consider many factors including but not limited to; location, size of land, site coverage, strength of tenant, term
of lease, lease rate, age of building, size of building, construction of building and any special features of the building. Given that not all
industrial properties are the same, management will apply these factors to each property in determining a capitalization rate. If a property
has all favourable factors, the valuation will likely be calculated using the low end of the capitalization rate range.
Lower capitalization rates are applied to the Company’s class are complete. Vacant land included in investment property, is
A buildings that have strong tenants, long term leases and are valued using management’s research of similar vacant land that
typically of newer construction. Higher capitalization rates apply to has sold recently, or is available for sale.
the Company’s older buildings and take into consideration whether
the property is multi tenanted, the strength of the tenants and At September 30, 2016, the Company acquired the Seaboard
location of the asset. Canada property in Edmonton for $12,436,069, and disposed of
one property recorded at a value of $3,151,308. In calendar 2015,
At each reporting date this calculation method is performed on all there were two major acquisitions that totalled $36 million; Essential
the investment properties except for the Oliver Crossing property Energy building in Red Deer, Alberta and the Strongco building in
and vacant land. The market value of Oliver Crossing is calculated Fort McMurray, Alberta.
based on the total square footage of land multiplied by a dollar
value per square foot. This property is in a high demand area of Interest expense on mortgages and other financing was
Edmonton situated on the fringe of downtown. The current buildings $2,365,610 at September 30, 2016 compared to $2,731,633 at
on the property are aged and the real property value is not derived September 30, 2015. In the current year, the Company received
from the buildings and their lease income, but rather is derived from new mortgage financing at lower annual rates and repaid other
the land value in this highly sought after area. financing that had an 8% annual rate of interest. The result is
lower interest expense and an increase in the Company’s interest
Construction of new buildings are valued at cost until the earlier of coverage ratio.
the date that fair value can be reliably determined or the projects
19 ANNUAL REPORT 20 1 6SEPTEMBER 30 2016 2015
ADJUSTED EBITDA $7,299,363 $6,989,431
Interest expense $2,365,610 $2,731,633
Interest coverage ratio 3.09 2.56
Minimum threshold 1.50 1.50
The adjusted EBITDA is used to show cash generated from operations before interest and income taxes and non-cash items on
the statement of earnings. This is the amount of cash the Company has available to service the interest on its debt. The goals of
the Company include maintaining strong operating cash flows to fund further growth and generate cash that well exceeds finance
obligations and Management’s minimum interest coverage threshold noted above. The Company continues to achieve both goals.
CASH FLOWS
FROM CONTINUING OPERATIONS
Cash inflows from operating activities were $6,867,695 at five years at rates below 3%. At September 30, 2016, the Company
September 30, 2016 (September 30, 2015 – inflows of $7,886,120). also placed a mortgage on the newest acquisition at that date. Total
The Company continues to generate positive cash from operations proceeds from mortgage financing and refinancing during the year
to cover day to day expenditures and bank cash for future were $25,494,000. The repayment of principal on mortgages during
opportunities. Non-cash working capital figures include changes in the current year was $11,459,756. The new mortgage financing
receivables and payables. At September 2016, non-cash working decreased the weighted average rate of interest on the mortgages
capital was $140,842 compared to $1,362,147 at September 30, to 3.10% at September 30, 2016, from 3.56% at September 30,
2015. Removing the non-cash working capital from cashflows from 2015. The benefit derived from these lower rates will be evident
operations, shows a positive increase in cashflow in the current over the next year as interest expense will decrease, freeing up
year. more cash flow from financing activities.
Cash outflows from real estate investing were $10,075,843 Transactions costs associated with new mortgages totalled
at September 30, 2016 (September 30, 2015 – ($15,676,769)). At $151,040 at September 30, 2016 compared to $50,569 at
September 30, 2016, there are property improvement expenditures September 30, 2015. These costs are amortized over the terms of
in the amount of $364,194 and tenant inducements of $400,000. the respective mortgages and are shown net of the mortgages on
At September 30, 2016, the Company acquired a property in the consolidated statements of financial position.
Edmonton for $12,436,069 and sold one property for net proceeds
of $3,190,740. In the prior year, the Company purchased the Throughout the current year, the Company purchased 106,400
Essential Energy building for an outflow of cash of $15,537,606. common shares under the normal course issuer bid for a total cost
of $469,527. In the prior year 92,100 shares were purchased for a
Net cash inflows from financing were $778,003 at September total cost of $405,938.
30, 2016 compared to cash inflow of $7,699,274 at September 30,
2015. During Q1 2016 the Company took advantage of increased Net cash inflows from discontinued operations (the sale of
equity on four properties by obtaining four new mortgages and IDCI) were $3,535,460. This figure represents the sale proceeds
repaying the principal balances of three of the mortgages at their received to date less disposition costs, income taxes, return of the
term dates. The net proceeds of the new mortgages were used to shareholder loan and operating activities to the date of sale.
repay other financing that had a balance at September 30, 2015 of Total net cash inflows from continued and discontinued operations
$2,925,000. Additionally, two lines of credit with combined balances are $1,105,315 at September 30, 2016 (September 30, 2015 – net
of $9,756,847 were paid in full in Q1 2016. In the current year, the inflows were $266,812).
Company was able to renew two mortgages for a further term of
ANNUAL REPORT 20 1 6 20EQUITY IN INVESTMENT PROPERTIES HAS
SIGNIFICANT BALANCE SHEET CHANGES
INCREASED $7,310,601
SINCE SEPTEMBER 30, 2015
MARKET VALUE - INVESTMENT PROPERTY
AND PROPERTY HELD FOR SALE
MORTGAGES & OTHER FINANCING
200
150
168
Millions
157
100
50 74 78
-
Sep. 30 2015 Sep. 30 2016
Investment properties and investment properties held for sale include the fair value of the
properties at the reporting date as valued by Management, including the balance of straight line
rent receivables, unamortized deferred leasing costs and unamortized tenant inducements.
The increase in the investment properties since September 30, 2015 is attributed
to the following:
a decrease in the balance of deferred leasing after amortization $ (199,170)
an increase in the straight-line rent receivables 112,541
capital expenditures on properties 364,194
tenant inducements after amortization 372,727
fair value net increases 1,135,699
property acquisition 12,436,069
sale of investment property (3,151,308)
Total increase September 30, 2015 to September 30, 2016 $ 11,070,752
Loan receivable at September 30, 2016 of $482,063 relates to the sale of IDCI at December
31, 2015. This loan is net of a discount of $17,937 and is due December 31, 2017. The current
portion of the loan receivable in the amount of $496,362 is also due from the purchaser. This
current loan is shown net of a discount of $3,638 and is due December 31, 2016. The loan is
non-interest bearing and therefore discounted and amortized over the term. The amortized
discount is shown as interest income in the consolidated statements of comprehensive income.
21 ANNUAL REPORT 20 1 6Trade receivables at September 30, 2016 in the amount of Netted against mortgages on the statement of financial position
$110,585 include property operating expense revenue adjustments is the balance of unamortized transaction costs of $215,323 at
made at year end when the budgeted costs are compared to the September 30, 2016 (September 30, 2015 – $120,689).
actual costs. Refunds are credited to the tenant accounts where
budgeted costs exceeded actual costs, and tenants that were Bank operating facilities at September 30, 2016 have a
undercharged are billed accordingly. One tenant has rental arrears balance of $2,502,387 with one of the Company’s major lenders.
and the Company continues to work with this tenant until their This credit facility assisted with the acquisition of investment
cash flow improves and they can bring their account current. At property on September 30, 2016. At September 30, 2015, the
September 30, 2015, receivables included the pharmaceutical balance on this line of credit was $7,997,378. The Company
segment, IDCI, which was sold at December 31, 2015. The balance currently has two credit facilities at September 30, 2016, one
of tenant receivables at September 30, 2016 are considered has a limit of $1,800,000 (September 30, 2015 - $1,800,000)
collectible. and bears interest at a rate of prime plus 1% unchanged from
the prior year. This line of credit is secured by a specific revenue
Prepaid expenses and deposits have a balance at September producing property with a fair value of $8,400,000 at September
30, 2016 of $494,762 compared to $523,728 at September 30, 30, 2016 (September 30, 2015 - $8,400,000). The balance on this
2015. Prepaid expenses include property insurance, property taxes line of credit is Nil at September 30, 2016 (September 30, 2015 -
and a deposit with a municipality. At December 31, 2015, prepaid $1,759,469).
expenses belonging to IDCI were acquired by the purchaser.
A second line of credit which was paid out during Q1 2016 was
Mortgages at September 30, 2016 have a balance of subsequently renegotiated with a reduced limit of $3,000,000
$75,593,117 ($61,558,871 - September 30, 2015). During the (September 30, 2015 – the limit was $8,000,000). This line of
current year, the Company received proceeds from five new credit incurs standby fees on any unused portion of the facility.
mortgages totalling $25,494,000 and repaid three mortgages that This revolving demand facility is available to assist with property
were up for renewal with combined principal balances at September acquisitions, payment of development costs, and general corporate
30, 2015 of $6,403,942. New mortgage proceeds were used to purposes. The balance on this line of credit at September 30, 2016
repay two lines of credit with combined balances of $9,756,847, is $2,502,387.
and repay other financing outstanding in the amount of $2,925,000.
An additional line of credit at September 30, 2015 with a balance
During Q2 2016 two mortgages were renewed for a further term of of $2,663,411, related to the pharmaceutical company IDCI, which
five years at rates below 3%. was sold on December 31, 2015. This line of credit was part of the
liabilities assumed by the purchaser.
At September 30, 2016, there are four mortgages up for renewal
in the next twelve months with combined principal balances of Specific details of the credit facilities and associated loan covenants
$14,222,313 which are shown as current liabilities. One of the can be found in note 11 of the consolidated financial statements.
mortgages with a term date of October 1, 2016 has been renewed The Company was not in breach of any loan covenants throughout
for a further term of five years at a lower rate of interest than was both reporting years.
previously attained. The Company expects to renew the other four
mortgages when they come due.
CREDIT FACILITIES September 30, September 30,
2016 2015
Bank credit facilities $ 4,800,000 $ 9,800,000
Amounts drawn on facilities (2,502,387) (9,756,848)
Available credit facilities $ 2,297,613 $ 43,152
Payables and accruals at September 30, 2016 have a balance of $818,739 (September 30, 2015 -$6,405,241). At September 30,
2016, the accruals include prepaid rents from tenants of $176,977, accrued loan interest of $176,141, the current portion of tenant security
deposits of $79,619 and regular trade payables. Payables and accruals in IDCI at September 30, 2015 were assumed by the purchaser at
the sale date of December 31, 2015.
ANNUAL REPORT 20 1 6 22You can also read