ESG Integration INSIGHTS - 2017 OMNIBUS
←
→
Page content transcription
If your browser does not render page correctly, please read the page content below

ESG Integration
        INSIGHTS

         2017 OMNIBUS
         EDITION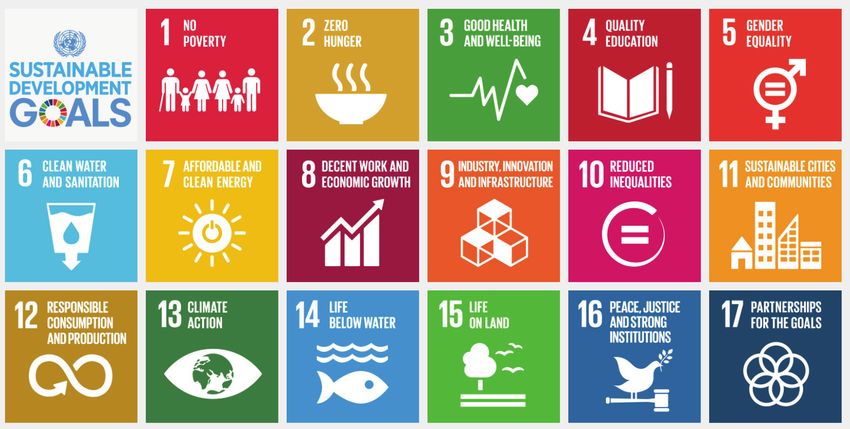
Introduction
Just as the advent of financial accounting standards provided a common language
for companies and investors to communicate about financial performance, the SASB
Standards enable companies and investors to develop a common language about
performance on financially material ESG issues. The SASB Standards are designed
to yield comparable, consistent, and reliable data on the ESG issues that matter most
to business financial performance. SASB thus enables rigorous integration of ESG
considerations into investment decisions, across many types of investment strategies
and asset classes.
Our purpose in launching ESG Integration Insights in 2016 was to share best practices on
investor use of SASB Standards and tools. We were also striving to demystify investor use
of sustainability information for corporate professionals – ranging from sustainability
practitioners to financial executives and board members – by demonstrating how investors
use the SASB Standards in investment decision-making. We were delighted to feature
five case studies in the premier edition of ESG Integration Insights that demonstrated the
utility of SASB Standards to global investors in fundamental equity and credit analysis,
private equity due diligence, as well as by asset owners in manager selection.
The 2017 compendium of ESG Integration Insights includes eight case studies,
demonstrating the increasing depth, breadth and rigor of ESG integration by investors.
It includes case studies by equity and fixed income investors, including use of the SASB
Standards to evaluate risk in emerging markets. This year’s case studies also explore the
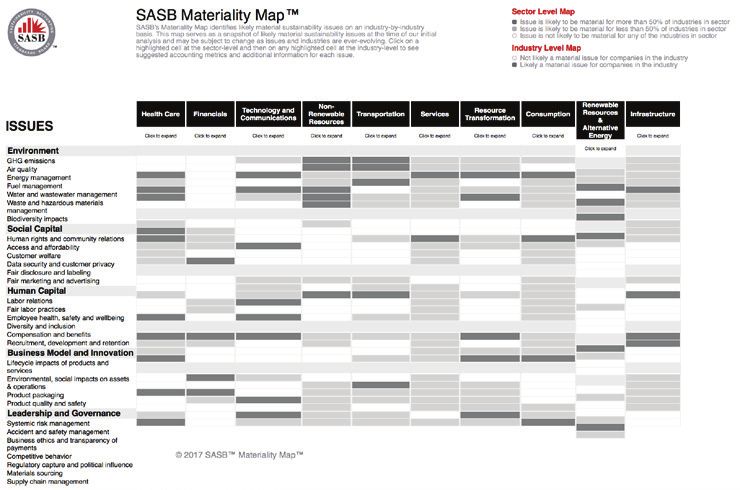
utility of SASB’s Sustainable Industry Classification System (SICS™), in the context of
more effectively constructing less carbon-intensive indices, and how certain industries
are more exposed to risk and opportunities inherent in the Sustainable Development
Goals (SDGs). The case studies also continue to explore the use of the SASB Standards by
asset owners to evaluate investment managers.
SASB’s Standards reflect years of work – not only by SASB, but also by investors,
corporations and others – whose efforts have helped shape and refine the standards.
We thank everyone who has contributed to development of the SASB Standards and the
contributors to this publication. We look forward to sharing future insights with you as the
practice of ESG integration continues to mature. Please contact me if you are interested in
submitting a case for inclusion in future editions of SASB’s ESG Integration Insights.
Best regards,
Janine Guillot
Director, Capital Markets Policy and Outreach
INTRODUCTION | 1
Contents

4   Equities
    BlueSky Investment Management: ESG Integration: the Evolution of Value Investing

    Nordea Asset Management’s Nordea 1 Emerging Stars Equity Fund –
    ESG Integration in Emerging Markets

22 Fixed Income
    Payden & Rygel: Emerging Markets Credit Analysis, Augmented by SASB Standards
    – Arcos Dorados

    PIMCO: ESG for Commercial Banks

    PineBridge Investments: Assessing the Carbon Footprint of a High-Quality
    Bond Portfolio

44 Manager Selection and Evaluation
    Wespath’s Analytical Insights: ESG Integration in External Asset Manager Selection
    Uncovering Managers’ ESG Strengths in the Search Process

54 SASB Tools
    Calvert Research and Management: Incorporating the UN Sustainable
    Development Goals into ESG Investment Research via SASB Tools

    ET Research: Use of SASB’s Sustainable Industry Classification System (SICS™)
    in the Engaged Tracking Carbon Ranking and Index Series

                                                                                    3 | CONTENTS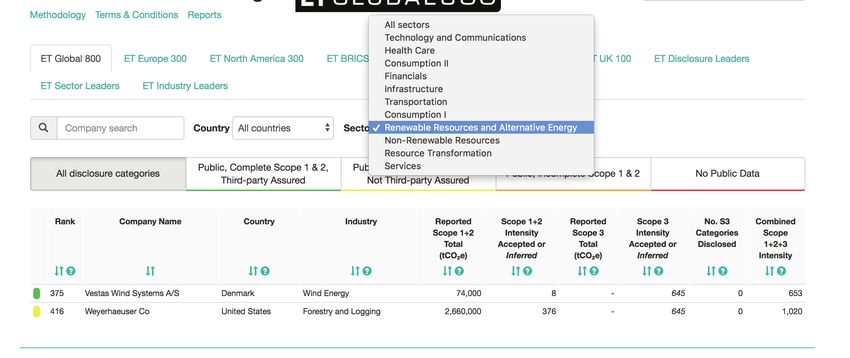
Previously Published: Q2 2017

BlueSky Investment Management
ESG Integration: the Evolution of Value Investing

Introduction
Professional investment management is organized around the principle of fiduciary duty.          BlueSky is a global
Simply stated, a manager’s actions must be undertaken for the sole benefit of the client,        fundamental value investment
typically measured by risk-adjusted financial return. Today, there is mounting evidence          management firm, dedicated
that environmental, social and governance (ESG) factors can impact financial return,             to active, high-quality
                                                                                                 value equity investing and
including a wide body of academic studies, investment bank research, as well as research
                                                                                                 founded on a process-driven,
conducted by the Sustainability Accounting Standards Board (SASB). To further explore            repeatable approach. We
the impact of ESG on financial return, BlueSky conducted our own research over an                seek high-quality businesses,
18-month period and found that, while the majority of ESG data available showed little           with enduring competitive
value, there is a high correlation between material ESG factors and share performance and        advantages, purchased at
return on invested capital (ROIC), confirming the significant financial impact of ESG and        reasonable prices. Our unique
consideration of these factors in the investment process.                                        investment approach integrates
                                                                                                 material environmental, social
We believe the performance of many recently created ESG-focused products suffers from            and governance (ESG) factors
the following shortcomings:                                                                      that our proprietary process
                                                                                                 has demonstrated to be highly
 • Use of ESG as a secondary screening tool, and reliance on subjective third-party              correlated with performance.
   ESG scoring and rating methodologies that may have little or no connection to                 We believe our broader
   financial materiality                                                                         perspective to investing,
 • Strong home country bias among US investment managers, offering few global or                 which analyzes companies
                                                                                                 across a wider set of material
   international equity ESG-integrated investment solutions
                                                                                                 information, can enhance
 • Integration of ESG in investment decisions solely from a growth investing                     performance and provide
   perspective                                                                                   superior risk management.

The financial materiality of ESG factors can influence both value and growth, and can be
applied beyond the US to evaluate international companies.

4 | BLUESKY INVESTMENT MANAGEMENT – SASB INTEGRATION CASE STUDY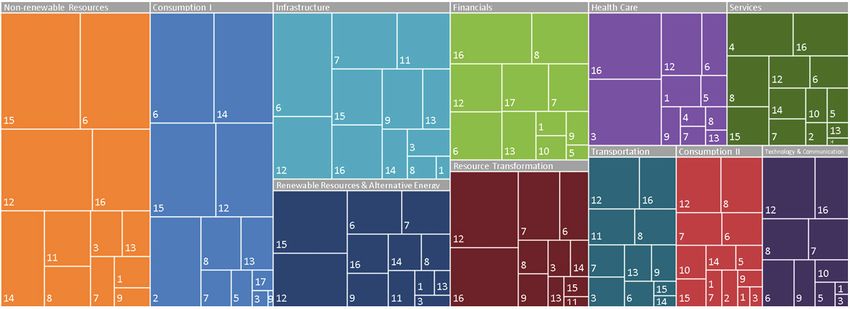
ESG Integration: the Evolution of Value Investing
BlueSky was founded on the simple concept that integrating value investing with ESG analysis can
enhance performance and better manage risk – that ESG integration is an evolution of value investing.
In short, this approach employs a wider lens that can more fully reveal risks and opportunities, leading
to better investment outcomes. BlueSky is unique as an ESG integrated fundamental value firm with
global, international, and US strategies. As value investors, we believe the key to long-term investment
success is our ability to identify and purchase companies that trade at significant discounts to their
intrinsic value and sell these investments when intrinsic value is realized. From our perspective,
integration of carefully selected and financially material ESG factors represents a significant
opportunity to evolve and improve upon traditional value investing techniques. Our ESG integration
approach broadens the pool of potential risks we seek to avoid while also identifying potential
competitive advantages, enabling the evaluation of companies across a more complete set of material
information to drive better investment decisions.
Margin of safety is one of the key principles of value investing, originally developed by Benjamin Graham
and described in his book, The Intelligent Investor. This simple concept is the cornerstone of active
investment management, which illustrates the importance of buying a company at a significant discount
to its intrinsic value. The greater this discount, the greater the margin of safety. Stocks trading below
their intrinsic value will typically fall less in a declining market and thus offer the benefit of lowering
investment risk. We believe ESG integration further enhances value investing principles; managing
material ESG risks can reinforce the margin of safety principal.
In determining a company’s intrinsic value, fundamental value investors have traditionally focused
on ROIC, free cash flow, strength of balance sheet, margins, competitive advantages/moats, and
management team quality. Including analysis of material ESG issues that may affect a company’s
intrinsic value can strengthen the fundamental value investing framework.
One might ask, how can a company’s ESG performance be tied to financial performance and affect the
fundamental value analysis? While material ESG factors differ by sector, we offer some broad examples of
how a company’s ESG performance can create shareholder value or affect company risk in Figure 1, below.

Figure 1: Value Creation and Risk Management in ESG Factors

       Value

                     E S G
               Environment                             Social Capital                            Leadership and Governance
    Creation   Companies increase profitability        A high quality workplace can be key       Sound governance practices create a culture of
               through effective resource              in attracting and retaining top talent,   transparency and accountability, safeguarding
               management, waste reduction and         which can increase productivity,          license to operate and reinforcing brand
               adoption of sustainable processes.      reduce employee turnover, and create      reputation. Prudent management of the supply
                                                       significant competitive advantages.       chain can help protect fair treatment of the
                                                                                                 workforce and suppliers and help ensure ethical
                                                                                                 sourcing of materials. Strong brand reputation can
                                                                                                 boost demand for products or services.

               Poor environmental performance          Poor management of human capital          Poor governance can result in fines; legal
        Risk   can increase cost of capital, and       can create higher turnover, increase      costs; disruptions to materials; and labor and
               operating costs, and create potential   costs, and make companies less            productivity. These negatively impact revenues,
               liabilities including fines and         competitive.                              increase cost of capital, and severely damage
               lawsuits.                                                                         brand reputation.

Figure 1 clearly demonstrates the potential financial impact of ESG. BlueSky believes that it is
our fiduciary duty to integrate ESG across material issues that can impact a company’s financial
performance. From our perspective, it is only a matter of time before investors recognize that the real
risk lies in the failure to assess ESG impacts in the investment process.

                                                                                                                                      SASB ESG INTEGRATION INSIGHTS | 5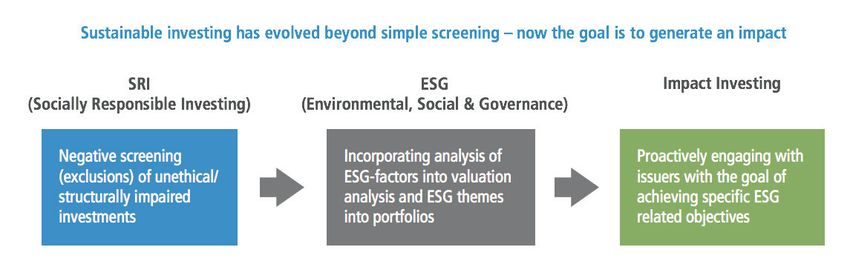
Nonetheless, we have found it challenging to find quality ESG data to properly evaluate how companies
are responding to material ESG issues. Despite a growing body of ESG data in the marketplace, investors
are faced with the following problems:
 • Data of varying quality
 • Understanding what is being measured
 • Subjective ratings and ranking methodologies
 • Immateriality of data disclosed
 • Limited coverage beyond large caps

Development of BlueSky Investments’ ESG
Integration Methodology
Faced with the aforementioned ESG data challenges, BlueSky conducted 18 months of quantitative
research to explore the financial materiality of ESG issues, with the goal of integrating material ESG
factors into a fundamental value investing framework.
Our research determined that the materiality of ESG factors varied by sector and region. Companies
performing well on material ESG factors in a given sector and region were positively correlated to both
increased ROIC and share performance. The major stumbling block revealed by our research was that
much of the current body of ESG data provides little correlation to performance and risk, emphasizing
the importance of an empirical approach.
BlueSky proceeded to develop a proprietary ESG evaluation framework designed to drive alpha and
better manage risk. We created over 40 unique ESG Roadmaps™ comprised of material ESG factors
unique to each sector and region. We then ranked companies based on a composite score of empirically
selected material factors sourced from corporate disclosures, specialized datasets, and other publicly filed
information. This process allowed us to integrate only financially material ESG data that adds value to our
process, while ignoring vast amounts of data that was financially immaterial.
During the initial phase of our investment process, companies identified by our value screens are
evaluated through our proprietary quantitative ESG framework, which ranks each company’s ESG
performance on financially material issues by sector. Utilizing these screened results, the firm
concentrates on the most attractive three deciles (30%) of companies for portfolio inclusion. We then
screen for quality to further narrow portfolio candidates, considering, among other factors, balance

Investment Process
sheet strength, operating efficiency and profitability.

Figure 2: BlueSky’s investment process seeks to broaden traditional fundamental value work by
integrating the quantitative and qualitative ESG assessment described below.
                      1                           2                                 3

                             IDEA                                                        FUNDAMENTAL                 INVESTMENT
                                                           FINANCIAL                       BUSINESS
                          GENERATION                        ANALYSIS                                                 CANDIDATES
                                                                                           ANALYSIS
   GLOBAL
  UNIVERSE
                           Value Screens                  Key Financials                Competitive Strengths            Portfolio
                          Attractive Valuations          Balance Sheet, Income
                                                                                          and Weaknesses               Approximately 40
                                                                                                                     Qualifying Investments
                           vs. Returns Offered        Statement, Ratio Analysis &         Profitability, Operating
                                                       Free Cash Flow Generation              Efficiency, Moat

                                                           Quantitative                       Qualitative               Reserve List
                                                         ESG Roadmaps™                       ESG Analysis                Typically 30
                                                                                                                     Qualifying Candidates
                                                          Proprietary Ranking                 SASB Industry
                                                          by Sector and Region               Disclosure Topics

6 | BLUESKY INVESTMENT MANAGEMENT – SASB INTEGRATION CASE STUDY

                                                                                                                                              18
To provide a more complete understanding of a company’s ESG performance on material issues, BlueSky
combines our quantitative work with an equally focused and rigorous qualitative ESG analysis. This
is particularly valuable in situations where there is limited ESG data. SASB’s industry standards and
disclosure topics are integral to this phase of analysis, providing ideal roadmaps to best assess each
company’s unique subsector risk exposures and potential opportunities.
In this final phase of evaluation, we closely examine a company’s management quality, its three to five
year business outlook, and its ability to maintain competitive advantages. Fundamental analysis of a
company’s operational performance and survivorship is based on profitability, leverage, and liquidity rates.
Companies that do not score above-average on our ESG ranking or that lack sufficient ESG data may be
further considered if there is reasonable confidence the company is performing well across SASB industry
disclosure topics in our qualitative assessment. ESG risks and opportunities unique to each company and
sector are discussed and carefully considered in determining future outlook. (See Figure 2.)

    Case Study: Howdens Joinery
    Howdens Joinery Group Plc is one of the largest integrated suppliers of kitchens and
    joinery products in the United Kingdom. Founded in Yorkshire in 1995 under the name
    Galiform Plc, the company originally operated as a successful business unit within MFI
    Industries. Following a restructuring, MFI sold its unprofitable retail businesses to focus
    on the more profitable Galiform, and the company was renamed Howdens Joinery in 2010.
    Last year, Howdens designed, manufactured and sold over 400,000 kitchens, 2.5 million doors,
    and 770,000 appliances in the United Kingdom alone. This was accomplished through their network
    of over 600 outlets across the UK that cater primarily to local tradesmen. With presence in Belgium,
    France, Germany, and the Netherlands, Howdens is testing formats for potential expansion.
    In the fall of 2016, Howdens first appeared on several of our value screens after falling approximately
    25% following the UK vote to leave the European Union. We believed the market fears were at extremes
    for a company that had sound management, competitive gross and operating profit margins, good
    cost controls, and a flexible business model with sound incentives for both managers and employees
    of outlets. Additionally, the company was buying back shares and had net cash on their balance sheet.
    Howdens had also demonstrated it had pricing power and was able to navigate successfully through the
    2008 credit crisis.
    From an ESG perspective, there was limited coverage of Howdens across the material ESG data in our
    proprietary quantitative model. Had our approach relied solely on ESG data, we would not have been
    able to continue with our analysis. However, because our process utilizes both data and a qualitative
    ESG assessment, we were able to move forward with our research. We began analyzing the company’s
    performance across material topics identified in SASB’s SICS classification for Building Products &
    Furnishings (Consumer Goods Sector*). Here are our findings:

    SASB Disclosure Topic: Energy management in manufacturing
    Howdens Joinery has been certified by the Carbon Trust Standard for several years in recognition of
    their success in reducing overall energy usage and their commitment to continued reductions. The
    company reduced its carbon footprint (tCO2e per £m) by 13.4% from 2014 to 2016. Over this time period,
    the company’s total scope 1 and scope 2 emissions have remained relatively flat while revenues increased
    by 19.8%. The company has reduced energy use through technology innovations in their cabinet
    production, conversion to LED lighting, and other efficiencies. Additionally, the company manages and
    measures truck fleet efficiency, having improved miles per gallon by 7% since 2014.

    * In 2018, SASB’s Sustainable Industry Classification System (SICS) will be updated, at which time the “Consumption II” sector will be
       renamed “Consumer Goods.”

                                                                                                                             SASB ESG INTEGRATION INSIGHTS | 7
Case Study: Howdens Joinery (cont.)
   SASB Disclosure Topic: Management of chemicals in products
   The company follows a number of regulatory guidelines and processes to ensure safety of workers
   and consumers of its products. Howdens’ internal process is governed by the Control of Substances
   Hazardous to Health (COSHH) Regulations 2002. Under these guidelines, the company is required to
   formally assess and approve chemicals used in manufacturing, maintenance, and cleaning. This includes
   the impact of chemicals on workers in the manufacturing process and the full life cycle impact. The
   company also requests formal confirmation from all suppliers that there are no Substances of Very
   High Concern (SCHC’s) as listed under the Registration, Evaluation, Authorization and Restriction
   of Chemicals (REACH) Regulations. Howdens’ cabinets are manufactured from pre-made wood
   based panels that are certified under the EU Construction Products Regulation, which conforms to
   strict chemical standards. The company also performs risk assessments of materials and products in
   terms of country of origin, degree of complexity, and prevalence of non-compliance based on industry
   intelligence. Higher risk products are then screened through additional testing to ensure compliance
   with required standards.

   SASB Disclosure Topic: Product lifecycle environmental impacts
   The company has been successful in reducing waste in its manufacturing process through the
   implementation of newer machinery and the use of software technology. They have worked with
   suppliers to manufacture custom-sized chipboard in order to ensure minimal waste in production.
   Despite this, since wood-based products make up over 75% of their products, the company produces
   a lot of sawdust waste. The company realized an opportunity to use the sawdust waste as an energy
   source and installed efficient biomass boilers at their two manufacturing sites in 2015. Over 12,000
   tons of sawdust was converted to energy in 2016, generating approximately 42,000 MWh of energy.
   The company recycled or reused 98% of its total waste in 2016. 100% of all packaging was from recycled
   sources. The company implemented a policy of repairing and reusing wooden shipping pallets over nine
   years ago. In 2016, over 165,000 pallets were repaired and reused, thus significantly reducing what might
   have become addition waste.

   SASB Disclosure Topic: Wood sourcing
   Over 75% of Howdens’ products are wood or wood-based, and the company sources 100% of wood-based
   materials from FSC (Forest Stewardship Council) certified sources. FSC is a non-profit organization
   setting what is widely considered to be the gold standard for responsible forest management and wood
   sourcing. The company is committed to using FSC certified sources to ensure that there is independent
   verification of responsible sourcing. The company also works closely with suppliers to ensure continued
   compliance with FSC standards.
   With very little ESG data to rely on, this qualitative ESG assessment gave our team a high degree of
   confidence that Howdens Joinery was performing well across financially material ESG factors. This
   example highlights the challenges regarding the state of ESG data, but also emphasizes the importance
   of combining both data and qualitative ESG research. SASB’s research helped us focus on material topics
   likely to impact financial performance and, following further fundamental work, we ultimately added
   Howdens Joinery to our portfolio. Had our process relied solely on ESG data, we likely would not have
   been able to move forward with purchasing this company.

8 | BLUESKY INVESTMENT MANAGEMENT – SASB INTEGRATION CASE STUDY
ESG in the Global Context
As part of our proprietary research, BlueSky examined ESG materiality globally and we found much of
SASB’s industry standards to be applicable in analyzing European companies. However, within a global
context, BlueSky has observed regional and cultural differences that required us to create customized
ESG Roadmaps™ that incorporate only those ESG factors that are uniquely correlated to financial
performance in that particular region. For example, we have found very little materiality across social
factors in Japan, while certain environmental and governance factors remain important there. Our
quantitative research found social factors such as supply chain management, workplace satisfaction,
human capital development, and employee retention to have no correlation to increased ROIC or share
performance, while these same factors showed more significant correlations to increased ROIC in
both the US and Europe. Further, to compare a Japanese industrial company to a European industrial
company requires a more nuanced approach due to, among other things, the keiretsu corporate
structure prevalent in and unique to Japan. At BlueSky, we made the strategic decision to carve out
Japan and other geographic regions as separate universes in order to effectively evaluate and rank
companies on financially material ESG factors.

In Conclusion
While we believe it is challenging to formally quantify all ESG risks and opportunities, our quantitative
work combined with our qualitative ESG analysis (which leverages SASB’s framework) allows our team
to confidently assess a company’s performance across financially material ESG factors. Our team can
then discuss each individual portfolio candidate within our holistic value/ESG framework. ESG provides
an important measure of corporate quality that broadens traditional fundamental value investing to
more fully reveal risks, opportunities, and competitive positioning. Through this wider lens, we are
able to identify great businesses at attractive valuations where we are confident that the company is
addressing material ESG risks that reinforce our margin of safety. Our focus on financially material ESG
issues also assists us in identifying companies that may have competitive advantages that can increase
intrinsic value.

DISCLOSURES

BlueSky Investment Management, LLC is a Registered Investment Adviser. This presentation is solely for informational purposes and not a
solicitation to invest. Advisory services are only offered to clients or prospective clients where BlueSky Investment Management, LLC and its
representatives are properly licensed or exempt from licensure. Past performance is no guarantee of future returns. Investing involves risk and
possible loss of principal capital. No advice may be rendered by BlueSky Investment Management, LLC unless a client service agreement is in
place. Please contact a financial advisory professional before making any investment.

                                                                                                                               SASB ESG INTEGRATION INSIGHTS | 9
Nordea Asset Management
Nordea 1 Emerging Stars Equity Fund –
ESG Integration in Emerging Markets
Executive Summary
The global momentum for responsible investment continues as corporates navigate Nordea Asset Management
the challenges and opportunities brought by the rapidly-transforming landscape of (NAM, 219bn EUR in assets
environmental, social and governance (ESG) issues. Investors increasingly recognize under management) has
a global business model,
that company performance on ESG factors can result in material impacts on the risk and
and manages asset classes
return profiles of their investments; now, more than ever, sustainable (and unsustainable) across the full investment
business practices can significantly affect financial returns and the health of financial spectrum, including equity,
markets. The following case outlines Nordea Asset Management’s (NAM) investment fixed income, and multi asset
philosophy and approach in creating the Nordea 1 Emerging Stars Equity Fund and solutions. NAM is a leading
specifically, how SASB Standards were used to augment our framework for assessing a investment manager in the
Chilean copper mining company1 as an attractive and responsible investment for inclusion Nordic region, and also serves
a large and growing body
in the fund.
of clients in Europe, the
Americas and Asia. NAM’s
Nordea Asset Management and ESG Integration mission to deliver returns with
Responsible investment has long been an integral part of our DNA as a Nordic asset responsibility is based on active
manager. NAM signed the UN-backed Principles for Responsible Investment (PRI) in management and thorough
risk management. We strive
November 2007. As one of the first asset managers in the Nordic market to sign the PRI,
to optimize risk-adjusted
we have long been committed to incorporating ESG issues into our investment decisions returns for our customers
and have a longer track record than many global asset managers in developing a cohesive vs. a benchmark or on an
approach to such integration. absolute level. Our client base
is equally split between our
captive distribution channel
and external clients.
1
Nordea Investment Management, AB has selected these case studies for illustrative purposes only and is not intended
or should interpreted as a recommendation to purchase or sell such security. The security references may or may not be
held in portfolios managed by Nordea Investment Management, AB and, if such security is held, no representation is being
made that such security will continue to be held.
10 | NORDEA ASSET MANAGEMENT – SASB INTEGRATION CASE STUDYWe include ESG considerations in our investment analyses, decision-making processes, and ownership
policies and practices. We believe that incorporating ESG factors in our investment activities can
safeguard shareholder value and enhance long-term returns. This is supported by growing bodies of
industry and academic research2 correlating ESG performance to corporate financial performance and
improved shareholder returns. Considering material ESG issues in our investment decisions is a part of
our fiduciary duty to our clients; being ESG proactive is reflected in our mission statement.
Nordea 1 Emerging Stars Equity Fund
Nordea Asset Management launched the Nordea 1 Emerging Stars Equity Fund in April 2011, with
the aim of creating a unique emerging market equity fund in which fundamental strategy and
valuation analysis in portfolio stock selection fully integrates ESG factors. Rather than utilising a
“first-generation” approach to ESG considerations, i.e., utilising a “negative screen” to avoid certain
companies and sectors, we wanted to take a positive, “second-generation” approach, in which ESG
analysis could add value to the investment case. The vision was to create a high alpha performing fund in
which ESG considerations act not only as risk mitigants in securities analysis and portfolio construction,
but also improve understanding of a company’s value drivers more holistically. We recognised a number
of key factors as we developed this portfolio:
1. Important information which could have a material impact on companies in emerging markets was
not discernible via the traditional data sets used in conventional investment analysis.
2. While emerging markets are typically considered to carry higher risk, favourable structural growth
dynamics in certain markets have the potential to interact strongly with company-level ESG factors
and thus, present significant return opportunities in these markets. ESG analysis would, therefore,
provide us with a better “distribution curve” of future performance and potential value creation.
3. Engaging with companies to improve management of material ESG issues could be an additional
lever to unlock value if a company’s cash flow was being overly discounted due to either poor
reporting or poor management of ESG factors.
We were one of the first-movers in creating a “second-generation” approach to integrating ESG in
investments, and have one of the longest track records on this approach from a performance perspective.
The Emerging Stars Investment Philosophy:
“Returns with Responsibility” in Emerging Markets
We believe that, when Economic Value Added (EVA)—the incremental difference in the rate of return
over a company’s cost of capital—is not properly priced by the market, excess shareholder value
can be generated. Companies now operate against a backdrop of mounting operational complexity,
characterized by unprecedented wealth transfers, shifting demographic and political landscapes,
rising emerging-market competitiveness, and disruptive technologies, among other things. Thus,
we believe that an approach to securities selection focused solely on long-term EVA is no longer
adequate to generating alpha for our clients. Complementing traditional investment analysis with ESG
enquiry is necessary to understand how these issues—which tend to be excluded from conventional
investor-focused communication—affect the ability of companies to grow and create shareholder value.
Furthermore, we believe that on-the-ground company interaction is necessary to get a full picture of
how companies are managing these complex issues.
With this in mind, we identify the companies that can create a significant relative change in their EVA
generation in a sustainable way; i.e., have a “delta” in EVA profiles as well as a “delta” in Sustainability
profiles (see Figure 1). We believe this process identifies the future “star” companies in emerging
markets; i.e., the companies that will generate sustainable shareholder value and outperform.
2
Khan, Mozaffar and Serafeim, George and Yoon, Aaron S., Corporate Sustainability: First Evidence on Materiality (November 9, 2016). The
Accounting Review, Vol. 91, No. 6, pp. 1697-1724
SASB ESG INTEGRATION INSIGHTS | 11Figure 1: “Returns with Responsibility” in Emerging Markets
3. VALUATION
EVA valuation
approach SOCIAL RESPONSIBILITY
EVA GAP
(SHAREHOLDER 2. KEY INDUSTRY
VALUE) SUCCESS FACTORS SUSTAINABILITY
1. GROWTH POCKETS
Looking for structural Industry competitiveness
growth, and the – analysing company
companies that will strategies and the
capitalize from it opportunities for ENVIRONMENT GOVERNANCE
EVA creation
We believe there are three key steps to finding growth in EVA that is not priced by
VALUATION
the market:
1. We search for the attractive growth pockets in EM where the changes
between demand and supply in a given part of the economy may lead to an
opportunity for a company to capitalize on these changes ENVIRONMENT SOCIAL RESPONSIBILITY
2. Within these growth pockets we then identify the companies that have
long-term competitive advantage the opportunity to and likelihood of creating
a significant EVA delta via growth strategies SUSTAINABLE
3. Detailed EVA valuation to determine whether this long-term EVA profile is
SHAREHOLDER
priced by the market VALUE GENERATION
A very important part of the strategic analysis is how ESG factors impact corporate
competitiveness. In our ESG analysis it is essential that we understand both
risk and upside opportunities, and how the company can enhance its growth STRUCTURAL GROWTH INDUSTRY KEY
opportunities from how it interacts with key stakeholders – i.e. search for the delta SUCCESS FACTORS
in its sustainability profile. GOVERNANCE
Integration of ESG information in competitive advantage analysis (e.g., impact to cost structure, risk
factors, etc.) and into the valuation for our explicit forecast period differentiates our process from that
of others. Investment time horizon and longer-term forecasting capabilities are important components
of this process; ESG data holds information critical to understanding how companies are positioned
to manage longer-term risks. This is explicitly incorporated in our valuation framework through the
setting of our “fade rate” for the company. The fade rate describes the share of the excess return the
company generates, which we view as sustainable in the longer-term. In general we view companies’
competitive advantages as eroding over time, resulting in declining excess returns. However, with the
integration of the ESG aspect, we allow companies with positive scores and thus stronger competitive
advantages to maintain a higher ROIC premium in the longer term.
We believe true integration of financial and ESG factors requires in-depth analysis and that our
methodology for identifying emerging market “star” companies generates sustainable shareholder
value. The Emerging Stars Equity Fund has shown significant outperformance3 both compared to MSCI
Global Emerging Markets and Peers, where it is ranked in first quartile on all relevant horizons. The key
performance driver has been stock selection, in particular, exposure to the “New Economy” driven by
consumers in emerging markets and insights into companies’ growth opportunities and value creation
through company stakeholder analysis.
³ Past performance is not a reliable indicator of future results.
12 | NORDEA ASSET MANAGEMENT – SASB INTEGRATION CASE STUDYIncorporating SASB
Proprietary ESG Analysis and Integration Standards in our ESG
analysis has enabled
of SASB Standards us not only to better
assess and identify the
Our proprietary ESG research approach attempts to identify stakeholder risks at the company level and financial materiality
is conducted from two perspectives. First, we assess alignment (or misalignment) of business models of ESG issues, but
in relation to global sustainability goals such as climate stability, resource scarcity, healthy ecosystems, also to identify the
basic needs, wellbeing or decent work.4 Second, we evaluate a company’s ability to manage material ESG relevant indicators or
data points that could
issues in relation to stakeholders, such as employees, suppliers, customers, communities, regulators, or
reflect a company’s
the environment. This involves assessing a company’s strategy and performance to address exposure to positioning on those
material ESG issues that could impact its risk/reward profile or growth opportunities. issues. Utilizing SASB
Incorporating SASB Standards in our ESG analysis has enabled us not only to better assess and identify industry standards
along with country
the financial materiality of ESG issues, but also to identify the relevant indicators or data points that
ESG risk indicators
could reflect a company’s positioning on those issues. Utilizing SASB industry standards along with provides us with
country ESG risk indicators provides us with further granularity on materiality. further granularity
Our proprietary ESG analysis is summarised in a company scorecard comprising of five pillars, as on materiality.
displayed in Figure 2. The business model and corporate governance pillars receive a fixed weight, whereas
the three remaining pillars – business ethics, environmental considerations and social issues – are
variably weighted depending on the company risk exposure, financial impact, and reputational risk. This Our active ownership
results in a final rating ranging from A to C, and positive or negative momentum indicators, as displayed and engagement
in Figure 3. Our research approach also allows us to identify areas of underperformance and then engage activities not only
with companies in hopes of influencing them to address challenges and move in the right direction. enhance corporate
transparency, but
Figure 2 – ESG Scorecard have also benefited
from access to
Rating: A-C / + -
ESG Scorecard: Company PLC 2017-06-12
RATING SASB Standards as
BUSINESS CORPORATE • Key sector issues are engagement tools for
BUSINESS ETHICS ENVIRONMENT SOCIAL
MODEL GOVERNANCE identified industries globally.
Development Board structure and We believe regulators
Key Issue Key Issue Key Issue • These are
Contribution independence
complemented with and exchanges in
Country/Sector Board compensation
Key Issue Key Issue Key Issue country and company emerging markets
Risk practices
specific issues (e.g., China, India,
Minority shareholder
Key Issue Key Issue Key Issue South Africa, Malaysia,
influence • Policy, strategy,
performance are KPIs
Thailand, etc.) would
Diversity of Board
& Executive evaluated do well to look to
management SASB Standards as they
• Voting and pursue encouraging
Audit & Accounting
engagement
practices recent initiatives to
conducted with
Sustainability companies to improve establish ESG reporting
governance
rating requirements for
RATING A-C A-C A-C A-C A-C listed companies in
Risk exposure 1-3 1-3 1-3 these markets.
Financial impact 1-3 1-3 1-3
Reputational impact 1-3 1-3 1-3
WEIGHT 30% 10% Variable% Variable% Variable%
WEIGHT
• Business model 30% RISK
• Governance Quality 10% (implicitly assessed in the remaining 3 pillars) MIGITATION
• Business ethics, Environment and Social have variable weights based on AND VALUE
–– Risk exposure
–– Financial impact CREATION
–– Reputational impact
4
Investment Leaders Group, Cambridge Institute for Sustainability Leadership
SASB ESG INTEGRATION INSIGHTS | 13Figure 3 – ESG Rating Matrix
ESG Rating
A
“MATURE” A- A A+
B
“RISING”
B- B B+
C
“LAGGARD” C- C C+
NEGATIVE POSITIVE
TREND
SASB Standards and Disclosure
in Emerging Markets
Although companies have improved their ESG disclosure in recent years, the state of disclosure on
relevant and quantifiable data points remains relatively low. This has been true especially in emerging
markets. Thus, when NAM launched the Emerging Stars Equity Fund in 2011, we found ourselves to
be pioneers in emerging markets ESG investing, and found it difficult to find good information on how
companies were managing material ESG issues in these markets. We also discovered a “disclosure bias”
in which emerging market companies suffered from poor—in some cases, artificially low—ESG ratings
compared to their developed market peers via third-party rating agencies. To augment third-party
ratings viewpoints, we implemented on-site visits as part of our ESG research process through which
our in-house analysts regularly meet with management.5 Thus, we have developed assessments of ESG
performance for emerging markets issuers over time that differ from those of third-party ESG ratings
agencies. Our active ownership and engagement activities not only enhance corporate transparency,
but have also benefited from access to SASB Standards as engagement tools for industries globally.
We believe regulators and exchanges in emerging markets (e.g., China, India, South Africa, Malaysia,
Thailand, etc.) would do well to look to SASB Standards as they pursue encouraging recent initiatives to
establish ESG reporting requirements for listed companies in these markets.
5
Click on the following link to view a summary of our on the ground engagement with Antofagasta, a Chilean-based mining company
https://www.youtube.com/watch?v=dlyrs3LujYA&t=2s.
14 | NORDEA ASSET MANAGEMENT – SASB INTEGRATION CASE STUDYCan a “Responsible Investor” Invest
in a Mining Company?
Can a “responsible investor” invest in a mining company? Our answer is “yes”. We believe Antofagasta, a
company in the mining (copper) industry, can deliver a risk-adjusted return in a sustainable way.
The following example demonstrates how we have integrated SASB Standards into our company analysis
for Antofagasta6, a Chilean-based copper mining company in the Nordea 1 Emerging Stars Equity Fund.
Antofagasta plc is a leading mining group and one of the ten largest copper producers in the world.
It owns interests in and operates four open-pit copper mines in Chile (Los Pelambres [60%-owned];
Centinela [70%-owned]; Antucoya [70%-owned]; and; Zaldivar [50%-owned]).
1. Sustainability of the Business Model: alignment of copper
ESG risk is inherently
with broader sustainability trends... high in this industry,
Copper plays an increasingly important role in the transition to a low carbon economy because of its as indicated by
wide use in rapidly growing market segments, including the electric vehicles (EVs), renewable energy provisional SASB
disclosure topics for
infrastructure, and buildings constructed to meet LEED (Leadership in Energy and Environmental
Metals and Mining
Design) designation. According to some estimates, EVs contain about three times more copper (see Figure 4). NAM
than vehicles powered solely by internal combustion engines, and even more copper is required for considers all disclosure
EV charging stations. Copper also plays a role in the transmission and wiring of renewable energy topics in provisional
infrastructure, such as solar and wind power generation and distribution. Lastly, copper is widely used SASB Standards for
in green building construction due to its corrosion-and oxidation-resistance, its thermal and electrical this industry relevant.
conductivity, and recycled content. It is thus widely used in buildings that aim for a LEED certification.
We therefore see interesting growth opportunities in copper.
… but with high inherent operational risks
The question is then, should one invest in just any copper company? Our answer is an emphatic “no”!
ESG risk is inherently high in this industry, as indicated by provisional SASB disclosure topics for Metals
and Mining (see Figure 4). NAM considers all disclosure topics in provisional SASB Standards for this
industry relevant. When we layer our sector framework and country ESG risk indices (see Figure 5)
over our company-specific analysis, water management, energy management, employee health and
safety and community relations emerge as risks of primary importance for Antofagasta. Chile is a stable,
transparent and well-regulated country from a country-risk perspective. However, copper mines in
Chile are situated in water-challenged regions. Declining ore grades in recent years have led to higher
stripping ratios to simply maintain production, meaning that more water is required to produce each
tonne of copper. On the community relations dimension, numerous large-scale Chilean mining projects
have been delayed or cancelled by local communities due to real or perceived threats to traditional
land uses, biodiversity or natural resource quality; permitting of expansion projects has also grown
increasingly stringent with associated delays. Ultimately, growing scrutiny of these environmental and
social factors in Chile has either directly resulted in delays meeting production targets or risked doing
so, resulting in increased operating costs and capital expenditure for mining companies there.
6
Nordea Investment Management, AB has selected these case studies for illustrative purposes only and is not intended or should interpreted
as a recommendation to purchase or sell such security. The security references may or may not be held in portfolios managed by Nordea
Investment Management, AB and, if such security is held, no representation is being made that such security will continue to be held.
SASB ESG INTEGRATION INSIGHTS | 15Figure 4: Disclosure Topics and Metrics: SASB Metals and Mining Industry Standards
TOPIC ACCOUNTING METRICS UNIT OF MEASURE CODE
Greenhouse Metric tons CO2-e,
Gross global Scope 1 emissions, percentage covered under a regulatory program EM0302-01
Gas Percentage (%)
Emissions
Description of long-term and short-term strategy or plan to manage Scope 1 emissions, emissions
n/a EM0302-02
reduction targets, and an analysis of performance against those targets
Air Quality Air emissions for the following pollutants: CO, NOx (excluding N2O), SOx, particulate matter (PM), mercury
Metric tons (t) EM0302-03
(Hg), lead (Pb), and volatile organic compounds (VOCs)
Energy Gigajoules (GJ),
Total energy consumed, percentage grid electricity, percentage renewable EM0302-04
Management Percentage (%)
Water Total fresh water withdrawn, percentage recycled, percentage in regions with High or Extremely High Cubic meters (m3),
TA04-28-01
Management Baseline Water Stress Percentage (%)
Number of incidents of non-compliance with water-quality permits, standards, and regulations Number TA04-29-01
Waste & Metric tons (t),
Total weight of tailings waste, percentage recycled EM0302-07
Hazardous Percentage (%)
Materials
Management Metric tons (t),
Total weight of mineral processing waste, percentage recycled EM0302-08
Percentage (%)
Number of tailings impoundments, broken down by MSHA hazard potential Number EM0302-09
Biodiversity Description of environmental management policies and practices for active sites n/a EM0302-10
Impacts
Percentage of mine sites where acid rock drainage is: (1) predicted to occur, (2) actively mitigated, and (3)
Percentage (%) EM0302-11
under treatment or remediation
(1) Proven and (2) probable reserves in or near sites with protected conservation status or endangered Metric tons (t),
EM0302-12
species habitat Grade (%)
Community Discussion of process to manage risks and opportunities associated with community rights and interests n/a EM0302-13
Relations
Number and duration of non-technical delays Number, Days EM0302-14
Security, Metric tons (t),
(1) Proven and (2) probable reserves in or near areas of conflict EM0302-15
Human Grade (%)
Rights, and
Rights of Metric tons (t),
(1) Proven and (2) probable reserves in or near indigenous land TA04-30-01
Indigenous Grade (%)
Peoples Discussion of engagement processes and due diligence practices with respect to human rights, indigenous
n/a EM0302-17
rights, and operation in areas of conflict
Employee
(1) MSHA All-Incidence Rate, (2) Fatality Rate, (3) Near Miss Frequency Rate and (4) Average hours of
Health and Rate TA04-31-01
Health, Safety, and Emergency Response Training for (a) full- time employees and (b) contract employees
Safety
Labor Percentage of active workforce covered under collective-bargaining agreements, broken down by U.S. and
Percentage (%) EM0302-19
Relations foreign employees
Number and duration of strikes and lockouts* Number, Days EM0302-20
Business Description of the management system for prevention of corruption and bribery throughout the value chain n/a EM0302-21
Ethics &
Payments Production in countries that have the 20 lowest rankings in Transparency International’s Corruption
Metric tons saleable (t) EM0302-22
Transparency Perception Index
*Note to EM0302-20 – Disclosure shall include a description of the root cause for each work stoppage.
Figure 5: Mining Sector Materiality in the Context of Geographic Exposure
COUNTRY/SECTOR SCORES
Freedom of Association and
Water Stress Energy Security Collective Bargaining Corruption
Sector Exposure
High
High
High
High
Low
Low
Low
Low
Low High Low High Low High Low High
Country Exposure Country Exposure Country Exposure Country Exposure
Source: Based on data from Verisk Maplecroft and SASB Standards.
16 | NORDEA ASSET MANAGEMENT – SASB INTEGRATION CASE STUDY2. Stakeholder Analysis in the Context of SASB Disclosure Topics and Metrics
See Figure 6 for an overview of our analysis of Antofagasta7 on select disclosure topics, with particular
focus on how the company performs on financially-material ESG issues based on SASB-based disclosure.
Figure 6 – Antofagasta Disclosure (Actual vs. Proxy) on Select Disclosure Topics in Provisional SASB
Metals & Mining Industry Standards
2013 2014 2015 2016
Activity metrics
Copper Production (t) 721,200 704,800 630,300 709,400
Direct employees 6098 6609 5950 5427
Contract workers 15,347 19,542 14,892 13,100
Social metrics
Employee Health and Safety
Health and Safety Policy Y Y Y Y
Health & Safety Training Y Y Y Y
Percentage of certified management systems 66.60
Lost Time Injury Frequency Rate 1.90 1.70 2.00 1.50
Near Miss Frequency Rate N/A 7.80 13.50 50.20
Fatalities 2.00 5.00 1.00 2.00
Labour Relations
Major Layoffs No
Fair Remuneration Policy N N N N
Trade Union Representation (%) 62.00 55.00 59.00 68.00
Employee Turnover (%) N/A N/A N/A N/A
Employee Satisfaction (%) 81.00 82.00 N/A N/A
Community Relations and Human Rights
Human Rights Policy Y Y Y Y
Policy Community Involvement Y Y Y Y
Community spending (mUSD) 26.60 31.10 21.90 24.3
Environmental metrics
Environmental Expenditures (USD) 5,500,000 6,200,000 30,100,000 3,700,000
Environmental Provisions (USD) 494,300,000 434,300,000 394,000,000 392,100,000
Energy management
Energy Efficiency Policy Y Y Y Y
Targets Energy Efficiency N/A N/A Y Y
Total Energy Consumption (MWh) 4,665 4,812 4,954 5,842
Renewable Energy Use (%) N/A N/A N/A 17.00
GHG Emissions
CDP Regulatory Risk exposure Y Y Y Y
CDP Physical Risk Exposure Y Y Y Y
Climate Change Policy Y Y Y Y
CO2 Equivalents Emission (Scope 1) (mt) 706,463 693,179 654,146 795,994
CO2 Equivalents Emission Total (Scope 1&2) (mt) 1,620,700 1,506,000 1,412,760 2,000,010
CO2 Emissions Intensity Per Tonne (mining) 3.09 2.98 3.24 3.67
CDP Performance C D D B
Water management
Policy Water Efficiency Y Y Y Y
Total Water Consumption (Th cubic meters) 44,666 47,444 45,247 55,261
Salt Water Withdrawals (Th cubic meters) 20,217 20,682 20,573 26,554
Water recycling rate (%) #N/A N/A N/A 80.00 86.00
Water Consumption per tonne (LpS/kt) 3.56 3.84 4.10 4.59
Company performance disclosed via SASB metrics Proxy used for company performance on SASB metrics
7
Nordea Investment Management, AB has selected these case studies for illustrative purposes only and is not intended nor should be
interpreted as a recommendation to purchase or sell such security. The security references may or may not be held in portfolios managed by
Nordea Investment Management, AB and, if such security is held, no representation is being made that such security will continue to be held.
SASB ESG INTEGRATION INSIGHTS | 17SASB Disclosure Topic: Employee Health and Safety
Safety is still a challenge for the company, but remains a top priority for management.
• Risk exposure: Poor safety records or serious accidents could have a long-term impact on
Antofagasta’s reputation, employee morale, and production. All operations are exposed to
safety risks due to the nature of mining activities. Further exacerbating this risk is the fact that
72% of the total workforce is made up of contractors vs. 28% direct employees, and 60% of the
total workforce lives in nearby regions.
• Risk management: Antofagasta’s safety practices are in line with the industry’s. Safety
performance is reviewed by the Board and is linked with executive remuneration. The
company’s executive team is also required to regularly visit the mining operations as part of
their safety leadership programme. The majority of Antofagasta’s operations are also certified
to the Occupational Health and Safety Standards (OHSAS). Regular training is provided on the
OHSAS 18001 standard, an internationally applied British Standard for occupational health
and safety management systems. Nevertheless, Antofagasta8 has experienced health and safety
challenges, particularly with respect to contractors. We are encouraged by improvements
demonstrated in these areas, such as their Critical Safety Controls verification and “near-miss”
incident reporting.
• Performance trend: Unfortunately, two fatalities were recorded in 2016. The company
is, however, performing better than peers on additional safety KPIs and is showing signs of
improvement.
SASB Disclosure Topic: Water Management
Antofagasta is implementing pioneering technologies to ensure reductions in water use and increases in
water recycling for future operations.
• Risk exposure: Availability of key strategic resources such as water could impact Antofagasta’s
growth opportunities. The Group operates in challenging environments, including the Atacama
Desert, where water scarcity is a key issue. In addition, water demand in the Chilean mining
industry is expected to increase by 66% between 2014-2025. Regulatory requirements to
mitigate mining-related stress on the fresh water supply, such as a mandate to use seawater for
mining activities, are anticipated.
• Strategy and implementation: Antofagasta has demonstrated best practice in terms
of deploying water-saving technologies. Antofagasta was the first mining company to use
thickened tailings technology (increasing water recovery) on a large scale. This practice has
also improved the structural safety of tailings (reduced likelihood of spills vs. traditional
tailings). Antofagasta is also a pioneer in the use of untreated sea water in its mining operations,
with a scope for wider adoption (currently used at Antucoya and Centinela).
• Performance trend: Antofagasta has secured water rights to meet current production levels
and has water recycling and water-use intensity rates that are better than industry averages.
The company already meets and exceeds expected regulatory mandates on the use of seawater
in mining operations. Seawater accounts for nearly 50% of the company’s current total water
use; anticipated regulations requiring the use of 38% seawater for Chilean mining operations
will become effective in 2020. However, Antofagasta’s total water consumption rose in 2016 due
to the integration of new operations into the company’s operational mix.
8
Nordea Investment Management, AB has selected these case studies for illustrative purposes only and is not intended or should interpreted
as a recommendation to purchase or sell such security. The security references may or may not be held in portfolios managed by Nordea
Investment Management, AB and, if such security is held, no representation is being made that such security will continue to be held.
18 | NORDEA ASSET MANAGEMENT – SASB INTEGRATION CASE STUDYSASB Disclosure Topic: Energy Management & GHG Emissions
The company benefits from energy efficiency initiatives and is increasing the share of renewables in its
energy portfolio to address rising energy costs and reduce carbon emissions intensity.
• Risk exposure: Power costs are 15% of Antofagasta’s total operating costs. Energy efficiency
measures have the potential to achieve the company’s strategic goal of controlling costs and
increasing cost competitiveness. The use of seawater and energy-intensity of desalination
however, naturally result in increased energy use. In addition, a carbon tax was implemented
by the Chilean government in January 2017.
• Strategy and implementation: We welcome the approval of Antofagasta’s Climate
Change Standard in 2016, aimed at mitigating climate change vulnerabilities such as higher
temperatures and decreased precipitation in northern Chile, where Antofagasta9 operations
are situated. Antofagasta’s strategy to limit GHG emissions is through improved energy
efficiency and renewable energy sourcing. Energy efficiency initiatives are in place at all sites.
Los Pelambres has secured renewable energy from conveyor belt self-generation as well
as several wind and solar sources. The company aims to source 80% of its energy through
renewables by 2019. That said, as production grows, GHG emissions will rise in the short term.
The Group seeks to de-couple GHG emissions from production growth.
• Performance: 46% of energy use at the Los Pelambres mine, Antofagasta’s flagship mine,
is renewable. Renewable energy currently accounts for 17% of the company’s total energy
consumed. However, energy intensity and CO2 intensities are increasing due to the increasing
use of seawater in mining operations. These intensities are, however, still lower than industry
averages. CDP has upgraded their third-party assessment of Antofagasta’s performance on
climate change up to a B rating.
SASB Disclosure Topic: Community Engagement
A new community engagement model is poised to effectively manage community relations going
forward.
• Risk exposure: Failure to effectively manage community relations could result in delays and
cost overruns for the Group’s development projects and impact the Group’s social license to
operate. The Los Pelambres mine has been the source of local community opposition resulting
in production losses in 2015. The expansion of Los Pelambres has already been delayed by three
years due to environmental permitting issues.
• Strategy and implementation: Antofagasta is securing its licence to operate and reducing
project delays with a new participatory approach to community engagement. This approach
has allowed them to resolve community disputes at Los Pelambres and is now being
replicated across the region. Antofagasta’s new community engagement model systematically
identifies community controversies, challenges, and opportunities together with community
stakeholders, building a shared vision of sustainable local development.
• Performance: Community engagement is still an area where we struggle to find meaningful
metrics. Here, a more qualitative assessment of controversies and the degree to which the
company engages with its stakeholders is necessary. The company has resolved disputes and
secured agreements with the local communities, albeit with some minor opposition.
9
Nordea Investment Management, AB has selected these case studies for illustrative purposes only and is not intended or should interpreted
as a recommendation to purchase or sell such security. The security references may or may not be held in portfolios managed by Nordea
Investment Management, AB and, if such security is held, no representation is being made that such security will continue to be held.
SASB ESG INTEGRATION INSIGHTS | 19You can also read