BRANDS sustainability innovation - CUSTOMERS
←
→
Page content transcription
If your browser does not render page correctly, please read the page content below
CONSUMERS
                                                                                CUSTOMERS

                                                                              culture
                                                                                        excellence
                                                                                        BRANDS
                                                                                        innovation
                                                                                        sustainability

                           Rainbow Chicken Limited Annual Report 2009

                                                                                              ANNUAL REPORT 2009

www.rainbowchicken.co.za
Core Corporate information
CONSUMERS
A significant amount of work has gone into invigorating the core Rainbow products.
The rollout of the new Rainbow logo has ensured better stand-out and differentiation
in-store and is consistent with the drive to provide consumers with a better quality CUSTOMERS
culture
branded chicken offering. excellence
BRANDS
Company registration number: 1966/004972/06
JSE share code: RBW
innovation
ISIN code: ZAE000019063
sustainability Registered office/street address: One The Boulevard
Westway Office Park
Westville 3629
Postal address: PO Box 2734
Westway Office Park
Westville 3635
Transfer secretaries: Computershare Investor Services (Proprietary) Limited
70 Marshall Street
Johannesburg 2001
PO Box 61051
Marshalltown 2107
Company Secretary: JMJ Maher
Auditors: PricewaterhouseCoopers Incorporated
Added value Listing: JSE Limited, South Africa
Sector: Food Producers
Sponsor: RANDMERCHANT BANK (a division of FirstRand Bank Limited)
CONSUMERS
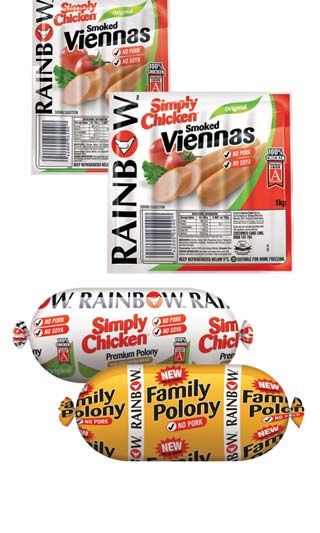
Added value products, over and above the well established FoodSolutions brand include
Rainbow Viennas and Polonies, Rainbow Crumbed, Rainbow Grill and Braai as well as Bankers: ABSA Bank Limited
Farmer Brown Fully Cooked and Tenderbreasts, and have shown tremendous growth, CUSTOMERS Website: www.rainbowchicken.co.za
culture
and now contribute a meaningful percentage to total retail sales. excellence
BRANDS
innovation
sustainability
Contents

                                                                              GOVERNANCE
                                                       STATEMENTS
                                Reporting

                                                        FINANCIAL

                                                                                                      REPORTING
                                  Salient features                                               4

                                  Five-year review                                               5

                                  Definitions, ratios and statistics                             6

                                  Chairman’s report                                              8

                                  Chief executive’s review                                      10

                                  Financial review                                              14

   Rainbow’s vision
  “Rainbow Chicken will be
at the heart of every meal.”

                                                                                                      GOVERNANCE
     We will achieve this by
                                                                               STATEMENTS
                                                                                FINANCIAL
                                Governance
         creating innovative      Directorate                                                   20

solutions and strong brands.      Executive management team                                     22

                                  Corporate governance statement                                24
       Key to our success is      Remuneration report                                           33

      consistent, profitable,    Abridged sustainability report                                 37

       sustainable demand.

                                Financial statements                                            46
                                                                                                      STATEMENTS
                                                                                                       FINANCIAL

                                Shareholders’ information

                                  Ordinary shareholders’ analysis                               84

                                  Shareholder’s diary                                           86

                                  Notice to shareholders                                        87

                                  Salient features of share appreciation rights scheme          89

                                  Form of proxy                                            attached

                                Corporate information                        inside back cover
...to memorable
                                meal occasions

              CONSUMERS

                                                 Namibia
                                                 Distribution facilities   1
                     BRANDS

               CUSTOMERS

          DISTRIBUTION

              PROCESSING

                     BROILER

                     MILLING

    PARENT BREEDER

       GRANDPARENT
           BREEDER

2    Annual report
     2009
                                From farm...
Mpumalanga
                                              Distribution facilities         1
                                              Farms                           9
                                              Hatcheries                      1

          North-West
          Processing plants                    1
          Feed mills                           1
          Farms                               31
          Hatcheries                           1

                              Gauteng
                              Feed mills                          2
                              Distribution facilities             5
                              Farms                              18
                              Hatcheries                          1

                                                                                                                KwaZulu-Natal
                                                                                                                Processing plants                      2
                                                                                                                Feed mills                             1
                                                                                                                Distribution facilities                4
                                                                                                                Farms                                 52
                                                                                                                Hatcheries                             3

                                                    Free State
                                                    Distribution facilities       3
                                                                                      Eastern Cape
Western Cape                                                                          Feed mills                        1
Processing plants                   1                                                 Distribution facilities           3
Feed mills                          1                                                 Farms                             4
Distribution facilities             7                                                 Hatcheries                        1
Farms                              36
Hatcheries                          2

                                                                                                                                          Annual report
                                                                                                                                                  2009     3
Salient features

                              Revenue                 Cash generated by operations
                                 (Rm)                                        (Rm)
                                     6 811
                                                                        821,5
                             5 955

                     4 730                   +14,4%             680,1
                                                                                617,2 594,5   -3,7%
     4 027   4 101

                                                        402,2

      05      06      07      08       09                05      06      07      08     09

                               EBITDA                           Return on net assets
                                 (Rm)                                           (%)

                             916,7                              36,7
                                                                        35,2    34,7

             687,6
                     772,3
                                             -37,5%     26,6
                                                                                              -16,9%
                                     573,1

                                                                                       17,8
     393,3

      05      06      07      08      09                 05      06      07      08     09

                      HEPS - diluted                            Dividends per share
                             (cents)                                        (cents)
                                                                        68,0    68,0   68,0
                             180,8
                     164,4                                      57,0
             140,2                           -39,4%
                                     109,6
                                                        30,5
      75,0

      05      06      07      08       09                05      06      07      08     09

4    Annual report
     2009
Five-year review
R’000 2009 2008 2007 2006 2005
GROUP BALANCE SHEETS
ASSETS
Property, plant and equipment 1 383 196 1 243 670 1 054 124 962 194 850 318
Trademarks 404 1 205
Goodwill 287 444 287 444 287 444 287 444 287 444
Deferred taxation 5 796 15 285 16 023
Current assets 2 502 325 2 302 110 1 738 724 1 495 747 1 047 016
Total assets 4 178 761 3 833 224 3 095 577 2 745 789 2 202 006
EQUITY AND LIABILITIES
Ordinary shareholders’ equity 2 485 910 2 337 130 1 920 889 1 595 901 1 286 706
Deferred taxation 243 709 240 041 179 606 168 519 180 082
Retirement benefit obligations 85 655 80 862 75 535 69 683 63 677
Finance lease liability – long-term 116 651
Current liabilities 1 363 487 1 175 191 919 547 911 570 670 890
Total equity and liabilities 4 178 761 3 833 224 3 095 577 2 745 789 2 202 006
GROUP INCOME STATEMENTS
Revenue 6 811 448 5 955 327 4 730 363 4 101 454 4 026 998
Operating profit before non-recurring items and depreciation 549 268 925 808 772 315 687 588 393 298
Legal disputes provision release 23 800
Feed claim recovery 40 000
BEE charge (49 368)
Operating profit before depreciation 573 068 916 440 772 315 687 588 393 298
Depreciation (149 229) (136 426) (118 181) (109 744) (78 036)
Operating profit 423 839 780 014 654 134 577 844 315 262
Finance costs (5 059) (2 566) (2 714) (2 351) (1 126)
Finance income 22 875 34 248 25 179 9 930 28 146
Profit before taxation 441 655 811 696 676 599 585 423 342 282
Taxation (124 203) (272 730) (202 354) (186 578) (111 959)
Attributable profit 317 452 538 966 474 245 398 845 230 323
Annual report
2009 5Definitions, ratios and statistics
SHAREHOLDERS’ RATIOS
Headline earnings per share – diluted Headline earnings divided by diluted weighted average ordinary shares in issue
Adjusted headline earnings per share – diluted Headline earnings adjusted for non-recurring items (legal disputes provision release and
additional taxation allowance in 2009, and feed claim recovery and BEE expense in 2008)
divided by diluted weighted average ordinary shares in issue
Diluted dividend cover Diluted headline earnings per share divided by dividends per share
Net asset value per share Ordinary shareholders’ equity divided by ordinary shares in issue at year-end
BALANCE SHEET INFORMATION
Total assets Non-current and current assets
Total liabilities Non-current and current liabilities
Net assets Total assets less total liabilities
INCOME STATEMENT INFORMATION
Headline EBITDA margin Earnings before interest, taxation, depreciation and headline adjustments (before taxation)
expressed as a percentage of revenue
Operating profit margin Operating profit expressed as a percentage of revenue
SOLVENCY AND LIQUIDITY
Return on assets managed (excluding cash) Operating profit expressed as a percentage of total assets (excluding cash)
Return on assets managed Profit before taxation expressed as a percentage of total assets
Return on net assets Profit before taxation expressed as a percentage of net assets
Asset turn Revenue divided by total assets
Return on equity Attributable profit expressed as a percentage of average total equity
SHARE INFORMATION
PE ratio Market share price at year-end divided by headline earnings per share
6 Annual report
20092009 2008 2007 2006 2005
SHAREHOLDERS’ RATIOS
Headline earnings per share – diluted cents 109,6 180,8 164,4 140,2 75,0
Adjusted headline earnings per share – diluted cents 94,6 188,0 164,4 140,2 75,0
Dividends per share cents 68,0 68,0 68,0 57,0 30,5
Diluted dividend cover times 1,6 2,7 2,4 2,5 2,5
Net asset value per share cents 853,3 805,9 679,5 571,6 467,1
BALANCE SHEET INFORMATION
Total assets Rm 4 179 3 833 3 096 2 746 2 202
Total liabilities Rm 1 693 1 496 1 175 1 150 915
Net assets Rm 2 486 2 337 1 921 1 596 1 287
Number of employees at year-end 7 416 7 653 7 223 6 686 6 375
INCOME STATEMENT INFORMATION
Headline EBITDA margin % 8,4 15,1 16,4 16,8 9,2
Operating profit margin % 6,2 13,1 13,8 14,1 7,8
Headline earnings Rm 318,8 528,1 477,0 400,3 211,0
Adjusted headline earnings Rm 275,2 549,0 477,0 400,3 211,0
SOLVENCY AND LIQUIDITY
Return on assets managed (excluding cash) % 11,6 23,5 26,1 24,6 15,0
Return on assets managed % 10,6 21,2 21,9 21,3 15,5
Return on net assets % 17,8 34,7 35,2 36,7 26,6
Asset turn times 1,6 1,6 1,5 1,5 1,8
Return on equity % 13,2 25,3 27,0 27,7 18,7
SHARE INFORMATION
Number of ordinary shares
– weighted average in issue ‘000 290 904 288 951 281 393 277 096 273 387
– diluted weighted average in issue ‘000 290 904 292 028 290 118 285 558 281 275
– at year-end ‘000 291 320 290 004 282 712 279 222 275 449
Market share price
– at year-end cents 1 545 1 435 1 660 950 650
– highest cents 1 680 2 000 1 690 1 030 795
– lowest cents 1 150 1 401 920 610 495
Number of shares traded ‘000 21 716 73 154 71 345 44 200 57 696
Value of shares traded Rm 308,1 1 121,5 899,1 372,3 359,0
Total transactions ‘000 3 480 7 633 9 224 5 248 5 897
Volume of shares traded as a percentage of issued shares % 7,5 25,2 25,2 15,8 20,9
PE ratio 14,1 7,9 9,8 6,6 8,4
Annual report
2009 7Chairman’s report
PERFORMANCE
Rainbow’s results for the year ended 31 March 2009 reflect a good underlying performance taking into
account the exceptionally high input costs experienced during this period. Rainbow’s differentiated
strategy has now been tested in a very difficult trading environment and the benefits evident in the
current period’s results reinforce it as the appropriate strategy in what is otherwise a predominantly
commodity market.
Rainbow’s cost of production has been significantly impacted by the key commodities of maize, soya and
oil trading at record highs. The subsequent and even more rapid decline in commodity prices added
further volatility to an already challenging raw material procurement environment. Whilst chicken pricing
improved in the latter part of calendar 2008, margins have reduced and remain under pressure.
BEE TRANSACTION
Rainbow’s BEE transaction was concluded on 30 July 2008. Rainbow provided vendor financing for the
15% shares issued to the consortium comprising Imbewu Consortium, Ikamva Labantu, Rainbow
employees and Mrs M Nhlanhla, a non-executive director of Rainbow. The BEE transaction is an
important component of Rainbow’s overall transformation process. Details of the transaction are disclosed
in the notes to the annual financial statements.
CORPORATE GOVERNANCE
Rainbow complies fully with the letter and spirit of good corporate governance. The skills and diversity of
the Board are well matched to Rainbow’s needs and are reflected in the allocation of responsibilities to
members of the various sub-committees. Rainbow endorses the principles of integrity, accountability,
transparency and social responsibility and fully complies with the JSE Listings Requirements and King II.
During the current year, a comprehensive review of the Group’s governance, assurance and risk
management practices was performed. As a consequence certain roles, structures and committee
mandates were enhanced to strengthen governance within the Group.
Following the implementation of the BEE transaction, with effect from 31 July 2008, Gcina Zondi was
appointed as a non-executive director. Deon Zwiegelaar retired from the Board on 19 November 2008
and Roy Smither and Pieter Louw were appointed on 1 December 2008.
SUSTAINABILITY
Rainbow remains committed to the three pillars of sustainability covering economic, social and
environmental practices. Rainbow believes that commitment to stakeholders is fulfilled only through
enduring, productive relationships with other stakeholders and by establishing a reputation as a trusted
company in touch with the evolving needs and aspirations of our society. As a consequence, time, effort
and money are invested in responding to the needs of all current and prospective stakeholders.
DIVIDEND DECLARATION AND POLICY
The Board declared dividends totalling 68,0 cents per ordinary share in respect of the twelve months
ended 31 March 2009. By virtue of the lower earnings the total dividend for the year is 1,6 times covered
by fully diluted headline earnings per share (2008: 2,7 times). It is the Board’s intention to restore the
dividend cover range to between 2,0 and 2,5 times over a period of time.
PROSPECTS
Considering the global economic recession and its spill-over impact locally, consumer spending is
expected to remain under pressure.
Maize prices are likely to remain at lower levels and continue to trade around export parity. Soya prices
are likely to remain under pressure due to lower anticipated crops, the threat of further strikes in
Argentina and continued exchange rate volatility. By virtue of Rainbow’s forward procurement policy,
8 Annual report
2009feed prices are only expected to be meaningfully lower in the second six months of the 2010 Adjusted headline earnings
financial year. (pre IAS 39) (Rm)
The lower anticipated feed prices and benefit of the unrealised procurement losses booked in
524,6
2009 are likely to have a favourable impact on earnings for the 2010 financial year. 487,1
ACKNOWLEDGEMENTS 385,5
Rainbow is a complex business that relies on and impacts many people in both business and 355,2
society. In a challenging environment Rainbow has maintained stringent financial disciplines and
230,0
certainly on a relative basis, performed well. This would not have been possible without the
dedication and support at every level of the business from directors, management and staff.
I thank each one of you and look forward to your continued support.
05 06 07 08 09
MH Visser
Non-executive Chairman
Annual report
2009 9Chief executive’s review
OVERVIEW
The past year has been extremely difficult for Rainbow, the South African poultry industry and both the
local and global economy but despite all of the challenges, Rainbow has managed to deliver a very
acceptable overall performance, particularly on a relative basis.
Rainbow’s consumer focused strategy, seeking differentiation in the marketplace and improving service
delivery through its integrated supply chain, has translated into this year’s credible financial performance.
Significant input cost pressures continue to challenge the poultry industry. Food and energy inflation has
driven general inflation and, combined with higher interest rates, has placed pressure on consumers. In
response the business has and will continue to challenge every aspect of our operations to find further
efficiencies and cost-effective solutions.
Revenue has grown to R6,8 billion, up 14,4% on the previous year, largely as a function of the higher
chicken realisations.
Rainbow’s results for the twelve months ended 31 March 2009 reflect a headline earnings decline of
39,6%. However, excluding the
significant unrealised losses on Feed cost vs adjusted headline EBIT pre IAS 39
financial instruments used in the (Rm)
feed raw material procurement 3 000 +34%
strategy, the decline moderates 2 500
to only 14,8%. +42%
2 000
Rainbow’s performance has been 1 500
impacted by a second year of 1 000 +R69
+R185
significant feed cost increase 500
which could not be fully 0
recovered in chicken realisations. 05 06 07 08 09
Feed prices have increased 34% Feed cost Adjusted headline EBIT pre IAS 39
over the past financial year. The
graph depicts the feed cost increase and consequent impact on headline EBIT (adjusted for non-recurring
items) over the past five financial years.
POULTRY INDUSTRY
The poultry industry has experienced one of its most challenging years in the last decade. There have
been unprecedented increases in feed prices, mostly brought about by international markets. The
influence of higher inflation and interest rates also contributed negatively to the industry’s performance
with many poultry producers making losses, or at best marginal profits.
The poultry industry remains a significant segment of South African agriculture, being approximately 20%
of all agricultural production,
Estimated per capita consumption of broiler meat
43% of animal products and (kilograms per capita)
61% of animal protein
consumed in South Africa. 29,6 30,0
25,8
The graph depicts the history of 21,7 23,1
20,1 21,1
19,7 18,9
per capita consumption of
broiler meat since 2000,
increasing 1,2% from calender
2007 to 2008.
The local chicken market is 00 01 02 03 04 05 06 07 08
estimated to have grown by
10% in rand value in the past twelve months to R17,7 billion. Total chicken imports (excluding turkey and
mechanically deboned meat) have decreased by approximately 33% to March 2009, largely due to the
weakening of the rand, overseas suppliers diverting product into other more profitable markets and the
effect of the significant capacity expansion locally. The graph depicts the history of imported poultry
10 Annual report
2009products split between chicken, turkey and mechanically Poultry imports
deboned meat. 289 (tons)
279
The poultry industry’s petition to oppose the International
225
Trade Administration Commission’s proposed scrapping of the 84 206
198
US anti-dumping tariff is ongoing. 35 98
156 69 37
STRATEGIC FRAMEWORK 169
60 24
144 81
Rainbow’s vision “Rainbow Chicken will be at the heart of 112 47 27 132
29
every meal” is underpinned by the five strategic drivers 29 111
73 39 96
reflected in the “strategy house” below which provides the 16 80
34 57
strategic framework for the business. 12
27
Rainbow’s entire leadership team, approximately 280 people, 02 03 04 05 06 07 08 09
participate in a process called the “Good to Great” journey Chicken products Turkey products Mechanically deboned meat
aimed at jointly defining Rainbow’s strategy and aligning the
business and its people behind the company vision. In March
each year, the leadership team, representing all functional and operational areas of the business, defines
and agrees the detailed strategic action plans for the forthcoming year. The journey has galvanised and
empowered the leadership team, provided strategic clarity and given significant impetus to the strategic
effort in the business. The journey process will be rolled out to the balance of the business over time.
Capacity continues to be built in the organisation in the form of people, brands and assets. Putting
“strategy into action” continues to empower management to achieve the aspirational targets as well as
deal with challenging situations as currently being faced by the business. Talent management has
received much greater focus and resulted in far better identification, development and retention of the
next levels of leadership.
Vision Strategic framework
Rainbow Chicken will be at the heart of every meal.
We will achieve this by creating innovative solutions and strong brands.
Key to our success is consistent, profitable, sustainable demand.
The single reason Our partners in reaching Excellence gives Investing responsibly The right team
we exit our consumers us fuel for growth for growth
Insight into consumers’ Our brands will be An integrated supply To ensure sustainability Build a community of
needs inspires within easy reach of chain will deliver and future growth inspirational people
innovative solutions, our consumers, and we service excellence by we will continue to with a common
sustained by our strong will make the chicken converting the right invest responsibly purpose, seeing and
brands, that delight category exciting to birds, at the lowest with all stakeholders doing things
and satisfy. customers and their cost, at the right time in mind. differently.
shoppers. into the optimal mix.
Annual report
2009 11Chief executive’s review continued
REVIEW OF OPERATIONS
Brands
Rainbow’s strategic focus on innovation, differentiation and communication continues to prove
successful. Rainbow’s brand strategy, which differentiates the company from its competitors, has been
effective in delivering an acceptable margin of 8,1% during a period of extreme input cost pressure.
The Rainbow range of products can be classified as “core” and “added value”. A significant amount of
work has gone into invigorating the core Rainbow products. The rollout of the new Rainbow logo has
ensured better stand-out and differentiation in-store and is consistent with the drive to provide
consumers with a better quality branded chicken offering.
Added value products, over and above the well established Rainbow FoodSolutions brand include
Rainbow Viennas and Polonies, Rainbow Crumbed, Rainbow Grill and Braai as well as Farmer Brown Fully
Cooked and Tenderbreasts and have shown tremendous growth, and now contribute a meaningful
percentage to total retail sales. The focus on driving growth in the added value portfolio has resulted in
Rainbow Simply Chicken Polony becoming the market leader in the polony sector. This is remarkable given
that market leadership has been achieved in just over three years since launch and in a very competitive
category, previously dominated by well established brands.
The foodservice sector has grown from 29% of total revenue in 2004 to 39% in 2009. This sector is
regarded as added value as most of the products supplied are customised to the foodservice market
requirements and sold under the Rainbow FoodSolutions brand. The retail sector’s contribution to total
revenue has grown from 25% in 2004 to 32% in 2009.
Rainbow’s added value focus in the retail sector has resulted in its component of retail revenue increasing
from 4% in 2004 to 21% in 2009.
Going forward Rainbow will continue to drive innovation across
Revenue contribution by channel
both the core and added value portfolios. Additional production
(%)
2004 2009 capacity is being commissioned in the 2010 financial year to
meet future demand.
Retail
25 Wholesale After five years of double digit growth, the foodservice channel
29 chains 32
39 has slowed in reaction to the prevailing economic conditions.
Wholesale Declining same store growth at certain major Quick Service
16 independents
30 12 Restaurants (QSRs) has put pressure on suppliers to reduce
Foodservice 17
costs and investigate cheaper alternatives. Whilst the
foodservice channel volumes were disappointing, Rainbow has
increased its volumes of further processed products and
identified new customer opportunities.
Strong customer relationships, service excellence and focus on
Retail sector: Core vs added value developing insightful product solutions will remain the
(%) cornerstone of the FoodSolutions brand proposition. The
2004 2009
FoodSolutions generic branded category has performed well
4 and will continue to drive Rainbow’s strategic distribution and
21 sales partnerships. A strong added value new product plan will
Core be rolled out and supported through focused marketing
Value added activities and investment in customer development. New
96 79 foodservice sector and product category opportunities will also
be investigated and targeted depending on the size of prize
and our ability to offer added value solutions at sustainable
margins and volumes.
Supply chain
Agricultural performance during the winter months improved on last year despite the higher than normal
incidence of disease in the industry and the particularly cold winter experienced in some areas.
12 Annual report
2009Performance challenges were however experienced during the early summer months, particularly in the
Cape. The agriculture teams remain focused on producing the right bird at the lowest cost to ensure that
Rainbow’s weight sensitive product mix can be produced most profitably.
The feed operation is a critical element of Rainbow’s overall cost chain and its strategic priorities
remain cost-effective procurement, milling efficiency, targeting external business to utilise excess
capacity and working with agriculture to achieve the lowest cost (c/kg) of chicken. Feed experienced
difficult trading conditions and was less successful than prior years in selling its excess capacity profitably.
In response to the significant feed cost increases over the past two years, the agriculture and feed
management teams have collaborated in challenging the current feed specification and where possible
reformulated diets to derive a lower feed cost at an acceptable performance level.
The processing plants continue to maintain the high degree of flexibility required to deliver the exciting
list of new products and to meet the significant growth experienced on certain product lines. Costs have
been well contained and yield and efficiency improvements have been successful with more
improvements expected. The successful ISO 22000 recertification of all four processing plants
epitomises the focus and drive on food safety and product quality.
Rainbow’s outbound supply chain has been streamlined by the completion of the new plant-based
cold storage facility at Hammarsdale which Vector manages. Vector is in the process of taking over
management of the other existing plant-based cold stores at Rustenburg and Worcester. This change
means that Vector effectively manages Rainbow’s total outbound supply chain from plant to customer,
which allows for full business visibility, process efficiency and integration benefits.
Vector Primary Transport, which commenced in August 2007 to mitigate risk for Rainbow and McCain,
extended this service offering during the current year to I&J and Willowton. Vector also entered into new
distribution contracts with Famous Brands (Wimpy and FishAways) and Pieman’s Pantry during the
current year.
IT infrastructure
Rainbow has made further progress with the implementation of its IT and Enterprise Resource Planning
strategy. An increased focus has been placed on supply chain excellence and customer service initiatives.
The leveraging of our IT systems remains a key enabler within the business with specific emphasis on the
analysis of customer and product profitability.
CHANGE IN EXECUTIVE MANAGEMENT TEAM
During the current year Michael Rogowski resigned as the Feed Director. His prior responsibilities are
being shared amongst the appropriate directors, in line with the functional structure of the balance of the
business.
CONCLUSION
Rainbow’s transformation to a consumer-focused business is well underway and coupled with the “Good
to Great” journey positions the business well for the future. I would like to express my appreciation to
our employees for their valued commitment to realising Rainbow’s strategy, especially considering the
difficult market conditions experienced this year. My appreciation also extends to fellow Board members,
valued customers and shareholders for their ongoing support. We are committed to realising our strategy
for the benefit of all Rainbow’s stakeholders.
M Dally
Chief Executive Officer
Annual report
2009 13Financial review
Financial highlights – Statutory 2009 2008 %
Revenue Rm 6 811,4 5 955,3 14,4
Headline EBITDA Rm 575,8 901,0 (36,1)
Net finance income Rm 17,8 31,7 (43,8)
Effective taxation rate % 28,1 33,6 5,5
Headline earnings Rm 318,8 528,1 (39,6)
Adjusted headline earnings Rm 275,2 549,0 (49,9)
Headline earnings per share cents 109,6 182,8 (40,0)
Adjusted headline earnings per share cents 94,6 190,0 (50,2)
Fully diluted headline earnings per share cents 109,6 180,8 (39,4)
Capital expenditure Rm 293,1 315,5 7,1
Return on equity % 13,2 25,3 (12,1)
Cash generated by operations Rm 594,5 617,2 (3,7)
Dividends per share cents 68,0 68,0
Financial highlights – Operational (pre IAS 39) 2009 2008 %
Headline EBITDA Rm 729,0 866,6 (15,9)
Adjusted headline earnings Rm 385,5 524,6 (26,5)
Adjusted headline earnings per share cents 132,5 181,5 (27,0)
OVERVIEW AND MARKET CONDITIONS
Economy
The third quarter of calendar 2008 will be remembered as one of the most tumultuous periods in the
history of modern capital markets. Global equity markets collapsed by over 40%, credit markets froze,
housing prices continued to decline and central bankers extended their lending facilities beyond what
would have been imaginable only months before.
Although South Africa has to a large extent escaped the direct impact of this financial market turmoil, the
indirect effects of the global recession are already becoming evident. News on inflation (CPI) is more
favourable. Having peaked at 13,6% in August 2008 a downward trend is now in place with inflation
falling back to 8,5% in March 2009. This fall has been underpinned by a moderation in food price
inflation from a high base and the decline in domestic fuel prices. Prime lending rates have been lowered
over the past few months providing some much needed respite for indebted consumers.
Feed raw material procurement
Feed raw material prices peaked at historically high levels during the past twelve months and remain
exceptionally volatile. Record high prices across all commodities were reached, followed by the credit
crunch and then an even more rapid fall in commodity prices. The global recession and fundamentals
behind key raw materials indicate that further price reductions are possible along with continued
volatility. This, together with the exchange rate volatility, has translated into significant challenges for raw
material procurement. Despite these difficult market conditions Rainbow has applied its feed raw material
procurement strategy consistently.
14 Annual report
2009Maize
Nearby maize prices on SAFEX have been declining since their peak in July 2008.
The global financial crisis caused a dramatic decrease in the demand for maize, improving the previously
dangerously low US and global maize stock situations to such an extent that international prices have
fallen sharply from their record levels last year.
The local Crop Estimates Committee (CEC) estimates the SAFEX yellow maize
hectares of maize planted this season at 2,5 million. After a dry (R/ton)
2 400
start during the latter part of 2008, conditions improved 2 250
dramatically, resulting in the final official estimate of 2 100 +32%
1 950
11,2 million tons during February 2009. This will again result in 1 800
a surplus of approximately 2,4 million tons (after allowing for 1 650
-2%
1 500
exports of approximately 1,8 million tons). With the expected 1 350
surplus, local prices are expected to remain at export parity. 1 200
1 050 2007 2008 2009
The graph on the right depicts the nearby SAFEX yellow maize 900
price over Rainbow’s past three financial years.
Soya
The projected carry-out soybean stock to use ratio (September
2009) in the USA is 7,1% and is predicted to increase to
12,4% by September 2010. The world financial crisis has CBOT soybean price
reduced the demand for beans, hence increasing stock levels. (US$/ton)
450
The only possible negative factor on soybean pricing at present 400 +51% +15%
350
is the political stand-off between the Argentine government and
300
the farmers, which is limiting exports from Argentina. The 250
farmers have large quantities of old season beans and with the 200
new season harvesting period imminent they will be forced to 150
100
start selling, which could depress pricing. 50 2007 2008 2009
0
The graph on the right depicts the CBOT soybean US$ price
over Rainbow’s past three financial years.
Rand/US$ exchange rate
There has been significant volatility in the exchange rate over the
past six months. All major banks forecast this to continue for the
remainder of calendar 2009. The banks have had divergent R/US$ exchange rate
views on the long-term prospects of the rand, with some banks 10,5
10,0 +23%
predicting a strengthening of the rand over the next 18 to 24
9,5
months and others predicting a moderate weakening. The rand 9,0
8,5
has strengthened significantly post year-end. 8,0
+12%
7,5
As Rainbow’s entire soya requirements are imported 7,0
(approximately 34% of feed cost), the exchange rate 6,5
6,0
depreciation during the current financial year has had a 5,5 2007 2008 2009
5,0
material impact on feed cost.
The graph on the right depicts the R/US$ exchange rate over
Rainbow’s past three financial years.
Annual report
2009 15Financial review continued
Revenue INCOME STATEMENT
(Rm) Revenue
1 444 Rm 2009 2008 %
1 377
5 368 Chicken 5 367,9 4 578,5 17,2
963 4 579
Other sales 746 767 Other sales 1 443,5 1 376,8 4,8
3 767
Chicken revenue 3 281 3 335 Reported revenue 6 811,4 5 955,3 14,4
Chicken revenue for the year was 17,2% higher than the previous year. Rainbow’s average price
05 06 07 08 09 realisations increased by 15,2% and despite two less trading days (0,8% impact) volumes were
2,0% higher.
Group revenue increased by 14,4% to R6,8 billion (2008: R6,0 billion), largely a function of the
higher chicken realisations.
Headline EBIT Headline EBIT
14,1 14,2 The graph below depicts headline EBIT from a statutory perspective and
13,0
13,9 adjusted for both non-recurring items and unrealised gains or losses on
12,6 12,4
financial instruments used in the feed raw material procurement strategy.
7,9 740 774 8,1 The non-recurring items include a provision release in respect of the
671 657
7,2 settlement of certain legal disputes (R23,8 million) in 2009 and the feed
578 555 5,9
515 claim recovery
401 (R40,0 million) and BEE expense (R49,4 million) in 2008.
317 290
Reporting the financial effects of certain financial instruments used in the
feed raw material procurement strategy introduces volatility to the
Group’s financial results. For the year under review, the pre-taxation
05 06 07 08 09 impact on the Group’s results of these unrealised positions is a negative
impact of R153,2 million (2008: R34,4 million positive).
Pre IAS 39 Rm Post IAS 39 Rm
Pre IAS 39 % Post IAS 39 % The decline in headline EBIT margin is in line with the forecast made at
the previous year-end and reflects the 34% feed cost increase not being
entirely recovered in chicken pricing.
Finance income
Net finance income decreased by R14,0 million due to the lower cash balances during the period.
Taxation rate and headline earnings Effective taxation rate
33,6 Rainbow Chicken Foods, the company owning the Further Processing Plant, was approved by the
32,7 Minister of Trade and Industry as a qualifying strategic industrial project with preferred status.
Effective tax rate 31,9
(%) The company’s preferred status grants an additional taxation allowance of 100% of the cost of
29,9
qualifying industrial assets. The preferred status was subject to the company maintaining certain
525 28,1 performance criteria set out in the approval, failing which the allowance would reduce to 50% of
487
the cost. Deferred taxation was previously recognised based on 50% of the additional taxation
386
355 allowance. Management is satisfied that all performance criteria have now been met, and
consequently the remaining portion of the additional allowance has been recognised in the
230
Adjusted current year (R26,5 million).
HE pre IAS 39
(Rm) The effective taxation rate of 28,1% (2008: 33,6%) is lower as a result of the additional taxation
allowance referred to above, offset by the higher STC charge on the increased interim dividend
05 06 07 08 09
resulting from the BEE shares issued during the year.
Adjusted headline earnings
Adjusted headline earnings (pre IAS 39) decreased by 26,5% to R385,5 million
(2008: R524,6 million) with adjusted headline earnings per share (pre IAS 39) reducing by
27,0% to 132,5 cents per share (2008: 181,5 cents per share).
16 Annual report
2009BALANCE SHEET
Non-current assets
Property, plant and equipment of R1 383,2 million (2008: R1 243,7 million), goodwill of R287,4 million
(2008: R287,4 million) and a deferred taxation asset of R5,8 million (2008: Rnil) represent the Group’s
non-current assets.
Capital expenditure was R293,1 million (2008: R315,5 million), predominantly spent on plant and Capex spend and depreciation
machinery. A detailed reconciliation of the movements in property, plant and equipment is shown (Rm)
in note 1 on page 63. A further amount of R92,7 million (2008: R94,2 million) has been 149
136
contracted and committed, but not spent, whilst a further R109,2 million (2008: R119,3 million) 110 118
has been approved, but not contracted. The Group continues to follow a policy of upgrading its 78 315
293
Depreciation
facilities and funding normal levels of replacement capital expenditure from its own resources.
221 214
200
As mentioned above, the remaining 50% of the additional taxation allowance was recognised in
Capex spend
the current year as management is satisfied that all performance criteria have now been met.
As a consequence, a deferred taxation asset has been raised in Rainbow Chicken Foods
(Proprietary) Limited.
The detailed disclosure of the reconciliation of deferred taxation is disclosed in note 3 on page 66. 05 06 07 08 09
Current assets
Inventories and biological assets of R973,5 million (2008: R891,2 million) have increased mainly due to
the impact of the higher feed costs on both the valuation of the live birds and finished goods stock.
Trade and other receivables are also higher than last year due to the higher chicken realisations. Debt
collection is a critical part of the business and is an ongoing focus area for management. Debtors days
have remained consistently good over the past few years and there has been a further improvement in
the debtors ageing in the past year.
Non-current liabilities
The deferred taxation of R243,7 million (2008: R240,0 million) arises from numerous temporary
differences across the Group.
The post-retirement medical obligation of R85,7 million (2008: R80,9 million) arises from the actuarial
valuation of the Group’s potential liability arising from post-retirement medical aid contributions in
respect of current and future retirees. This liability is unfunded. The obligation of the Group to pay
medical aid benefits after retirement is no longer part of the conditions of employment for Rainbow
employees engaged after 1 October 2003 and for Vector employees engaged after 1 January 1997. The
Group has an unrecognised actuarial loss of R18,3 million (2008: R10,1 million gain) which arises mainly
due to differences in the actuarial assumptions from year to year. This actuarial loss will be recognised to
the extent that it is in excess of ten percent of the obligation over the remaining working lives of the
participating employees.
Current liabilities
Trade and other payables have increased over the prior year in line with increased inventories and
biological assets to R1 329,8 million (2008: R1 126,2 million).
Provisions have reduced to R17,5 million (2008: R43,3 million) due to settlement having been reached in
respect of legal disputes that have been in progress against the Group for some years. The settlement
amounts were paid subsequent to year-end.
Return on equity
Return on equity decreased to 13,2% (2008: 25,3%).
CASH FLOW STATEMENT
Cash generated by operations decreased by 3,7% to R594,5 million (2008: R617,2 million) by virtue of
the lower trading results and lower non-cash items as a result of the impact of the BEE transaction in the
prior year (R49,4 million). Inventories and receivables have been impacted by the higher feed costs,
however, underlying days cover is marginally improved on the previous year.
Annual report
2009 17Financial review continued
2009 Cash flows Cash taxation paid of R115,8 million (2008: R239,6 million)
(Rm) is lower than the prior year due to the lower trading profits
generated.
573,0
509,9 528,1 RISK MANAGEMENT
The Group follows a detailed process whereby operational
and financial risks are identified and quantified.
Probabilities of events taking place which result in any of
these risks occurring are determined and then responsibility
21,6 Taxation 17,8 Capex 3,0 Dividends 9,5 is assigned to the various members of the executive
Opening Working Interest Proceeds EBIT& Share Closing management team to manage these risks appropriately.
balance capital Depreciation options balance
(115,8) Risk reviews are proactive in not only determining negative
(197,8)
areas but also identifying areas of opportunity where
(293,1)
effective risk management can be turned into competitive
advantage.
Operational risk
At operational level, senior management identify critical business risks, promote awareness, introduce and
maintain appropriate control environments and procedures and apply risk-monitoring techniques.
Meetings are held regularly within each business function to update, re-assess and comment on the risks
identified as well as give assurances on controls in place to mitigate the risks identified.
The table below provides a brief description of the key operational risks to which the Group is exposed
and the mitigating controls in place to manage these risks.
In support of this risk management structure, the Group is working with risk management consultants to
undertake regular risk control audits at all of the Group’s sites. These audits include:
• Risk management organisation
• Fire defence
• Independent “Infrared Inspection of Electrical Equipment under Load” (IRIS)
• Site security
• Emergency planning
• Occupational health, safety, hygiene and environment
• Bio-security.
Operational risk Mitigating controls
Disease outbreak at farms Bio-exclusion procedures in place (physical access controls, shower procedures, site clothes,
foot dip tanks, vehicle sprays at key sites, insulated houses, trained employees)
Testing flocks every month for Avian Influenza, Newcastle, Salmonella and Infectious Bronchitis
Significant increase in feed raw material costs Proven raw material procurement strategy
Comparison of raw material prices to daily market prices with weekly reporting to a
procurement committee
Monthly raw materials meeting to discuss procurement strategy and prices
Authorisation of formulation changes
Succession planning for key positions
Dust explosion at a mill Training of personnel in conditions that lead to dust explosions
“Hot work” permits
Good housekeeping to minimise dust
Good maintenance programme
Fire in plant Fire hydrants and sprinkler systems
CO2 systems for electrics
Fire teams and training
Fire alarms and smoke detectors
New panels are fire retardant
Flammable substances separately stored
18 Annual report
2009Financial risk
The Group's financial instruments consist primarily of cash resources with financial institutions,
derivatives, accounts receivable and payable and interest-bearing debt. In the normal course of business,
the Group is exposed to credit, interest, liquidity and market risk. In order to manage these risks, the
Group may enter into transactions which make use of derivatives. They include forward exchange
contracts, options, interest rate swaps and commodity futures and options. Separate committees are used
to manage the risks and the hedging activities of the Group. The Group does not speculate in or engage
in trading of derivative instruments.
Credit risk
The granting of credit is controlled by well established criteria which are reviewed on an annual basis.
Other than the external feed debtors, all trade receivables greater than R75 000 are covered by Credit
Guarantee Insurance Cover (CGIC).
Liquidity risk
Liquidity risk is considered low due to the Group’s conservative funding structure and its high cash
generation. Its unutilised borrowing capacity is R345 million (2008: R345 million). Due to the dynamic
nature of the underlying businesses, the Group maintains flexibility in funding by maintaining availability
under committed credit lines. Management monitors rolling forecasts of the Group's cash and cash
equivalents on the basis of expected cash flow.
Market risk
Commodity price and procurement risk
To stabilise prices for the Group’s substantial commodity requirements, derivative instruments, including
forward contracts, commodity options and futures contracts, are used to hedge its exposure to commodity
price risk. The overall procurement strategy and net positions are reported monthly to the Board and an
oversight committee. The oversight committee is responsible for the setting of the monthly company view
with regard to future price movements. The daily transacting by the procurement team is restricted in
terms of this company view, unless prior approval is obtained.
Maize and soya procurement are material components of Rainbow’s input costs and as a consequence
significant focus is placed on managing this area of the business. The maize procurement policy
specifically permits ±30% pre-season purchases, ±30% through options and futures and the remaining
±40% using spot purchases.
Currency risk
Currency risk in the Group is actively managed using forward exchange contracts and currency option
contracts in terms of the risk management policy. The currencies predominantly traded by the Group are
USD, GBP and Euros. As a result, the Group is subject to transaction and translation exposure from
fluctuations in foreign currency exchange rates.
ACCOUNTING POLICIES
The Group’s accounting policies are governed by International Financial Reporting Standards (IFRS).
Guidance has been obtained from International Financial Reporting Interpretations Committee (IFRIC),
and circulars. The potential impacts of future standards and amendments have been disclosed on
page 62. No impact has been provided in respect of exposure drafts as they are normally subject to
material changes prior to being issued as standards.
The accounting policies are consistent with those of the previous year.
The Group maintains the view that the standards set the minimum requirements for financial reporting.
The financial statements in this annual report have been prepared with the aim of exposing the reader to
a detailed view of the results, using a simplified approach, in the hope of facilitating a deeper and
informed understanding of the Group’s performance.
Annual report
2009 19Directorate
MH (Thys) Visser (55) # NON-EXECUTIVE CHAIRMAN
CA (SA) Appointed: January 1997
Directorships: Managing Director and Chief Executive Officer of Remgro Limited, director of British
American Tobacco plc, Distell Group Limited, Nampak Limited, Medi-Clinic Corp Limited and Unilever
South Africa Holdings (Proprietary) Limited.
Thys is a Chartered Accountant who qualified with Arthur Young & Company in Cape Town before joining
Rembrandt Group Limited in 1980. He held a number of positions, including Financial Director in 1991
and Managing Director in 1992.
Dr M (Munro) Griessel (71) *† INDEPENDENT NON-EXECUTIVE DIRECTOR
PhD (Animal Science) Appointed: November 2002
Directorships: Chairman of the technology committee of the Protein Research Foundation.
Munro has over forty years experience in the animal feed and livestock industries. He is a member of the
advisory committee of the Oil and Protein Seeds Development Trust, and an honorary life member of the
Animal Feed Manufacturers Association.
RV (Roy) Smither (64) *† INDEPENDENT NON-EXECUTIVE DIRECTOR
CA (SA) Appointed: December 2008
Directorships: Nampak and Hans Merensky Holdings.
Roy has a wealth of corporate experience, having served as a director and CEO of the ICS Group from
1987 to 1998 and as an executive director of Tiger Brands from 1998 to 2006. Roy is currently a member
of FirstRand’s Credit Committee.
DW (Don) Vale (68) *#† INDEPENDENT NON-EXECUTIVE DIRECTOR
MA (Oxon), FCA (UK) Appointed: July 2004
Don qualified in the UK as a Chartered Accountant and Chartered Management Accountant. He worked
for Unilever for 26 years, principally in South Africa and the UK, latterly as the Financial Director. Don has
subsequently acted as a business strategy consultant to corporate clients.
PR (Pieter) Louw (40) NON-EXECUTIVE DIRECTOR
CA (SA) Appointed: December 2008
Directorships: M&I Group Services Limited.
Pieter is a Chartered Accountant who qualified with PricewaterhouseCoopers Inc. in Stellenbosch before
joining the Remgro Group in 2001. He is currently Group Financial Manager.
20 Annual report
2009JB (JB) Magwaza (67) # NON-EXECUTIVE DIRECTOR
MA (UK) Appointed: November 2002
Directorships: Chairman of Mutual and Federal, Motseng Marriott Property Services (Proprietary) Limited,
Imbewu Capital Partners, Pamodzi Investment Holdings Limited, Peoples’ Bank Limited and The Tongaat-
Hulett Group Limited. Director of Dorbyl Limited, Hulamin Limited and Nedbank Limited.
JB served as an industrial relations consultant to Tongaat-Hulett Sugar from 1975 to 1988. Thereafter he
held various directorships within the Tongaat Group and was appointed an Executive Director of The
Tongaat-Hulett Group Limited in May 1994, a position he held until he retired in August 2003.
MM (Manana) Nhlanhla (57) NON-EXECUTIVE DIRECTOR
BSc, MA (Information Science) Appointed: May 2005
Directorships: MION Investments, Batho Bonke Limited, Trade and Investments KwaZulu-Natal, Women in
Oil and Energy – South Africa and Gold Circle.
Manana is a former university lecturer in information science. Over the past ten years Manana has been
involved in various businesses including Thebe Investments as a director and in 2004 as a founding
member of Batho Bonke Consortium.
GC (Gcina) Zondi (36) NON-EXECUTIVE DIRECTOR
BCompt (Hons), AGA (SA) Appointed: July 2008
Directorships: Imbewu Capital Partners, Reebok South Africa, Isegen South Africa, Container Conversions,
GMA Logistics, Autovest Limited and Trustee of the KZN Growth Fund.
Gcina is the founding Chief Executive of Imbewu Capital Partners. He is a qualified General Accountant
and is an associate of the South African Institute of Chartered Accountants.
He worked for Nedbank Capital Private Equity for six years as a Private Equity Specialist. Prior to joining
Nedbank, Gcina completed his articles of clerkship at KPMG Durban and he also worked for Hulamin
Limited in the finance division for two and half years prior to joining KPMG.
M (Miles) Dally (52) † EXECUTIVE DIRECTOR
Chief Executive Officer Appointed: February 2003
BComm
Directorships: Rainbow Chicken Limited and its subsidiary companies and SC Johnson & Son of South
Africa (Proprietary) Limited
Miles has nearly 30 years experience in the consumer goods industry and served as Group Managing
Director of Robertsons Holdings (Proprietary) Limited from 1995 to 2002. After the unbundling of
Robertsons Holdings he accepted the position of Chief Executive Officer at Rainbow. He was appointed
non-executive chairman of SC Johnson in June 2008.
RH (Rob) Field (37) † EXECUTIVE DIRECTOR
Chief Financial Officer Appointed: July 2004
CA (SA)
Directorships: Rainbow Chicken Limited and its subsidiary companies.
Rob is a Chartered Accountant who qualified with Deloitte & Touche in Durban. Prior to joining Rainbow
in May 2003 he spent four years as Commercial Director of Robertsons Homecare (Proprietary) Limited.
MEMBERS OF COMMITTEES
* Audit Committee (DW Vale – Chairman)
# Remuneration Committee (MH Visser – Chairman)
† Risk Committee (DW Vale – Chairman)
Annual report
2009 21Executive management team
CD (Chris) Creed (50)
Distribution Director
IMM Dip (SA) Appointed: June 2005
Chris has over 20 years experience in the fast moving consumer goods industry and served in various
trade marketing and sales roles within Bristol Myers Squibb and Adcock Ingram. Prior to joining Rainbow,
Chris was the director responsible for marketing and sales of London-based Capespan plc. He was
appointed FoodSolutions Director in June 2005 and Distribution Director in March 2007.
WA (Wouter) De Wet (43)
Processing Director
BA (Industrial Psychology) Appointed: September 2006
Wouter has 14 years management consulting experience in various industries. He served as consultant to
Rainbow from 1997 to 2006, when he was appointed as National Supply Chain Manager. His project
experience in Rainbow covers virtually the entire value chain. He was appointed as Processing Director in
September 2006.
TJ (Trevor) Harding (47)
IT Director
BComm, BSc (Hons) Appointed: August 2005
Trevor has over 20 years business experience in information technology management. Prior to joining
Rainbow, he held the positions of IT Director of Unilever South Africa and Robertsons.
SB (Stephen) Heath (53)
Human Resources and Corporate Affairs Director
BA, LLB, Grad Dip Industrial Relations
Attorney of the High Court of South Africa Appointed: August 2007
Stephen spent 19 years with Rainbow as Group Secretary and Legal Advisor prior to his appointment to
the Board. Before joining the Group he gained experience both as a public prosecutor in the Department
of Justice and subsequently as an attorney in private practice. He was appointed Human Resources and
Corporate Affairs director in August 2007.
22 Annual report
2009DB (Bonga) Mavume (34)
Breed Director (Cobb)
BScAgric (Hons) (UFH), MDP, MBA (USB) Appointed: November 2007
After graduating from Fort Hare University in 1997, Bonga gained over 10 years technical, broiler,
breeding and farm operations experience with Pioneer Foods. He joined Rainbow as Supply Chain
Manager in February 2007 and was appointed Breed Director in November 2007. Bonga currently serves
on the Board of the South African Agricultural Processors’ Association.
DS (Scott) Pitman (46)
Marketing and Customer Director
BBusSc Appointed: April 2007
Scott has 17 years experience in marketing and sales where he has headed up marketing for Robertsons,
Distell and Unilever and most recently as Customer Director at Unilever.
CE (Charles) Vauqulin (47)
Agricultural Director
Agricultural Diploma (Cedara College of Agriculture) Appointed: December 2002
Prior to joining Rainbow in November 1999, Charles spent four years as Operational Manager with
County Fair Foods (Proprietary) Limited. He is currently the Vice-chairman of the Southern African Poultry
Association.
Annual report
2009 23Corporate governance statement
Rainbow’s corporate Rainbow subscribes to the highest standards of corporate governance in all its dealings with
stakeholders. This means that it will be transparent and accountable to all those affected by the business.
governance policy is The Board subscribes to the values of and accepts the inclusive approach to good corporate governance
aligned to ensure espoused in the King II report. The directors recognise that good corporate governance is essentially
about leadership and that there exists the need to conduct the enterprise with integrity and in
that the three pillars compliance with best international practices. The Board and individual directors accept their duty and
of sustainability, responsibility to ensure that the principles set out in the Code of Corporate Practices and Conduct as
defined in the King II report are observed.
being Economic,
COMPLIANCE
Social and In keeping with its commitment to corporate governance, the Board continually assesses its state of
Environmental compliance with the Code of Corporate Practices and Conduct as defined in the King II report.
sustainability SUSTAINABILITY
Rainbow’s corporate governance policy is aligned to ensure that the three pillars of sustainability, being
practices are Economic, Social and Environmental sustainability practices, are addressed in a structured manner so that
addressed in a the fundamentals of fairness, accountability, responsibility and transparency are apparent. The Group is
committed to reporting on stakeholder issues in the most appropriate manner.
structured manner CODE OF ETHICS
It is a fundamental policy of the Group to conduct its business with honesty and integrity and in
accordance with the highest legal and ethical standards. All employees are required to comply with the
spirit as well as the letter of this policy and to maintain the highest standards of conduct in all Group
professional and social dealings.
The Board has adopted a code of ethics for the Group in order to:
• Clearly state what are acceptable and unacceptable practices
• Guide policy by providing a set of ethical corporate standards
• Encourage ethical behaviour of the Board, managers and employees at all levels
• Guide ethical decision-making
• Make ethical infringements easy to identify
• Promote awareness of, and sensitivity to, ethical issues
• Help resolve conflicts.
There has been full compliance with the Group’s code of ethics during the year under review.
CORPORATE CODE OF CONDUCT
The Group is committed to:
• The highest standards of integrity in all its dealings with its stakeholders and society at large
• Carrying on of business through fair commercial competitive practices
• Trading with customers and suppliers who subscribe to ethical business practices
• Non-discriminatory employment practices and the promotion of employees to realise their potential
through training and development of their skills
• Being proactive toward environmental and social sustainability issues.
BOARD OF DIRECTORS
Board structure and composition
The Board is the highest governing authority within the Group and has ultimate responsibility for
governance. The Group has a unitary Board that comprises eight non-executive (three of whom are
24 Annual report
2009You can also read