Africa's Adaptation Gap - teChniCAl report - Climate-change impacts, adaptation challenges and costs for Africa - Climate Analytics
←
→
Page content transcription
If your browser does not render page correctly, please read the page content below
Climate-change impacts, adaptation challenges and costs for Africa

Africa’s
Adaptation Gap
               technical report

                 AMCEN

                          www.unep.org/roa/amcen
Africa’s
      Adaptation Gap
                                technical report

       Climate-change impacts, adaptation challenges
                   and costs for Africa

i   Africa Adaptation Gap Technical Report :Climate-change impacts, adaptation challenges and costs for Africa
The contents of this report do not necessarily reflect the views or policies of UNEP or contributory organisations. The designations
employed and the presentations do not imply the expressions of any opinion whatsoever on the part of UNEP or contributory
organisations concerning the legal status of any country, territory, city, company or area or its authority, or concerning the
delimitation of its frontiers or boundaries.

Authors:
Michiel Schaeffer, Climate Analytics, Germany
Florent Baarsch, Climate Analytics, Germany
Sophie Adams, Climate Analytics, Germany
Kelly de Bruin, Centre for Environmental and Resource Economics (CERE), Umeå University, Sweden
Laetitia De Marez, Climate Analytics, USA
Sandra Freitas, Climate Analytics, Togo
Andries Hof, Netherlands Environmental Assessment Agency (PBL), The Netherlands
Bill Hare, Climate Analytics, Germany

Editorial Team:
Michiel Schaeffer, Climate Analytics
Richard Munang, UNEP, Regional Office for Africa (ROA)
Jesica Andrews, UNEP, Regional Office for Africa (ROA)
Sophie Adams, Climate Analytics
Cindy Baxter, Climate Analytics

Additional data and assessments:
Felix Fallasch, Climate Analytics (funding mechanisms)
Dim Coumou, Potsdam Institute for Climate Impacts Research (PIK) (data on warming, aridity)
Mahé Perrette, Potsdam Institute for Climate Impacts Research (PIK) (data on sea-level rise)
Alex Robinson, Potsdam Institute for Climate Impacts Research (PIK) (data on warming, aridity)

Reviewers:
Joe Alcamo, Chief Scientist, UNEP
Keith Alverson, Head of Climate change Adaptation, UNEP
Dorothy A. Amwata, South Eastern Kenya University
Moses Chimbari, University of Kwazulu-Natal
Ngonzo Cush, Kenyatta University, Kenya
Seybatou Diop, Institut des Sciences de la Terre, Université Cheikh Anta Diop de Dakar, Senegal
Cliff Dlamini, Stellenbosch University, South Africa
El Houssine El Mzouri, Head of Research & Development Unit, INRA Morocco
Bubu Jallow, Senior Climate Change Advisor, Gambia
Toyin Kolawole, University of Botswana
Emma T. Liwenga, University of Dar es Salaam,
Paul Mapfumo, University of Zimbabwe, Harare, Zimbabwe
Semu Ayalew Moges, Institute of Technology, Addis Ababa University, Ethiopia
Godwell Nhamo, Institute for Corporate Citizenship, University of South Africa
Maggie Opondo, Institute for Climate Change and Adaptation, University of Nairobi, Kenya
Chris Shisanya, Kenyatta University, Kenya
Shem Wandiga, University of Nairobi, Kenya
Rebecca Zengeni, University of KwaZulu Natal, South Africa

Production Team:
Richard Munang, UNEP, Regional Office for Africa (ROA)
David Ombisi, UNEP, Regional Office for Africa (ROA)
Jesica Andrews, UNEP, Regional Office for Africa (ROA)
Moses Ako, UNEP, Regional Office for Africa (ROA)

           Africa Adaptation Gap Technical Report :Climate-change impacts, adaptation challenges and costs for Africa         ii
Table of Contents
Foreword . . . . . . . . . . . . . . . . . . . . . . . . . . . . . . . . . . . . . . . . . . . . . . . . . . . . . . . . . . . . . . . . . . . . . . . . . . . . . . . . . . . . . . .         v
Key Messages . . . . . . . . . . . . . . . . . . . . . . . . . . . . . . . . . . . . . . . . . . . . . . . . . . . . . . . . . . . . . . . . . . . . . . . . . . . . . . . . . . . . . . . vi
Summary . . . . . . . . . . . . . . . . . . . . . . . . . . . . . . . . . . . . . . . . . . . . . . . . . . . . . . . . . . . . . . . . . . . . . . . . . . . . . . . . . . . . . . . . . . . viii
01 - Introduction . . . . . . . . . . . . . . . . . . . . . . . . . . . . . . . . . . . . . . . . . . . . . . . . . . . . . . . . . . . . . . . . . . . . . . . . . . . . . . . . . . . . 1
02 - Climate and Impacts projections: the Adaptation Challenge of a 4°C world . . . . . . . . . . . . . . . . . . . . 4
          2.1 Climate projections for Africa . . . . . . . . . . . . . . . . . . . . . . . . . . . . . . . .. . . . . . . . . . . . . . . . . . . . . . . . . .                                4
                2.1.1 Temperature . . . . . . . . . . . . . . . . . . . . . . . . . . . . . . . . . . . . . . . . . . . . . . . . . . . . . . . . . . . . . . . . . . . . . . . . . . . . 4
                2.1.2 Precipitation . . . . . . . . . . . . . . . . . . . . . . . . . . . . . . . . . . . . . . . . . . . . . . . . . . . . . . . . . . . . . .		                              4
                2.1.3 Aridity . . . . . . . . . . . . . . . . . . . . . . . . . . . . . . . . . . . . . . . . . . . . . . . . . . . . . . . . . . . . . . . . . . . . . . . . . . . . .        5
          2.2 Impact projections                              ...................................................................                                                              6
                2.2.1 Sea-level rise . . . . . . . . . . . . . . . . . . . . . . . . . . . . . . . . . . . . . . . . . . . . . . . . . . . . . . . . . . . . . . . . . . . . . . . . .         6
                2.2.2 Extremes / Catastrophic events . . . . . . . . . . . . . . . . . . . . . . . . . . . . . . . . . . . . . . . . . . . . . . . . . . . . . . . .                           7
                2.2.3 Ecosystems . . . . . . . . . . . . . . . . . . . . . . . . . . . . . . . . . . . . . . . . . . . . . . . . . . . . . . . . . . . . . . . . . . . . . . . . .             8
                2.2.4 Water Resources . . . . . . . . . . . . . . . . . . . . . . . . . . . . . . . . . . . . . . . . . . . . . . . . . . . . . . . . . . . . . . . . . . . . . .              9
                2.2.5 Agriculture . . . . . . . . . . . . . . . . . . . . . . . . . . . . . . . . . . . . . . . . . . . . . . . . . . . . . . . . . . . . . . . . . . . . . . . . . . . . . 11
                2.2.6 Other Market Sectors . . . . . . . . . . . . . . . . . . . . . . . . . . . . . . . . . . . . . . . . . . . . . . . . . . . . . . . . . . . . . .                         12
                2.2.7 Health . . . . . . . . . . . . . . . . . . . . . . . . . . . . . . . . . . . . . . . . . . . . . . . . . . . . . . . . . . . . . . . . . . . . . . . . . .               13
                2.2.8 Cities . . . . . . . . . . . . . . . . . . . . . . . . . . . . . . . . . . . . . . . . . . . . . . . . . . . . . . . . . . . . . . . . . . . . . . . . . . . . . . . .   14
03 - Adaptation Options and Measures . . . . . . . . . . . . . . . . . . . . . . . . . . . . . . . . . . . . . . . . . . . . . . . . . . . . . . . . . . . . 15
          3.1 Access to water . . . . . . . . . . . . . . . . . . . . . . . . . . . . . . . . . . . . . . . . . . . . . . . . . . . . . . . . . . . . . . . . . .		                            15
          3.2 Agricultural food production . . . . . . . . . . . . . . . . . . . . . . . . . . . . . . . . . . . . . . . . . . . . . . . . . . . . . . . . . . . . 15
          3.3 Marine and freshwater fisheries . . . . . . . . . . . . . . . . . . . . . . . . . . . . . . . . . . . . . . . . . . . . . . . . . . . . . . .                                    16
          3.4 Tourism . . . . . . . . . . . . . . . . . . . . . . . . . . . . . . . . . . . . . . . . . . . . . . . . . . . . . . . . . . . . . . . . . . . . . . . . . . . . . . . . .        16
          3.5 Health . . . . . . . . . . . . . . . . . . . . . . . . . . . . . . . . . . . . . . . . . . . . . . . . . . . . . . . . . . . . . . . . . .			                                    16
          3.6 Access to energy . . . . . . . . . . . . . . . . . . . . . . . . . . . . . . . . . . . . . . . . . . . . . . . . . . . . . . . . . . . . . . . . . .                             17
          3.7 Cities . . . . . . . . . . . . . . . . . . . . . . . . . . . . . . . . . . . . . . . . . . . . . . . . . . . . . . . . . . . . . . . . . . . . . . . . . . . . . . . . . . . . 17

       iii            Africa Adaptation Gap Technical Report :Climate-change impacts, adaptation challenges and costs for Africa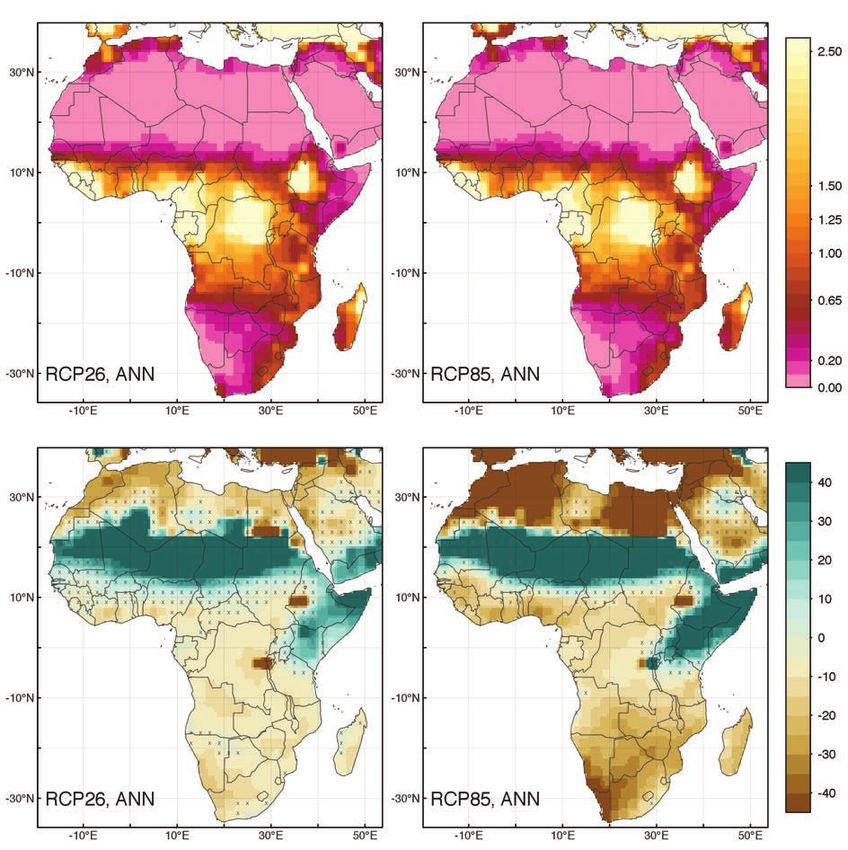
04 - Adaptation Costs . . . . . . . . . . . . . . . . . . . . . . . . . . . . . . . . . . . . . . . . . . . . . . . . . . . . . . . . . . . . . . . . . . . . . . . . . . . . . 18
         4.1 The near to mid-term to 2050 . . . . . . . . . . . . . . . . . . . . . . . . . . . . . . . . . . . . . . . . . . . . . . . . . . . . . . . .                               18
         4.2 The long term . . . . . . . . . . . . . . . . . . . . . . . . . . . . . . . . . . . . . . . . . . . . . . . . . . . . . . . . . . . . . . . . . . . . . . . . . .          21
         4.3 Discussion . . . . . . . . . . . . . . . . . . . . . . . . . . . . . . . . . . . . . . . . . . . . . . . . . . . . . . . . . . . . . . . . . . . . . . . . . . . . .       26
05 - The Adaptation Gap(s) . . . . . . . . . . . . . . . . . . . . . . . . . . . . . . . . . . . . . . . . . . . . . . . . . . . . . . . . . . . . . . . . . . . . . . . 28
         5.1 Global pledged and available funding for adaptation . . . . . . . . . . . . . . . . . . . . . . . . . . . . . . . . . .                                                    28
               5.1.1 Funding disbursed for adaptation, globally and in Africa . . . . . . . . . . . . . . . . . . . . . . . . . . . . . . .                                             29
               5.1.2 Available multilateral funding for climate change adaptation in Africa and globally		                                                                              30
         5.2 The funding gap . . . . . . . . . . . . . . . . . . . . . . . . . . . . . . . . . . . . . . . . . . . . . . . . . . . . . . . . . . . . . . . . . .		                      31
               5.2.1 - The Emissions Gap fuelling the Adaptation Gap . . . . . . . . . . . . . . . . . . . . . . . . . . . . . . .		                                                    31
               5.2.2 The Adaptation Funding Gap . . . . . . . . . . . . . . . . . . . . . . . . . . . . . . . . . . . . . . . . . . . . . . . . . . . . . . . . . .                     32
References . . . . . . . . . . . . . . . . . . . . . . . . . . . . . . . . . . . . . . . . . . . . . . . . . . . . . . . . . . . . . . . . . . . . . . . . . . . . . . . . . . . . . . . . 34
appendix 1. overview of adaptation options and measures . . . . . . . . . . . . . . . . . . . . . . . . . . . . . . . . . . . . . 40
APPENDIX 2: uncertainty and sensitivity analysis for top-down adaptation costs . . . . . . . . . . . . . . . . 43

                 Africa Adaptation Gap Technical Report :Climate-change impacts, adaptation challenges and costs for Africa                                                                     iv
Foreword
Africa’s Adaptation Gap Report is a stark analysis of where Africa stands in relation to its adaptation goals and is a cautionary
indicator of what may happen should the emissions gap remain - necessitating additional adaptation.
The Africa Adaptation Gap Report was accomplished to inform policymakers of the shortcomings and opportunities
for adaptation to Climate Change in Africa. The results demonstrate how delaying action now will assuredly result in
exponential costs down the road.
Adaptation costs due to past emissions are revealed to be between USD 7-15 billion annually by 2020. The report’s
conclusions demonstrate that - even where the emissions gap is closed and we get onto a pathway to hold warming below
2°C - by 2050 adaptation costs could hover around USD 35 billion per year. Analyses of present policies put the world on
track to 3.5-4°C warming by 2100 are even more dispiriting and reveal that the cost of adaptation for Africa could reach
USD 50 billion per year by 2050, still only halfway to the warming by 2100. This is hardly encouraging news for some of
the world’s least developed countries.
The difference in these estimates is directly linked to the commitment and ability of countries to preserve a below-2°C
world. With emissions-curbing efforts an uncertain reality, adaptation may become the only option for many countries.
The report illustrates that the magnitude of adaptation requirements could destabilize sectors at the heart of economic
progress. In sub-Saharan Africa essential sectors like water supply, infrastructure, and agriculture will constitute the
highest level of adaptation costs while in North Africa, the focus will be on infrastructure, coastal zone protection, and
adapting to extreme weather events.
What are realistic options for African countries? The report sketches the technical scenarios for adaptation including
the development of more drought-resistant crops, early-warning systems for floods, droughts or fires, and urban
infrastructure protection measures such as seawalls, dykes, and wave breaks. The challenge will be securing the political
will, technical know-how, and adequate funding.
The Report advances a number of strategies already voiced by ambitious African countries such as Sudan, Sierra Leone,
Cape Verde, Chad and Gambia in their National Adaptation Programme of Actions (NAPAs). The impacts of these plans
will extend from rainwater catchment, diversification of agriculture, development of aquaculture to promoting wind, solar
and biogas energy.
Rising to the challenges posed by climate change will inevitably require adaptation, but the intensity of the needed
adaptation measures and the scale of damages will be tightly linked subsequent to the achievements or inadequacies
of efforts made to curb emissions. The Africa Adaptation Gap Technical Report is a pioneering effort, foreseen to be a
stepping stone towards more comprehensive assessments, culminating in a global Adaptation Gap Report series. The
Africa Report underscores the imperative of committing to adaptation aims and ensuring their realization by emphasizing
the seemingly insurmountable consequences of failing to doing so.

Mr. Mounkaila Goumandakoye                                                                           Hon. Dr. Terezya Huvisa,
Director and Regional Representative                                                                                  President
Regional Office for Africa                                                                                               AMCEN
United Nations Environment Programme (UNEP)

    v       Africa Adaptation Gap Technical Report :Climate-change impacts, adaptation challenges and costs for Africa
Key Messages
Africa faces a significant challenge in adapting to climate change with costs and damages rising rapidly with
warming
Africa is a “vulnerability hot spot” for the impacts of climate change. Its adaptation challenge will grow substantially, even if
the 2020 “Emissions Gap” is closed and global-mean warming held below a 2°C increase above pre-industrial temperatures.
The adaptation challenge for Africa will be much larger if the emissions gap is not closed and mitigation beyond 2020 falls
short, which likely implies a 4°C warmer world at the end of the century. The level of residual damages grows substantially
with increasing warming levels.

Warming limited to below 2°C still implies major adaptation costs for Africa: 4°C of warming by 2100 globally will
hit the continent very hard.
On the African continent, the impacts of projected warming are relatively extreme compared to the historical climate
conditions under which human and natural systems have evolved.
     •   Extreme weather events including droughts, floods and heat waves are likely to become both more frequent and
         more severe.
     •   With 4°C warming by 2100, sea-level rise along most African coasts could approach or exceed one metre. This will
         threaten communities and economic activity along some of Africa’s coastlines.
     •   Agricultural and fishery productivity will be diminished by changing climatic conditions.
     •   Human health will be undermined by the risks associated with extreme weather events and an increased incidence
         of transmittable diseases and under-nutrition.
     •   At warming exceeding 3°C globally, virtually all of the present maize, millet, and sorghum cropping areas across
         Africa could become unviable. However, even a warming approaching 2°C will lead to a substantial increase in the
         proportion of under-nourished people in sub-Saharan Africa.
     •   Those African populations that are already most vulnerable to climatic variability, such as the poor inhabitants of
         informal settlements, will become even more vulnerable.

How well Africa deals with these climate impacts, now and in the future, will be co-determined by the funding it
receives.
Adaptation measures such as early warning systems and coastal zone management to counter sea-level rise offer a
possibility of minimising these impacts, but Africa’s capacity to adapt depends critically on access to funding.

Developed countries have committed to provide funds rising to USD 100 billion annually by 2020 for mitigation and
adaptation in developing countries.
The Cancun Agreements decided that a significant share of new multilateral funding for adaptation should flow through the
Green Climate Fund (GCF). The governing instrument of the GCF and the COP requested the board to balance allocation
between adaptation and mitigation. Whilst the resource allocation framework of the GCF is currently being developed,
the allocation criteria will probably not be based on geographical distribution. It has been agreed that special consideration
be given to the Least Developed Countries (LDCs) and Small Island Developing States (SIDS), the first being composed by
many countries in Africa. Hence it is not possible at this time to assign a share of the US$ 100 billion annual commitment by
2020 to adaptation in Africa.

          Africa Adaptation Gap Technical Report :Climate-change impacts, adaptation challenges and costs for Africa       vi
Due to present and committed climate change caused by past emissions Africa is already committed to adaptation
costs in the range of USD 7-15bn per year by 2020. These costs will rise rapidly after 2020, with higher levels of
warming resulting in higher costs and damages
Even if adaptation funding for Africa meets adaptation costs by 2020, annual funding channelled to adaptation in Africa
would need to increase further by 7% each year after 2020 to meet the adaptation challenge implied by further warming in
the mid- to long-term, even if that further warming is limited to below 2°C. Estimated adaptation costs reach USD 35 billion
by 2050 and USD 200 billion by the 2070s, although uncertainties are large.

With the present emission trends and policies projected to lead to warming of 3.5-4°C by 2100 funding for adapta-
tion in Africa would need to be scaled up by as much as 10% each year from 2020 onwards.
Estimated adaptation costs reach USD 50 billion by 2050 and USD 350 billion by the 2070s. Adaptation helps to reduce
damages, but does not eliminate these. Under full adaptation effort, total estimated adaptation costs plus “residual
damages” reach 4% of African GDP by 2100 in a 4°C world (1% in a 2°C world), compared to an estimated 7% of African
GDP in damages without adaptation to a 4°C world.

To increase confidence in meeting adaptation needs in Africa, rapid and verifiable scaling up of adaptation funding
for Africa is urgent
There is currently no comprehensive database reporting finance flows from donor countries or agencies through multilateral
and bilateral channels. Transparency is a prerequisite to know with any certainty whether existing and pledged funding is
adequate to bridge the adaptation gap in Africa and other low-income regions.

Unless the Emissions Gap is closed, and warming limited below 2°C, rapidly rising damages, even after full adapta-
tion, and threats to development prospects at least regionally are likely
Making up the difference between the resources required to adapt and those currently available promises a more resilient
and hopeful future for Africa. Limiting warming to 1.5°C, as called for by the least developed countries and small island
developing states, would further limit and reduce the adaptation costs and damages. Nevertheless, significant impacts
could still be expected.

   vii      Africa Adaptation Gap Technical Report :Climate-change impacts, adaptation challenges and costs for Africa
Summary
The Emissions Gap and its importance for Africa
The IPCC’s Fourth Assessment (AR4) made clear Africa is a vulnerability hotspot for climate change. This was confirmed
earlier in 2013 in the World Bank’s report Turn Down the Heat: Climate Extremes, Regional Impacts, and the Case for Resilience,
which focused on sub-Saharan Africa among three world regions.
Present pledges by individual countries to limit emissions by 2020 would, unless emissions are reduced substantially
afterwards, lead to a global temperature increase of around 3.5-4°C warming by 2100. This is consistent with the UNEP
Gap report (2012) and the International Energy Agency’s 2012 assessment of likely future emissions, which implies that no
further mitigation action would lead to a 40 percent chance of warming exceeding 4°C by 2100.
By contrast, energy-economic scenarios clearly show that stronger, technically and economically feasible, mitigation efforts
worldwide can hold warming below 2°C with high probability. The inability of current emission reduction pledges to put the
world on track to stay below 2°C, and the extent to which the level of emissions would be “too high” by 2020, is termed the
“Emissions Gap” and annually estimated in the UNEP Emissions Gap reports.
While a 2°C global mean warming poses a major adaptation challenge, a 3.5-4°C pathway implies an even significantly
larger adaptation challenge for Africa. This is explored in this report through a review of its different aspects, ranging from
physical changes and impacts, to adaptation measures, costs and, finally, funding.
Likely impacts / damages from climate change
Projected warming over Africa is relatively extreme compared to the historical climate conditions and variability within
which human and natural systems have evolved on this continent.
The impact projections that have appeared in the peer-reviewed literature since the AR4 (2007) point to a large and
multidimensional adaptation challenge, along with significant residual damages. Many of the impacts projected for a 4°C
warming scenario would be reduced if global mean warming were held below 2°C, but would still be significant and require
a substantial adaptation effort.
The impacts that constitute Africa’s adaptation challenge include:
• The incidence of extreme heat events that are classified as highly unusual in today’s climate is projected to increase,
with these events occurring in almost all summer months in 2100 in a 4°C warming scenario and becoming the
“new normal” (Figure ES.1). In contrast, at 2°C warming, heat extremes that are currently highly unusual are
experienced in 60-80 percent of summer months in central Africa and at lower frequencies across the rest of the
continent. Limiting warming to 1.5°C will also limit further the extent and frequency of these extremes.
• With 4°C warming, annual precipitation is projected to decrease by up to 30 percent in southern Africa and by
20 percent in North Africa. Parts of north, west and southern Africa may see decreases in groundwater recharge
rates of 50–70 percent as well as reductions in annual river discharge. At 2°C warming, precipitation is projected
to decrease by 5-20 percent in North Africa. At this lower level of warming, changes are uncertain for the rest of
the continent.
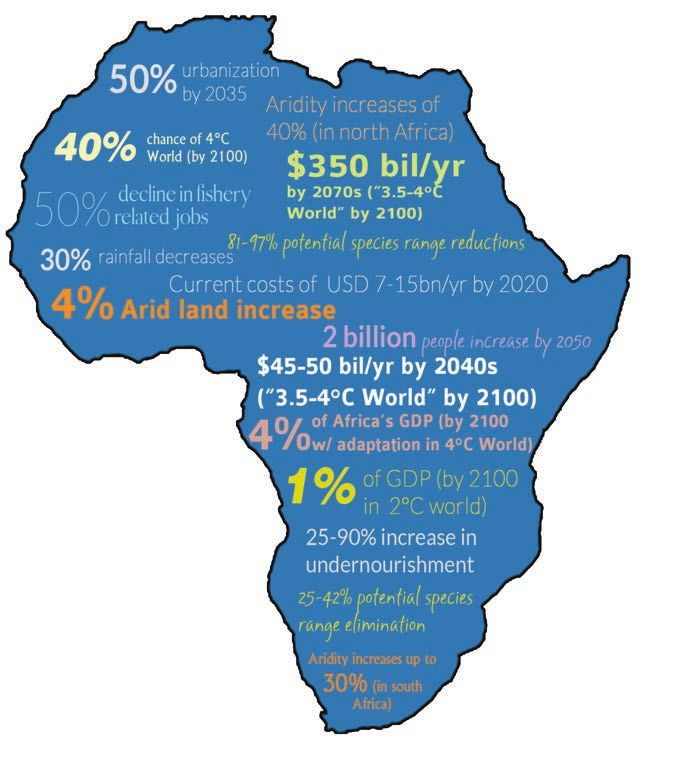
• Currently about half of Africa’s land surface can be classified as arid (dry) to hyper-arid (desert). With 4°C warming,
this area is projected to increase by 4 percent by 2100, while with 2°C warming the increase is only 1%.
• Sea-level rise is projected to be 10 percent higher than the global mean along African coasts – smallest along the
Mediterranean coast at about 90 cm and greatest along the southeast coast at 110 cm by 2100 for 4°C warming,
reducing to 60-80 cm by 2100 for 2°C warming (Figure ES.1). The most vulnerable areas in terms of population and
assets at increased risk of flooding include Egypt, Cote d’Ivoire, Guinea-Bissau, Mozambique, Nigeria, Tanzania,
The Gambia and Tunisia.
Africa Adaptation Gap Technical Report :Climate-change impacts, adaptation challenges and costs for Africa viii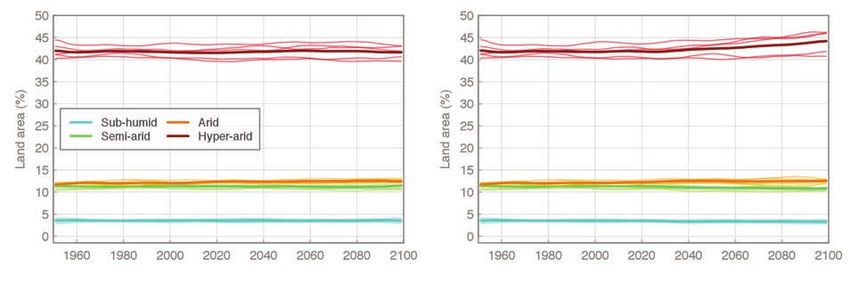
•    Ecosystem ranges will potentially shift rapidly as warming increases, with a risk of loss of biodiversity as species
          may be unable to migrate to keep pace. Accelarated woody plant encroachment could limit grazing options for
          both wildlife and animal stock.
     •    Crop production is expected to be reduced across much of the continent as optimal growing temperatures are
          exceeded and growing seasons shortened. The areas that are appropriate for any given crop are expected to shift
          as local climates change. At warming exceeding 3°C globally, virtually all of the present maize, millet, and sorghum
          cropping areas across Africa could become unviable for current cultivars.
     •    Livestock production is expected to be affected by changes in feed quality and availability, water availability and
          increased rates of disease and heat stress.
     •    Fish productivity in lakes is expected to decline with increased water temperatures, high levels of evaporation and
          decreased nutrient concentration as a result of reduced inflow. Fishery yields are expected to decline in rivers and
          lakes as well as in the ocean, particularly off the coasts of West and North Africa and in the Red Sea.
     •    Coral reefs are projected to be at risk of regular severe bleaching nearly every other year by the 2050s in a
          warming pathway on track to reach 4°C by 2100, a risk that would be reduced in a 2°C world. The projected rates
          of bleaching even in 2°C world would still pose a significant risk to the ongoing survival of reefs in the region
     •    Human health will be affected, as rates of undernourishment, child stunting, vector-borne diseases (e.g. malaria),
          and water-borne diseases (e.g. cholera) are altered by climatic changes. Extreme weather events such as flooding
          and drought can also cause morbidity and mortality.
     •    The tourism sector could be affected through factors such as extreme summertime temperatures, loss of
          biodiversity and natural attractions, and damage to infrastructure as a result of extreme weather events.
     •    Disruptions to energy supply could occur as changes in river runoff and increased temperatures affect hydroelectric
          dams and the cooling systems of thermoelectric power plants.
     •    In many cases, urban areas are particularly exposed to a number of risks associated with climate change, including
          sea-level rise, storm surges and extreme heat events. Informal settlements are highly vulnerable to flooding
          and the poor urban populations have been found to be the most vulnerable to elevated food prices following
          disruptions to agricultural production.

Figure ES.1 Projections for sea-level rise above present-day levels (ocean – left legend) and warming compared to present-day extremes
(land – right legend) for 2100. A 2°C warming scenario (RCP2.6) is shown on the left; a 4C warming scenario (RCP8.5) is shown on the
right. Source: PIK; (Schellnhuber et al., 2013)

Adaptation measures required
The capacity of African communities to cope with the effects of climate change on different economic sectors and human
activities is expected to be significantly challenged, and potentially overwhelmed, by the magnitude, and rapidity of onset,
of the impacts such as those illustrated above.

    ix      Africa Adaptation Gap Technical Report :Climate-change impacts, adaptation challenges and costs for Africa
To reduce the magnitude of the impacts and their repercussions for African livelihoods, adaption measures at different
levels, from households to national and regional levels, are being planned and implemented and need to be further supported
and strengthened.
These include, for example:
• The development of early-warning systems for floods, droughts or fires to help populations anticipate and prepare
for the occurrence of extreme events
• Irrigation, improvement in water storage capacity, reforestation to protect surface water systems, sustainable use
of groundwater resources, desalinisation of seawater, and rainwater catchment and storage to maintain sufficient
and reliable access to freshwater for human and agricultural needs.
• City infrastructure protection measures such as seawalls, dykes, wave breakers and other elements of coastal
zone management, as well as city-level food storage capacity and urban agriculture to enhance food security, and
improving design and drainage technology of sanitation facilities to reduce the risk of water-borne diseases in the
aftermath of extreme weather events.
Adaptation measures are considered either “soft” adaptation measures, where they involve natural capital or community
control; or “hard” adaptation measures, where adapting a sector or a community requires the construction of new and
capital-intensive infrastructure. The majority of the adaptation measures require an anticipatory and planned approach and
large investments. The need for planned capital-intensive adaptation is greater at high than low warming levels.
The cost of adaptation for Africa
The process of estimating adaptation costs according to various climate scenarios is complex and involves many uncertainties.
Nevertheless, several studies have projected the costs of adaptation measures such as those listed above.
For the near term, estimates by the World Bank (2010b) offer a useful breakdown across sectors on the regional level. For
the Sub-Saharan Africa and North Africa/Middle East regions, annual adaptation costs by 2020 for a warming of about 1°C
globally above pre-industrial amount to about USD 13 and 2 billion, respectively. These costs increase rapidly to around
USD 24 and 5 billion, respectively, by 2040 for a warming approaching 2°C globally.
In Sub-Saharan Africa, the highest adaptation costs are projected to be needed in the water supply, coastal zone protection,
infrastructure, and agriculture sectors. For Middle East & North Africa, the focus of adaptation is in infrastructure, coastal
zone protection, and adapting to extreme weather events.
In a below 2°C warming pathway, Africa is still confronted with considerable impacts as described above and Africa’s long-
term adaptation costs are estimated at around USD 35 billion a year by 2050 and USD 200 billion a year by the 2070s
(Figure ES.2 – left panel). Beyond the 2070s, virtually all adaptation costs in a 2°C world are targeted at limiting damages
from sea-level rise, as this continues even as warming stabilises at below 2°C, or even starts to decline.
In a 3.5-4°C warming pathway, estimated adaptation costs for Africa are considerably higher at around USD 45-50 billion
a year by 2050 and USD 350 billion a year by the 2070s. Across all time periods, approximately half of this is for adaptation
to sea-level rise, less than 10% for autonomous adaptation measures and the rest for other anticipatory measures.
In a 2°C world, annual adaptation costs plus residual damages (those damages not avoided by adaptation) are estimated to
be limited to about 1% (assuming full adaptation effort) of 2100 African GDP (Figure ES.2 – right panel).
These costs are projected to increase fourfold to about 4% of Africa’s GDP under presently planned and implemented
mitigation measures, assuming full adaptation effort. Without adaptation, total damages would reach 7% of Africa’s GDP
for this scenario, a clear illustration of the potential for adaptation measures to significantly reduce levels of damage and
reduce the overall costs.
Africa Adaptation Gap Technical Report :Climate-change impacts, adaptation challenges and costs for Africa xEstimated Adaptation Costs for Africa Total of Adaptation and
Residual Damage costs for Africa (2100)
excluding from sea-level rise
800 7%
further rise in costs
Adaptation Costs for Africa (USD billion)
due to
700 "4+°C world" (RCP8.5) 6%
Percentage of GDP Africa
inadequate
600 Policy Reference 5%
adaptation
500 Current Pledges rise in costs
4% due to
400 "2°C world" (RCP2.6) inadequate
3% mitigation
300
2%
200
100 1%
0 0%
2010 2020 2030 2040 2050 2060 2070 2080 “2°C World” Policy Reference Policy Reference
with adaptation with adaptation without adaptation
Figure ES.2 Left panel: Estimated adaptation costs for Africa for four scenarios. Right panel: Estimated total of annual adaptation costs and
residual damages (part of damages not avoided by adaptation) expressed as a percentage of GDP for Africa by 2100. If the Emissions Gap
is closed and global-mean warming is kept below 2°C, total adaptation costs plus residual damages can be limited to 1% of GDP in Africa by
2100. However, total adaptation and residual damages costs increase rapidly if the Emissions Gap is not closed (Policy Reference Scenario)
and warming increases to 3.5-4°C. If in this high-warming case the Adaptation Funding Gap is not closed either, damages may reach 7% of
GDP in Africa by 2100.
Africa’s Adaptation Funding Gap
When developed countries signed the United Nations Framework Convention on Climate Change in Rio de Janeiro, 1992,
they committed, under Article 4.4 to support developing countries to adapt to climate change impacts:
“The developed country Parties and other developed country parties included in Annex II shall also assist the
developing country Parties that are particularly vulnerable to the adverse effects of climate change in meeting
costs of adaptation to those adverse effects.”
Traceable funding disbursed in Africa for climate change adaptation through bilateral and multilateral channels for the
years 2010 and 2011 amounted to USD 743 and 454 million, respectively, although this figure does not fully account for
the funding channelled through Development Finance Institutions, for example the World Bank, or national development
banks.
To meet the adaptation costs estimated in this report for Africa by the 2020s, funds disbursed annually would need to grow
at an average rate of 10-20% a year from 2011 to the 2020s. There is currently no clear, agreed pathway to provide these
resources.
The UNFCCC’s developed country Parties have committed to provide funds rising to US$ 100 billion annually by 2020,
from public and private sources, for both adaptation and mitigation actions in across all developing countries by 2020.
Rules drawing up the allocation of funding for adaptation have yet to be defined and are to be negotiated through the Green
Climate Fund (GCF) and the UNFCCC.
At this stage there is no clear sense of how much of these funds would benefit countries in the African region, nor of the
likely allocation between adaptation and mitigation funding. Until these issues are resolved it is not possible to assign a
share of the US$ 100 billion annual commitment by 2020 to Africa.
Assuming funding for adaptation efforts in Africa reached adequate levels by 2020 and assuming the world gets on track
to limit warming to below 2°C, annual funding for adaptation efforts in Africa still needs to rise a further 7% a year from
xi Africa Adaptation Gap Technical Report :Climate-change impacts, adaptation challenges and costs for Africathe 2020s onwards to keep pace with continuing sea-level rise and warming peaking below 2°C after the 2050s . This is
considerably less than the funding challenge if the current mitigation efforts were not increased, and warming reached 3.5-
4°C by 2100. In this case, the scaling up of annual funds would need to be 10% every year after the 2020s.
Reporting and verification of financial support is key
Ensuring the measurement, reporting and verification of financial support delivered to developing country Parties is a key
element. The limitations and caveats of funding data discussed in this report illustrate that access to accurate and reliable
data on support for adaptation and mitigation in developing countries is particularly complex.
There is currently no comprehensive database reporting finance flows from donor countries or agencies through multilateral
and bilateral channels. Transparency is a prerequisite to know with any certainty whether existing and pledged funding is
adequate to bridge the adaptation gaps in Africa and other low-income regions.
Common reporting format tables adopted in Doha have yet to be improved, especially on how much of private investment
leveraged through public funding can be accounted toward developed country Party commitments. Methodological
work is being undertaken by the Organisation for Economic Co-operation and Development (OECD) and the result of
the work is expected to be discussed under the UNFCCC. Symmetrically, in order to ensure that the funding for climate
change adaptation is efficiently used, a monitoring and evaluation system on the implementation of adaptation projects in
developing countries should be strengthened through capacity-building and technical assistance.
To increase confidence in meeting adaptation needs in Africa, scaling up of traceable adaptation funds for Africa is urgent.
Africa Adaptation Gap Technical Report :Climate-change impacts, adaptation challenges and costs for Africa xii01 Introduction
Recent studies and reports show that the projected increase in greenhouse gas emissions in the atmosphere over the 21st
century will have detrimental and disruptive effects on human and economic activity. The costs of the impacts will increase
at different rates depending on the emissions pathways associated with various potential development trajectories. As
the severity of impacts grows, sustaining human and economic activity will require adaptation to limit the adverse effects
of climate change. Adaptive measures such as building sea dykes, constructing climate-proofed water infrastructure or
developing early-warning systems for small-scale farmers will require funding, technical and technological capacity and
human resources – factors which are together known as adaptive capacity.
Africa is anticipated to be the most negatively affected continent on the planet due to a combination of particularly severe
projected impacts and relatively low adaptive capacity (e.g. IPCC AR4). The need for adaptation is expected to be high in
Africa, especially in light of the existing deficit in adaptation to current climate variability. To the best of our knowledge,
there are no studies effectively estimating the adaptation needs, options and costs for different emission scenarios and
associated temperature pathways.
The Cancun climate agreements specify a long-term global goal of limiting global warming to 2°C above pre-industrial
temperatures, with a provision to consider revising this to 1.5°C. However, current international pledges by countries to
reduce emissions fall short of what is needed to achieve these goals. For a series of reports, UNEP convened researchers
who showed global emissions by 2020 are projected to be too high under business-as-usual and current-pledges pathways,
compared to “cost-optimal”1 emission pathways that limit warming to 1.5 and 2°C in the long term (UNEP 2010, 2011,
2012; van Vuuren 2011 – blue line in Figure 1.1). UNEP (2012) estimated the difference by 2020 – the “Emissions Gap” –
at about 8-13 GtCO2/yr, noting that if this gap is not closed by further reducing emissions by 2020 – and no compensation
takes place beyond 2020 – warming by 2100 under “current pledges“ would reach 3.5-4°C2 above pre-industrial levels.
Such high levels of likely warming by 2100 are consistent with the most recent generation of energy-economic models
estimates of emissions in the absence of further substantial policy action (business as usual), with the median projections
reaching a warming of 4.7°C above pre-industrial levels by 2100, and a 40 percent chance of exceeding 5°C (Schaeffer et al.
2013). Assessments based on recent trends in the world’s energy system by the International Energy Agency in its World
Energy Outlook 2012 indicate global-mean warming above pre-industrial levels would reach 3.8°C by 2100.
As one of the research teams that participated in the UNEP (2010, 2011, 2012) exercises, we estimated warming under
current pledges to be at the lower end of this range by 2100 (Schellnhuber 2012), as shown in Figure 1.1 (purple line). This
estimate, however, also includes pledges for emission reductions after 2020, for any countries that have made such pledges,
for example through 2050. Also, this scenario is relative to a Policy Reference scenario (red line) that includes implemented
and planned policies leading to lower emission levels than most “business as usual” estimates in the literature (e.g. shaded
area and black line). A higher reference scenario would lead to a higher warming estimate for current pledges as well.
The central scenario used in Chapters 4 and 5 for adaptation cost estimates is the Policy Reference scenario (red line in
Figure 1.1), leading to 3.8°C warming above pre-industrial by 2100. This scenario is overall most consistent with the range
of mitigation-policy assessments discussed above.
The Emissions Gap thus leaves a large “temperature gap” between the roughly 3.5-4°C warming by 2100, implied by a
range of mitigation-policy scenarios and the 1.5-2°C that would technically and economically be achievable (e.g. blue line
in Figure 1.1).
1 Even though current pledges would lead to 2020 emissions that are too high for a “cost-optimal” pathway in terms of limiting 21st century
warming to 2°C at overall least cost to the global economy, a range of alternative emission pathways has been identified in literature that still limits
warming to 2°C, at higher overall cost and higher risks of non-achieving climate targets. UNEP (2012) notes “… it is expected that scenarios with higher
global emissions in 2020 are likely to have higher medium- and long-term costs, and – more importantly – pose serious risks of not being feasible in prac-
tice”. In this report, as in the UNEP Emissions Gap reports, we will assess the gap in terms of what current pledges achieve, not what future additional
pledges possibly might achieve.
2 This applies for the “unconditional pledges, strict rules” case in UNEP (2012).
1 Africa Adaptation Gap Technical Report :Climate-change impacts, adaptation challenges and costs for AfricaGlobal-mean surface-air temperature increase 6
above pre-industrial (°C)
RCP8.5 likely to exceed 4.5°C
5 Range of BAU
in recent literature
Policy Reference likely to exceed 3.5°C
4 Effect of
Current Pledges likely to exceed 3°C current pledges
virtually certain to exceed 2°C
3
RCP2.6 likely below 2°C
2°C
Hypothetical stop of global emissions by 2016
1.5°C likely below 1.5°C
1 Historical observations Illustrative low-emission scenario with Geophysical
global net CO2-uptake at upper end of
literature range by 2nd half of 21st century
inertia
1900 1950 2000 2050 2100
Figure 1.1 Median estimates (lines) from probabilistic temperature projections for a nonmitigation emission scenario (RCP8.5 prepared for
IPCC Fifth Assessment Report – Riahi et al 2011) and Policy Reference (including implemented and planned mitigation – update from Rogelj
et al. 2010), both of which come close to, or exceed by a substantial margin, 4°C warming by 2100. The shaded area shows the range of
business-as-usual and policy reference scenarios in the recent literature (Schaeffer et al 2013). The results for these scenarios are compared
to scenarios in which current pledges are met and to low-emissions mitigation scenarios holding warming below 2°C with a 50 percent chance
or more (Hare et al 2011; Rogelj et al. 2010; Schaeffer et al 2012; RCP2.6 prepared for IPCC Fifth Assessment Report – van Vuuren et al
2011). A hypothetical scenario is also plotted for which global emissions stop in 2016, as an illustrative comparison against pathways that are
technically and economically feasible. The spike in warming after emissions are cut to zero is due to the sudden removal of the shading effect
of sulphate aerosols.
The higher levels of warming under current pledges would lead to greater impacts and damages, and would pose a larger
challenge to adaptation, compared to a long-term limit of 1.5 or 2°C. This report considers some aspects of the “Adaptation
Gap”, defined as the difference between what is needed in terms of adaptation and what is currently realised in terms of,
among others, access to funds, capacity building, and monitoring and evaluation systems. The “need” for adaptation in Africa
is partly related to the Emissions Gap, i.e. the need would be higher for a larger Emissions Gap and hence the Adaptation
Gap would be larger (assuming a fixed level of adaptation measures). Reducing the Adaptation Gap might be achieved
both by closing the Emissions Gap and by increasing adaptation efforts. Note the Adaptation Gap would not necessarily
be closed were the Emissions Gap to be closed, because a (smaller) adaptation challenge would remain even at 1.5-2°C
warming, as shown in this report.
Adequate funding is only one element of a range of aspects that also include the adaptation challenge posed by physical
impacts, measures and institutions required for implementation of adaptation options. This report assesses a series of
elements that together constitute an Adaptation Gap for Africa.
The first element consists of the adaptation challenges for Africa caused by the global Emissions Gap. This challenge is
illustrated in Chapter 2 by an overview of the impacts projected to be felt across Africa in a “4°C world” as compared to a
“2°C world”. This overview of impacts in sectors such as agricultural production and water resources in a “4°C world” serves
to illustrate the additional adaptation challenge for Africa posed by such higher warming scenarios, compared to the smaller
adaptation challenge associated with an emissions pathway leading to around 2°C global warming by 2100.
Chapter 3 offers insights into how a range of adaptation measures could partly limit the damages and impacts summarised
in Chapter 2. It provides key examples of “on the ground” adaptation options and measures, with a focus on the African
Least Developed Countries (LDCs). LDCs are particularly vulnerable to climate change and are expected to have to rely
more heavily on international adaptation funding mechanisms.
Scaling up from specific adaptation options, a third element in identifying the Adaptation Gap for Africa is an estimate
of the total adaptation costs, or financial needs, under various emission scenarios. Chapter 4 offers such estimates for
the warming levels and pathways illustrated in Figure 1.1. Although uncertainty in these cost estimates is large, sectoral
assessments for the near- to mid-term are offered, as well as a longer-term perspective that is particularly sensitive to long-
term warming differences between emission scenarios, hence sensitive to the size of the remaining Emissions Gap.
Africa Adaptation Gap Technical Report :Climate-change impacts, adaptation challenges and costs for Africa 2The difference between adaptation costs implied by a “4°C world” and a “2°C world” is a part of the Adaptation Funding Gap
directly caused by the Emissions Gap.
Finally, Chapter 5 provides an estimate of the Adaptation Funding Gap, in terms of the difference between adaptation costs
and proposed and/or disbursed funding. Again this is assessed by necessity for different warming scenarios, in which the
identified Adaptation Funding Gap for a 1.5 and 2°C pathway is associated with a zero Emissions Gap, while the Adaptation
Funding Gap for pathways reaching 3.5°C to 4°C is implied by a remaining Emissions Gap of the size estimated in the UNEP
Emissions Gap reports. In the context of a discussion of the many uncertainties and caveats involved, estimates will be
provided of the rate by which currently disbursed funding for adaptation measures in Africa needs to be scaled up to meet
the adaptation costs under a 2°C scenario, as well as the higher costs under 3-4°C scenarios.
3 Africa Adaptation Gap Technical Report :Climate-change impacts, adaptation challenges and costs for AfricaClimate and Impacts
02 projections: the
Adaptation Challenge
of a 4°C world
A range of emissions scenarios are used in climate change modelling to identify potential changes in climatic factors such as
temperature, precipitation, extreme weather events, ocean acidification and sea-level rise, as well as potential associated
impacts on human sectors. The highest emissions scenario used in the upcoming IPCC Fifth Assessment Report (AR5),
RCP8.5 (black line in Figure 1.1), is associated with global average sea-level rise of more than 1 m by the end of the century
and unprecedented summer heat over 60% of the land surfaces, for example. The lowest emissions scenario used in the
IPCC AR5, RCP2.6 (blue line in Figure 1.1), is associated with sea-level rise of less than 70cm and a less than 30% likelihood
of unprecedented summer heat.
This chapter will focus on climate projections for Africa and the related impacts at different levels of warming.
2.1 Climate projections for Africa
2.1.1 Temperature
A warming trend in Africa has been observed since the 1960s and this is expected to continue as global mean temperatures
rise mostly consistently across the continent. With global-mean warming of 4°C above pre-industrial levels by the end of
the century, monthly summer temperatures across Sub-Saharan Africa are projected to increase by 4-6°C above present-
day temperatures, and reach 5-7°C over North Africa (Schellnhuber et al., 2013). These increases are limited significantly
to around 1°C above present-day temperatures in a scenario approaching 2°C globally by 2100.
2.1.2 Precipitation
Global models indicate an increase in precipitation in the tropics and a decrease in the sub-tropics. The northern and
southern regions of Africa are projected to experience particularly strong declines, with a projected decrease in annual
precipitation by 5-20% along the Mediterranean coast in a scenario approaching 2°C globally (Milano & et al, 2013). For
4°C global warming, a decrease of 20% in North Africa (Christensen et al., 2007) and a decrease of 30% in southern Africa
(Schellnhuber et al., 2013) compared to the present is projected. In contrast to the Mediterranean coast, precipitation
changes at 2°C warming in southern Africa are uncertain, with no clear sign of change in total annual precipitation.
Tropical Africa presents a more complex picture. The IPCC AR4 stated that tropical Africa could see an annual increase,
one that is projected to be greatest in East Africa, where annual precipitation could increase by 5-20% for 3-4°C warming
(Christensen et al., 2007). These findings are consistent with the projections of (Schellnhuber et al., 2013), which indicate
greater certainty and a stronger signal with 4°C warming compared to 2°C warming. Uncertainty about the direction of
future change in precipitation is particularly large for tropical West Africa (Giannini, A., Biasutti, M., Held, I. M., & Sobel,
2008). The IPCC AR4 found changes in annual precipitation to range between -5 and +5% (Christensen et al., 2007),
comparable to the projections by (Schellnhuber et al., 2013) for both warming scenarios.
Africa Adaptation Gap Technical Report :Climate-change impacts, adaptation challenges and costs for Africa 42.1.3 Aridity
Aridity is a measure of the long-term balance in water supply and demand, indicating conditions under which certain crops
and plants would thrive and others would not. Under 4°C warming, aridity across Africa is projected to increase strongly,
mainly driven by temperature increases that raise the evapotranspiration “demand” of plants, not compensated by a
sufficient increase in precipitation, or even amplified by a projected decline in precipitation. This increased aridity is shown
in Figure 2.1 (right panel) by the more than 40% increase in the aridity index over much of North Africa, and up to 30% in
southern Africa and on the south coast of West Africa by 2071-99 compared to 1951-80. This is more than double the
aridity change projected under 2°C warming (Schellnhuber et al., 2013).
Aridity is projected to decrease in parts of the Horn of Africa under 4°C warming with a 30% increase in the aridity index.
However, particular uncertainty remains for this part of East Africa, where regional climate model projections tend to show
a decrease in precipitation (Schellnhuber et al., 2013)., which would be associated with an increase in the Aridity Index, in
contrast to the results from global climate models (GCMs) presented here.
RCP2.6 RCP8.5
Figure 2.1 Projections for change in annual Aridity Index. Multi-model mean of the percentage change in the annual Aridity Index under 2°C
warming (RCP2.6 scenario – left panel) and 4°C warming (RCP8.5 scenario – right panel) above pre-industrial for Africa by 2071–2099
relative to 1951–1980. Note that a negative change corresponds to a shift to more arid conditions. In non-hatched areas, at least 4/5 (80
percent) of models agree. In hatched areas, 2/5 (40 percent) of the models disagree. Particular uncertainty remains for East Africa, where
regional climate model projections tend to show a decrease in precipitation, which would be associated with an increase in the Aridity Index, in
contrast to the results from global climate models (GCMs) presented here. Note decrease in aridity does not necessarily imply more favorable
conditions for agriculture or livestock, as it may be associated with increased flood risks. Note finally that the large relative change over the
Sahara represents a small absolute change compared to a very low base value. Source: PIK; (Schellnhuber et al., 2013).
Due to these changes, the total surface area classified by Aridity Index as hyper-arid (desert) and arid (dry) land in Africa
is projected to increase by 4% for 4°C warming by 2100 (Figure 2.2), with sub-humid lands and lands without a structural
moisture deficit decreasing in area by 5% each. This compares to a much smaller increase in area of hyper-arid and arid land
of 1% under 2°C warming by 2100.
5 Africa Adaptation Gap Technical Report :Climate-change impacts, adaptation challenges and costs for AfricaRCP2.6 RCP8.5
Figure 2.2 Projections for percentage of land surface in Africa with a structural moisture deficit for scenarios leading to 2°C (left) and 4°C
warming by 2100 (right) above pre-industrial, for aridity categories defined by Aridity Index (sub-humid, semi-arid, arid and hyper-arid).
2.2 Impact projections
2.2.1 Sea-level rise
By the end of the century sea-level rise is expected to be approximately 10% higher along Africa’s coastlines than the global
mean (Schellnhuber et al., 2013). However, the rise is not homogenous along the coastline of the continent (Figure 2.3 over
oceans). For example, it is projected to be higher in southern Africa than in West Africa and particular North Africa. West
Africa is projected to experience sea levels elevated in the 4°C warming scenario RCP8.5 by 85-125cm by the period 2080-
2100, compared to the baseline period of 1986-2005. Under the 2°C warming scenario RCP2.6, the rise is 60-80cm. In
Maputo in southern Africa, for example, is it approximately 5cm higher by the end of the century in both warming scenarios
(Schellnhuber et al., 2013). In contrast, Mediterranean sea levels on the North African coastline are projected to be lower
than for the rest of the continent: 60-70 cm with 2°C warming and 90-100cm with 4°C warming (Schellnhuber et al., 2013).
Figure 2.3 Projections for sea-level rise above present-day levels (ocean – left legend) and warming compared to present-day extremes (land
– right legend) for 2100. With 2°C warming (left panel – RCP2.6 scenario) by 2100, sea-level rise is projected to be less than 80 cm (orange
over oceans) and the likelihood that a summer month’s heat is unprecedented in current (local) historical climate records is generally less
than 50 percent (green/blue colors over land), with locally more extremes in western equatorial Africa. With 4°C warming (right panel –
RCP8.5 scenario), sea-level rise is projected to be more than 100 cm (red over oceans) and the likelihood that a summer month’s heat is locally
unprecedented in current history is greater than 70 percent (orange/red colors over land). Locations particularly vulnerable to the impacts of
sea-level rise mentioned in the text are indicated by black dots. Source: PIK (Schellnhuber et al., 2013)
Africa Adaptation Gap Technical Report :Climate-change impacts, adaptation challenges and costs for Africa 62.2.2 Extremes / Catastrophic events
Coastal flooding and storm surges
In a 4°C world and assuming no adaptation, (Hinkel et al., 2011) find Egypt, Mozambique and Nigeria to be most affected
by sea-level rise in terms of number of people at risk of flooding annually. However, Guinea-Bissau, Mozambique, and The
Gambia would suffer the highest proportion – up to 10% – of the national population flooded.
Flooding associated with tropical cyclone induced storm surges is another impact of global climate change, which, in
conjunction with sea-level rise, will place more people at risk of coastal flooding. (Neumann, Emanuel, Ravela, Ludwig,
& Verly, 2013) project that in Maputo, Mozambique, for example, a medium sea-level rise scenario of 0.3m by 2050
(associated with close to 2°C warming globally by that time) could increase the frequency of a current 1-in-100-year storm
surge event associated with 1.1m surges to once every 20 years. In 2050, sea-level rise in 2°C and 4°C warming scenarios
is approximately the same, diverging rapidly afterwards. A 2011 study by Dasgupta et al considers the combined effects of
a 10% intensification of storm surges in addition to 1m sea-level rise. Tunisia, Tanzania and Mozambique emerge as among
the most exposed in the developing world (Dasgupta, Laplante, Murray, & Wheeler, 2011) in terms of overall exposure of a
number of indicators: proportion of land area, GDP, urban land area, agricultural area and wetland exposed.
The analysis by (Hinkel et al., 2011) further considers potential economic damage associated with sea-level rise due to
coastal flooding, forced migration, salinity intrusion, and loss of dry land. The African countries projected to experience the
highest damage costs are Mozambique and Guinea-Bissau. Taking into account storm surges, (Dasgupta et al., 2011) find
that the most economically important areas (accounting for more than 25% of GDP) that are prone to storm surges are
located in Tunisia, Tanzania and Mozambique.
In a study by (Hallegatte, Green, Nicholls, & Corfee-Morlot, 2013), Abidjan in Cote d’Ivoire ranks highly in a global ranking
of current exposure of cities in terms of average annual loss (AAL) as a percentage of GDP, with an AAL of 0.72% of GDP.
On projections that assume 40cm sea-level rise by 2050 and take into account socio-economic change, subsidence,
and adaptation (i.e. flood defences) to maintain present flood probability, this could rise to 1.03%, an increase of 44%.
In Alexandria, Egypt, relative AAL is projected to increase from 0.09% of GDP at present to 0.25%. Importantly, these
projections assume better flood defences due to adaptation efforts, which would maintain the frequency of flooding at
current rates. This means that increased damage still projected is a result of the increased extent (not frequency) of flooding
due to climate change, as well as population and economic growth.
Extreme heat events
Summer heat extremes greater than 3 standard deviations (hereafter: sigma) outside of historical variation3 (in other words,
warming three times larger than the magnitude of normal variation experienced in today’s climate) represent prolonged
and high-impact heat waves. 3 sigma events are virtually absent from local climatology today and are here termed “highly
unusual”; 5 sigma events are those that are historically unprecendented. Both are projected to become more frequent with
climate change (Schellnhuber et al., 2012).
In a 4°C warming scenario, almost all (80-100%) boreal summer months (JJA) in North Africa are projected to experience
heat events that are currently considered highly unusual (Figure 2.3 – land areas, left panel), by the end of the century.
Approximately half of North African summer months could see heat events that are historically unprecedented (Schellnhuber
et al., 2012). In Sub-Saharan Africa 60-100% of austral summer months (DJF) could be highly unusual (Schellnhuber et
al., 2013). In tropical central Africa, currently unprecedented warm months are projected to become the new normal,
occurring annually (Schellnhuber et al., 2012); this is in large part due to small historical variation in the equatorial belt.
With 2°C warming, the picture is very different. Highly unusual heat events are experienced in 60-80% of summer months
only in parts of central Africa; in 40-60% of months in the Horn of Africa and North Africa; and in 0-30% of months in
southern Africa. Unprecedented warm events remain largely unknown for Africa, except for tropical central Africa where
they are projected to occur with 20-50% frequency.
3 Such events – termed “highly unusual” in this report – would have a theoretical rate of occurance of once every 740 years. Another class of
events assessed here – termed “unprecedented” – are 5-sigma events and would be virtually absent in historical climatology, with a theoretical return
time of several million years
7 Africa Adaptation Gap Technical Report :Climate-change impacts, adaptation challenges and costs for AfricaYou can also read


