STORM WEATHERING THE Extreme weather events and climate change in Africa
←
→
Page content transcription
If your browser does not render page correctly, please read the page content below
RESEARCH LABORATORIES

WEATHERING THE

STORM
Extreme weather events and climate change in Africa
WEATHERING THE

STORM
Extreme weather events and climate change in Africa

Authors:
Kathryn A. Miller,
Ndoni Mcunu,
Andreas Anhäuser,
Aidan Farrow,
David Santillo & Paul Johnston.

Greenpeace Research Laboratories Technical Report (Review) 04-2020

Cover photo credit Jan-Joseph Stok

                                                                     RESEARCH LABORATORIES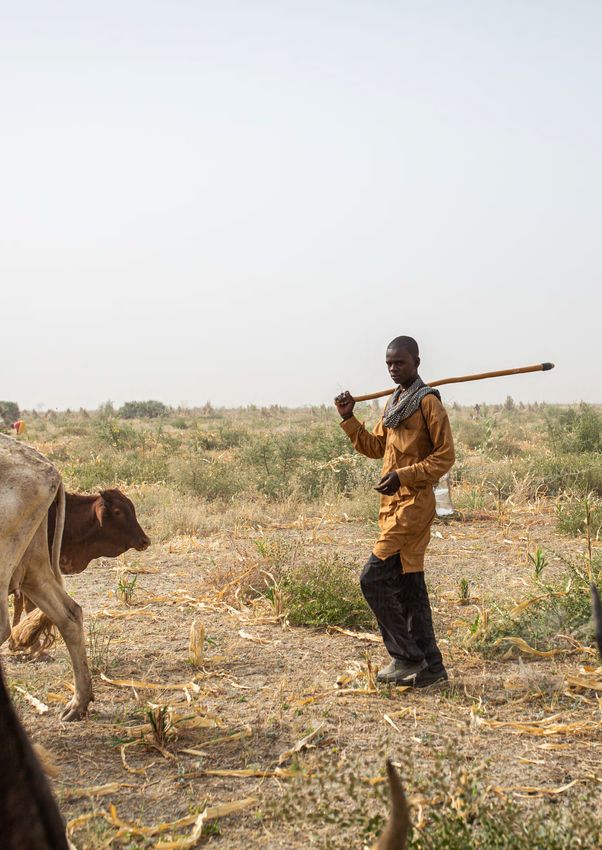
Table of contents
Take-home messages                             5    5.0 The implications of extreme weather
                                                        events on African communities          35
1.0 Introduction                               6       5.1 Human health and heat exposure      35
   1.1 Africa in context                       7          5.1.1 Human survival in a hot and
                                                                humid future                   35
2.0 An overview of the intensity and                   5.2 Urbanisation                        37
    frequency of extreme weather events        12      5.3 Food and water security             37
    2.1 Heatwaves in Africa                    14      5.4 Locust swarms                       39
    2.2 Drought in Africa                      15      5.5 Conflict                            40
    2.3 Rainfall in Africa                     17      5.6 Biodiversity                        42
       2.3.1 Surface water and runoff          17      5.7 Impacts on economic well-being      42
       2.3.2 Storms                            17
    2.4 Tropical storms and cyclones in             6.0 Concluding remarks                     44
        Africa                                 19
   2.5 Wildfires in Africa                     21   7.0 Definitions and assumptions            45
       2.5.1 Savannah                          21
       2.5.2 Wetlands                          21   Box 1: What is extreme weather?            8
                                                    Box 2: An overview of Africa’s weather
3.0 What are the drivers of extreme                       systems                              9
    weather events in Africa?                  22   Box 3: An overview of climate modelling    10
   3.1 The main drivers discussed in Facing         Box 4: African weather drivers 101         13
       the Weather Gods                        22   Box 5: Humans as climate drivers           27
      3.1.1 Inter-Tropical Convergence Zone         Box 6: Advances in climate science since
            (ITCZ)                             22         Facing the Weather Gods              34
          3.1.1.1. IPCC AR5 and the ITCZ       23
      3.1.2 West African Monsoon               23   Recommendations by Greenpeace Africa       47
          3.1.2.1 IPCC AR5 and the West
                  African Monsoon              24   References                                 49
      3.1.3 El-Niño Southern Oscillation
             (ENSO)                            24   Acknowledgements                           53
          3.1.3.1 IPCC AR5 and the ENSO        25
   3.2 Other meteorological systems relevant        Suggested citation                         53
        to extreme weather in Africa           25
      3.2.1 The Mascarene High                 25   Authors                                    54
      3.2.2 Turkana low-level jet              25
      3.2.3 Madden–Julian oscillation          26
      3.2.4 Walker circulation                 26
   3.3 Indian Ocean Dipole                     26

4.0 How might Africa’s weather be
    affected in the future by global climate
    change                                     29
   4.1 Future temperature projections          30
   4.2 Future rainfall projections             30
   4.3 Climate projections from the
       Intergovernmental Panel on Climate
       Change                                  32
   4.4 Records of observational data           32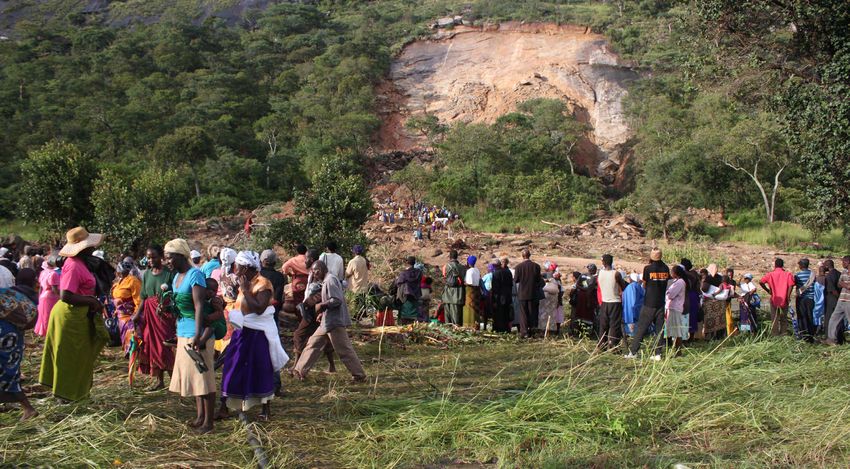
Africa’s climate is visualised as stripes that show how the continent’s average temperature has changed over the
decades from 1850–2019. Each coloured stripe represents one year; warmer years are red and cooler years are
blue. The graphic was developed by Professor Ed Hawkins from the National Centre for Atmospheric Science at
the University of Reading’s Department of Meteorology in the United Kingdom. Billions of pieces of data were used
to create hundreds of images that cover every country in the world and which are available to download free of
charge.

To create a climate stripes graphic for other countries, regions and states, or for the global overview, visit:
https://showyourstripes.info

(The graphic is licensed for reproduction as part the Creative Commons Attribution 4.0 International, CC BY 4.0).

Weathering the Storm Extreme weather events and climate change in Africa | GRL-TR(R)-04-2020                        |4
Take-home messages
•   The projection in the Greenpeace report Facing the                •    Climate scientists   have found that anthropogenic
    Weather Gods, published in 2013, was that the African                  climate change         contributed substantially to
    continent would experience higher temperature rises                    the 2015–2016         extreme drought over East
    than the global average, and increasing variance                       and Southern         Africa by accentuating the
    in rainfall over the tropics will lead to more extreme                 natural El Niño       impacts (see section 2.2).
    precipitation events, which could impact around 25%
    of the continent. These broad conclusions still stand.            •    If high greenhouse gas emissions continue,
                                                                           the expectation is for decreased mean annual
•   Climate change is one of the biggest challenges                        rainfall in Southern and Northern African regions
    that African societies are facing and will                             by the mid- to late twenty-first century and an
    continue to face this century and beyond.                              increase in mean annual rainfall in Central and
                                                                           East African regions. Future rainfall patterns for
•   Many African communities are vulnerable to the                         West Africa are uncertain (see section 2.3).
    impacts of extreme weather events because of their
    limited ability to cope and adapt to those events.                •    Whether or not tropical storms and cyclones will
    Limited resources in terms of access to technology,                    increase or decrease in frequency during the
    skills development and economic capacity contribute                    twenty-first century is not certain. Expectations
    to low levels of possible adaptation (see section 5.0).                are broadly for a small increase in the frequency
                                                                           of tropical cyclones that make landfall and
•   In the 100 years from 1900 and 2000, the continent                     impact East Africa from the Arabian sea, and
    warmed on average by 0.5 °C (see section 2.0).                         fewer but more intense tropical cyclones in
                                                                           the Southern African region (see section 2.4).
•   The mean annual temperature increase for
    much of the continent of Africa is projected to                   •    Attributing extreme weather events to one specific
    exceed 2 °C or to fall within the range of 3 °C                        cause is not straightforward. It is important to note
    to 6 °C by the end of the twenty-first century                         that extreme weather events can be caused by natural
    if high emissions continue (see section 2.1).                          variability within the climate system, human activity or a
                                                                           complex interplay between the two (see section 4.0).
•   Studies using numerical climate models at regional
    and global scales project that during the twenty-first            •    Extinction of many endemic African species is
    century, heatwaves will occur more often, at higher                    possible even at the lower end of the range of possible
    intensities, and last for longer as greenhouse gas                     projected temperature changes above pre-industrial
    concentrations increase (see section 2.1). Africa’s                    levels due to climate change (see section 5.6).
    ten hottest years have all been recorded since 2005
    (see section 2.0). Temperature across Africa is                   •    A lack of data, or the existence of unreliable data,
    projected to be hotter than previously experienced in                  for most areas of the African continent over the past
    the recorded past, and to rise faster than the global                  century mean that it is difficult to reach conclusions
    average across most of the continent (see section 4.1).                about trends, most notably for rainfall patterns
                                                                           (see Box 5).
•   Observational data from the second half of the
    twentieth century suggest that heatwave duration
    and intensity have increased over parts of Africa,
    most notably parts of Southern Africa, East Africa
    and the north of the continent. South Africa
    is projected to become drier in the west and
    southwest, and wetter in the east (see section 4.2).
    Observed temperatures indicate that much of Africa
    experienced an increasing trend in ‘cumulative heat’
    by 50% per decade between 1950 and 2017 (see
    section 2.1). ‘Cumulative heat’ is a conceptual metric
    described by the authors to assess the amount of
    ‘extra heat’ generated by extreme heat events. For
    example, if a heatwave is defined as air temperature
    above 30 °C, and the temperature recorded is 33 °C,
    the ‘extra heat’ produced is 3 °C (see section 2.1).

•   Future projections for Africa through the twenty-first
    century follow the global trend in that the frequency,
    intensity and duration of extreme heat events are all
    expected to increase (see section 2.1).

Weathering the Storm Extreme weather events and climate change in Africa | GRL-TR(R)-04-2020                                      |5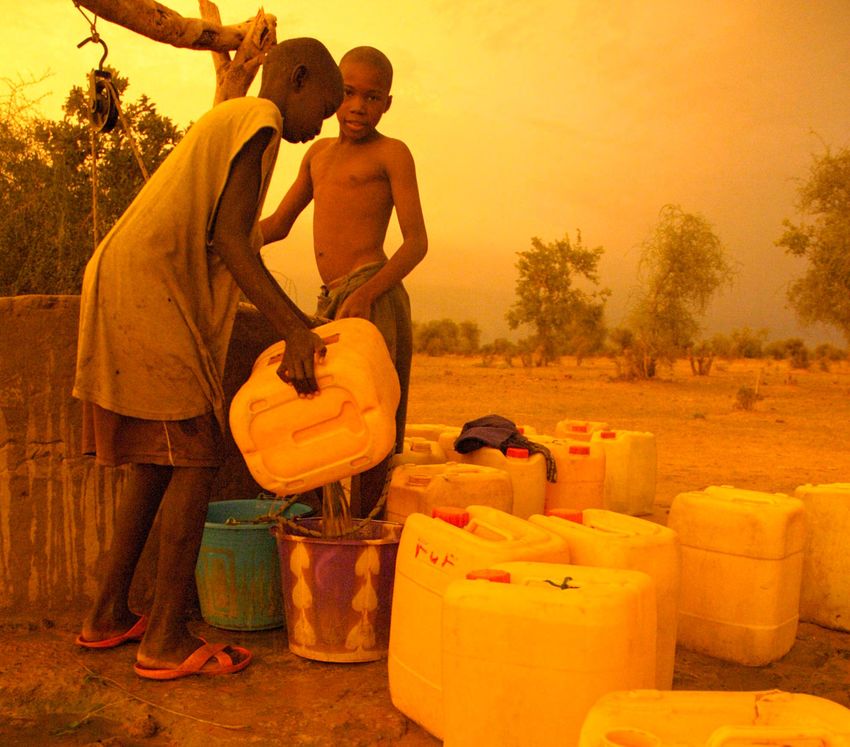
1.0 Introduction
Climate change is one of the biggest challenges that                  The ‘State of the Climate in Africa 2019’ report also
the African continent and its inhabitants are facing this             highlights the impacts of extreme weather on agriculture
century. Regions will be affected differently; the continent          and points out that:
is vast, spans several distinct climate zones. Complex                    “After decades of decline, food insecurity and
meteorological drivers are at play, including the Inter-                  undernourishment are on the rise in almost all sub-regions
Tropical Convergence Zone, the El Nino-Southern                           of sub-Saharan Africa.”
Oscillation the West African Monsoon and the Indian
Ocean Dipole, all of which may be impacted to some                    As we enter the third decade of the twenty-first century,
degree by climate change.                                             it is appropriate to revisit and update the findings and
                                                                      observations made in Facing the Weather Gods.
This report, Weathering the Storm, builds upon the                    The intervening years have seen improvements in
2013 Greenpeace Facing the Weather Gods report,                       science and climate modelling, and a wealth of published
which broadly concluded that climate change impacts                   literature (for example, Scholes et al., 2015; Sylla et al.,
for the African continent could be severe by the end of               2016; Girvetz et al., 2019) on global and regional climate
the twenty-first century and that the need to make deep               change, as well as vast datasets detailing demographics,
cuts to global greenhouse gas emissions is urgent.                    climate and land-use change.
Facing the Weather Gods concluded that although the
general trend would be for a warmer and drier continent,              In many parts of Africa, the impacts of climate change –
some countries and regions would be affected more                     heatwaves with greater intensity, duration and frequency,
profoundly than others. The expectation in 2013 was                   together with droughts, more intense storms, more extreme
that the continent would experience higher temperature                rainfall events and crop failures – will be exacerbated by
rises than the global average, and increasing variance                a combination of growing population, urbanisation and
in rainfall over the tropics would lead to more extreme               lack of access to information and resources (including
precipitation events, which could impact around 25% of                money) to protect homes from extreme heat and from
the continent. These broad conclusions still stand, but               floods. Temperatures over the central interior regions
during the intervening years the science has become                   of Southern Africa have been rising at about twice the
more sophisticated and this report addresses those                    average global rate of temperature increase over the
areas that most urgently point to the need for action.                past five decades (Engelbrecht et al., 2015).

Among the key climate projections in relation to the                  As the climate continues to warm due to continuing
African continent from the most recent (Fifth) Assessment             greenhouse gas emissions from the burning of fossil
Report from the International Panel on Climate Change                 fuels and other human activities, the world’s traditional
(Stocker et al. 2013, Table TS.2) are:                                weather patterns are predicted to change. At the
• increased summer monsoon rainfall in West Africa;                   same time, it must be acknowledged that the global
• increased rainfall during the short rains in East Africa            and regional dynamics that influence weather patterns
     (linked to increased sea surface temperature in the              remain uncertain, particularly so in a climate changing
     Indian Ocean); and                                               world. As a consequence, the models that make climate
• increased rainfall extremes from landfall cyclones on               projections carry a high degree of uncertainty (Cook et
     the east coast, including Madagascar.                            al., 2014). What is clear, however, is that all weather, and
                                                                      the systems that drive it, are taking place in a world that
The ‘State of the Climate in Africa 2019’ report by the               has already experienced climate change.
World Meteorological Organisation (WMO, 2020) points
to temperature and precipitation as being the two key                 Greenpeace’s updated report, Weathering the Storm,
indicators that characterise the current climate in Africa            aims to assess the current state of scientific knowledge
and which continuously affect living conditions on the                regarding the trends and drivers of extreme weather
continent. Confirming the broad warming trends that                   events in Africa, by inter alia:
have been observed over most of Africa, the WMO report                reviewing the available data on the intensity and
also points out that in 2019, Northern and Southern Africa            frequency of extreme weather events;
were much drier than normal while much of the Sahel                   providing updated projections for the future that are
and western Central Africa were much wetter. Added to                 based on the latest climate models; and
this was the fact that rains were more erratic than normal.           discussing the implications of extreme weather events on
Near-term predictions for 2020–2024 suggest:                          human health, food security, resilience to extreme events,
                                                                      biodiversity and human conflicts.
•   Continued warming, especially over Northern and
    Southern Africa;                                                  Efforts have been made to limit the use of complex technical
•   Decreased rainfall over both Northern and Southern                terms in this report. However, explanations of commonly
    African sub-regions;                                              used terms and concepts are included in section 7.0.
•   Increased rainfall over the Sahel.

Weathering the Storm Extreme weather events and climate change in Africa | GRL-TR(R)-04-2020                                      |6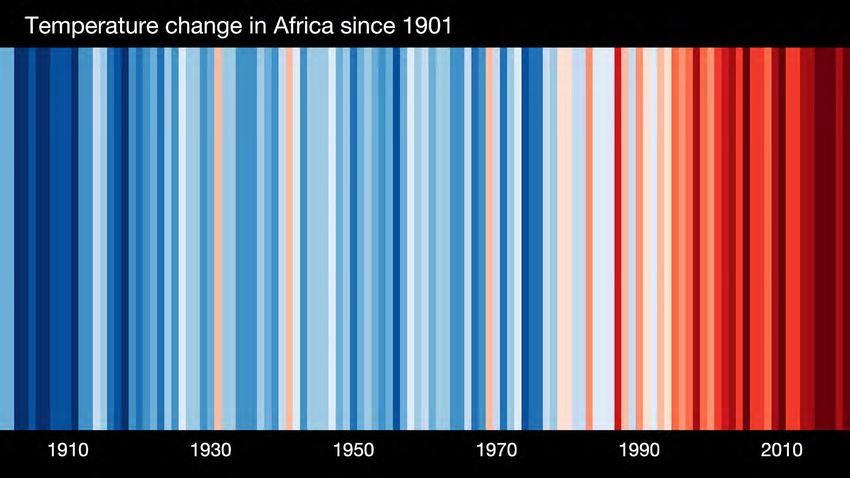
1.1 Africa in context
Africa is the world’s second largest continent and covers             of sub-Saharan Africa is expected to increase from
a total land area of approximately 30,365,000 square                  1.06 billion in 2019 to 3.7 billion in 2100 (UN, 2019a).
kilometres (km2) (11,724,000 square miles). This is                   The population increase is projected to be driven by
around 20% of the total global land mass. The continent               a decrease in mortality of children under 5 years old
is bisected by the Equator, which means that much of the              and an increase in life expectancy (males and females
land mass is in the tropics.                                          combined) from around 63 years in 2020 to around 75
                                                                      years in the 2090s. In addition, the continent of Africa
Noteworthy physical characteristics are the Sahara                    (together with Asia) is predicted to experience the
desert in the northwest, the world’s second largest                   fastest rate of global urbanisation during the twenty-
rainforest in the Congo Basin of Central Africa and the               first century. Currently, 43% of Africa’s population
6,400 km (4,000-mile)-long East African Rift System.                  (424,000,000 people) is urban; by 2050 this figure is
Africa has many mineral resources but the economies of                predicted to increase to almost 60% (1,258,000,000
most countries are dominated, in terms of employment-                 people). However, urbanisation is not expected to be
share, by subsistence agriculture, the productivity of                uniform across all African countries (UN, 2019b).
which is expected to be severely negatively impacted
by climate change and overexploited soil. In spite of its             Africa crosses the equator and extends to the northern
large landmass, Africa’s population was an estimated                  and southern latitudes and as a result its mix of climatic
1.35 billion in 2020, or 16% of the global population. The            conditions is extremely varied. Climatic zones include
most populated regions of the continent are near lakes                humid tropical rainforest in the equatorial regions,
and along river basins, in coastal West Africa, Northern              seasonally arid tropical regions, desert and also
Africa and some highland areas. The population                        subtropical Mediterranean regions (Hulme et al., 2001).
density is lowest in the desert and savanna regions                   The continent encompasses equatorial tropical forest
(ourworldindata.org; britannica.com; Niang et al., 2014).             ecosystems, tropical and subtropical woodlands and
                                                                      savannas, tropical grasslands, arid shrublands and
Sub-Saharan Africa is home to more than half of the                   desert vegetation (Midgley & Bond, 2015). The different
world’s extreme poor, amounting to approximately                      climates make projecting future climate changes a
400 million people. Most of those people live in rural                challenge for climate scientists. Challenges in making
areas and work in agriculture (Porciello et al., 2020).               future climate projections are also because future
The significance of an increase in population figures                 greenhouse gas emissions are difficult to predict, and
is that climate extremes such as heat and rainfall are                different climate systems may also react in unpredictable
likely to disproportionately affect those who are least               ways to climate forcing.
equipped to cope with the impacts of such events.
As the twenty-first century progresses, the population

Residents in the Goromonzi District, Zimbabwe gather for a
funeral after heavy rains caused a landslide and mudslide, leaving
a scar in the side of the mountain. The mudslide killed an 89-year-
old man and some livestock and completely destroyed his home.

                                                                                                                        © Angela Jimu

Weathering the Storm Extreme weather events and climate change in Africa | GRL-TR(R)-04-2020                                 |7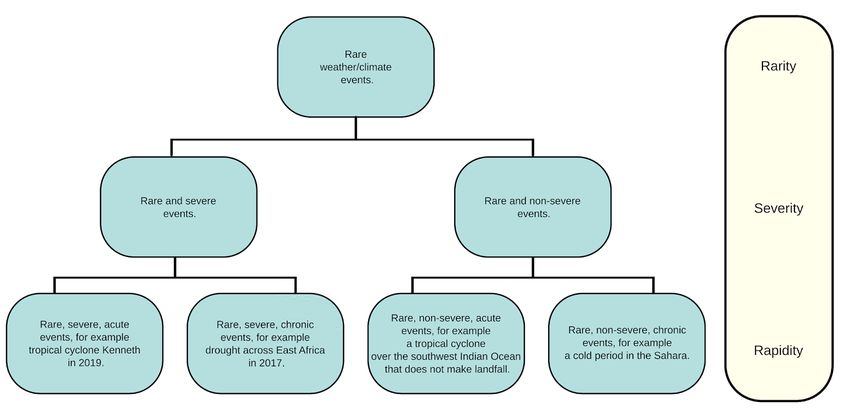
Box 1: What is extreme weather

   No universally accepted definition of ‘extreme                     Extreme weather events can reflect changes in one
   weather’ exists, even though an extreme weather                    or more underlying drivers, and the frequency and
   event might be described as such by those who                      severity of events can change as a result (Scholes
   experience unusual weather. The nature of ‘extreme’                et al., 2015).
   is relative to the normal or prevailing conditions. For
   example, a heatwave in Lesotho would have different                For the purposes of this report, the term ‘extreme
   temperature readings to a heatwave in Mali even                    weather’ is used to indicate weather conditions
   though the magnitude of change from the usual                      regarded as unusual or exceptional for the time of year
   temperature might be similar.                                      or season and that may have negative social and/or
                                                                      environmental consequences. The extreme weather
   Extreme weather events are also described as rare                  events covered in this report are consistent with
   events (and humans are not well adapted to cope with               the meteorological perspective: high temperatures,
   them) or severe events (that create loss or damage to              droughts, floods and cyclones. Extreme weather may
   infrastructure and/or ecosystems). Extreme weather                 cause death, starvation, damage to ecosystems,
   events generally involve a number of variables that                housing, infrastructure and agriculture, and may
   include a combination of climate variables and drivers             lead to evacuation or migration of inhabitants or crop
   and the location of such an event will determine its               failure. Events and issues associated with or caused
   overall impact (Fig. 1) (Stephenson, 2008).                        by periods of extreme weather that are covered in this
                                                                      report include those to human health, food and water
                                                                      security, biodiversity, fire and locust swarms.

   Figure 1. A schematic describing rare, or extreme, weather events. Adapted from: Stephenson, 2008.

Weathering the Storm Extreme weather events and climate change in Africa | GRL-TR(R)-04-2020                                    |8
Box 2: An overview of Africa’s weather
systems
The weather systems and phenomena that most twenty-first century and that changes in temperature
affect climate variability in Africa are the West African will be greater over Northern and Southern Africa than
Monsoon (Lafore et al., 2011), El Niño Southern Central Africa. Modelled projections of rainfall patterns
Oscillation, sea surface temperature in the Indian and through the twenty-first century to 2100 are less certain
Atlantic oceans, and tropical cyclones (that affect than those relating to temperature, but generally
East Africa, Southern Africa and the Madagascan agree that Northern and Southern Africa will become
coastal regions) (Christensen et al., 2013, section significantly drier from around the middle of this century,
14.8.7). Climate scientists are concerned because whereas Central and Eastern Africa regions are likely
global warming-induced changes to major climate to experience increases in mean annual rainfall. In the
systems – including to drivers of African weather eastern regions the projection is for an overall wetter
such as the West African Monsoon and the El Niño climate with more intense wet seasons. Future rainfall
Southern Oscillation – could pass a tipping point this patterns for West Africa have varied projected outcomes
century that could induce rapid, irreversible climate (Niang et al., 2014). The projections broadly agree with
changes (Lenton, 2011). A brief description of these those made in AR4. The IPCC AR5 report (as with AR4)
climate systems is in Box 4. approaches the continent of Africa on a continental or
regional basis when it discusses observational and
The Intergovernmental Panel on Climate Change projected climate trends.
(IPCC) AR5 climate scenarios project that mean annual
temperatures across Africa will increase during the
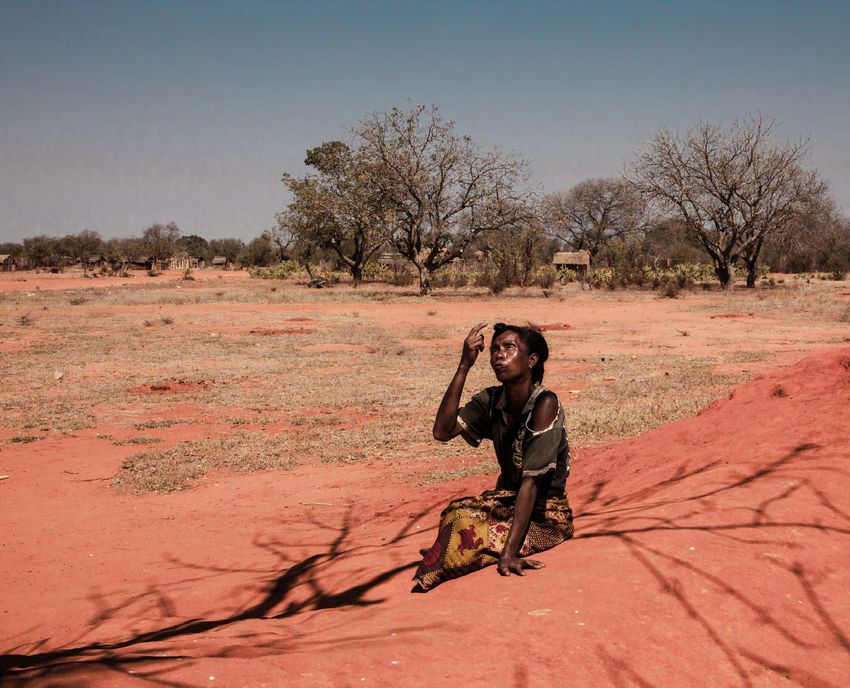
Alerta, a 50-year-old resident of Ampotake, a village in southwest
Madagascar, sits at the place where rainwater is supposed to
accumulate and constitute the village’s drinking water reserve. The
periods of drought in south Madagascar are known by the Malagasy
people as ‘kere’, and are increasing in duration every year.
© Rijasolo / Riva Press
Weathering the Storm Extreme weather events and climate change in Africa | GRL-TR(R)-04-2020 |9Box 3: An overview of climate modelling
Future climate projections are made using computer Uncertainties
models. There are two broad categories of climate The uncertainties in climate model results stem
models: from three principal areas: scenario uncertainty (for
i. dynamical models, that are based on the physical example, uncertainty in the future atmospheric carbon
climate processes; and dioxide concentration); natural variability (the day-to-
ii. statistical models that are based on observational day or decade-to-decade variation in weather and
data. climate); and model uncertainty (models are never
perfect representations of the climate system). In
Dynamical models are computer programs that simulate comparison to other global regions, Africa has a lack
the chemical, physical and biological processes that of observational weather data from which to assess
control climate. These models can be ‘atmosphere- climate trends (Han et al., 2019). The incomplete
only’, ‘ocean–atmosphere’ or ‘Earth System’ models, knowledge of the climate system, especially in Africa,
depending on which parts of the climate system contributes to model uncertainty. Some climate
are included (atmosphere, oceans, land, biosphere models have known deficiencies in simulating the
and cryosphere). Each model type has advantages mean rainfall patterns and variability in Africa’s
and disadvantages for researchers. For example, weather patterns (James & Washington, 2013). In
atmosphere-only models are not able to simulate how South Africa, for example, the models currently in use
the ocean and atmosphere interact. This means that for operational purposes were developed in countries
the model runs quickly and that uncertainty from the outside of Africa. Accordingly, the models may not
ocean model does not influence the result. However, be adequately ‘tuned’ to simulate local conditions
atmosphere-only models are limited by the assumption (Bopape et al., 2019).
that the climate change process being investigated
does not influence the state of the ocean (Stone et al., Researchers can estimate uncertainty by comparing
2019) and therefore cannot capture feedback effects. the results of many different models, each run multiple
times. Models are run many times to introduce small
By contrast, statistical models do not replicate chemical, changes to the initial conditions in each model run.
physical and biological processes. Instead, statistical This produces different outcomes for each run of the
models are derived from the analysis of past weather same model. When the same result is produced by
patterns. The models are generated by deriving multiple climate models they can be more confident in
relationships between different climate parameters in the prediction. This is because each climate model is
meteorological archives. They can then be projected different and is likely to have different inherent errors or
forward in time to indicate how these parameters might biases. Therefore, if different models produce the same
evolve. Statistical models reduce the complexity of the result, that result is less likely to be a consequence of
model needed to make a forecast. They are especially a deficiency in the model and more likely to represent
useful for predicting local weather patterns that have a real climate effect. Model Intercomparison Projects
complexities not included in dynamic models. A key (MIPS) are also used extensively in climate research,
limitation of statistical climate modelling is that the for example CMIP3 and CMIP5.
model may not correctly represent climates that are
significantly different to the meteorological archives Developing climate models
used to design them. Work to improve climate modelling aims to understand
the discrepancies between the climate projections
Model accuracy generated by model simulations and observational
Climate scientists usually measure the accuracy of a data collected from the field. This provides new
model by comparing their simulation with observational understanding of the climate system allowing models
data. For example, scientists test the climate models to be improved. For example, CMIP3 and CMIP5
that are used to project future climates by simulating model projections overestimated the rain in East
the present climate or past climate – the assumption Africa’s short rains season, which led researchers
being that if the model accurately simulates present to doubt the projections made by models for later
and historical climates then the likelihood is that it will in the century (Yang et al., 2014). Subsequently,
be reliable in projecting a future climate scenario (Xulu analysis of recent and current weather observations
et al., 2020). led researchers to conclude that the sea surface
temperature of the western Indian Ocean is closely
Studies are now also beginning to evaluate climate
related to the rains over East Africa (Yang et al., 2015).
model predictions made decades ago to subsequent
observations of what then actually occurred. One
Choose your model
study concluded that, in general, projections
Different models have known strengths and
published over the past five decades have been
weaknesses, and the best model will depend upon
accurate in predicting the changes to global mean
the region in question and the type of projection being
surface temperature which have since been observed
made. Global climate models focus on the overall
(see Box 5) (Hausfather et al., 2020).
picture but may not accurately represent regional
Weathering the Storm Extreme weather events and climate change in Africa | GRL-TR(R)-04-2020 | 10areas because the resolution is too coarse, which not experienced anthropogenic greenhouse gas
is why regional models are favoured for smaller emissions. Such simulations include data from the
areas of a country or continent. Dynamic models pre-industrial period (circa 1850) and natural forcings
used to project the East African climate have been such as volcanic aerosols and solar irradiance
good at predicting the short rains and the Indian (Christidis & Stott, 2014). This allows scientists to
Ocean Dipole but not good at predicting extreme estimate how our future climate might have looked
weather events. As computer climate modelling without human intervention.
becomes more sophisticated there will probably be
fewer uncertainties in projections of future climate An increasing body of attribution studies are evaluating
changes (Nicholson, 2017). the extent to which human activity is influencing the
climate. These studies seek to distinguish between
A future climate with no human intervention events that are the result of human-driven climate
Climate scientists can create computer models to change and events that may result from natural climate
simulate the most likely scenario in a world that has variability and without human intervention.
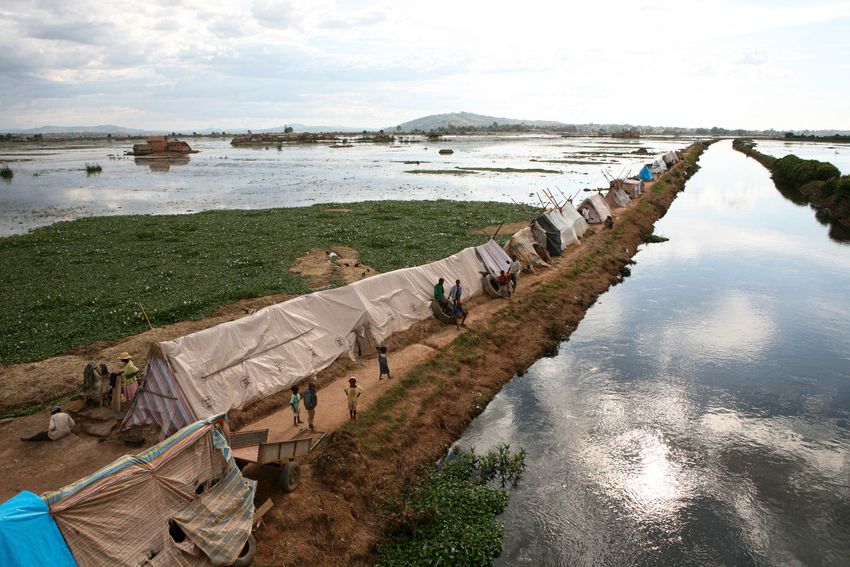
Women are walking through water on a flooded road
outside Lankien, Eastern Bieh State, South Sudan.
© Andreea Campeanu / Greenpeace
Weathering the Storm Extreme weather events and climate change in Africa | GRL-TR(R)-04-2020 | 112.0 An overview of the intensity and
frequency of extreme weather events
The scientific consensus is that, at a global level, land and ocean surface temperature, which fell between
extreme weather events will increase in frequency and 0.44 °C–0.56 °C above the 1981–2010 average (Blunden
intensity as the twenty-first century progresses (for an & Arndt, 2020). Future projections for this century for
overview of extreme weather, see Box 1). Land and the African continent are increases in mean surface
ocean temperatures have increased on a global scale temperature that exceed the global mean, and an
since pre-industrial times (Hoegh-Guldberg et al. 2018). increase in the frequency of exceptionally hot days (see
Last year, 2019, was one of the world’s three warmest section 4.1).
years since records began; data show that 2014–2019
were the six warmest years since records began in Multi-model projections (using the World Climate
the late 1800s (Blunden & Arndt, 2020; NOAA, 2020). Research Programme (WCRP)’s Coupled Model
The rate of temperature increase is not expected to be Intercomparison Project phase 3) for Africa under
uniform across the globe and some regions have already 1 °C, 2 °C, 3 °C and 4 °C warming scenarios project
exceeded an annual average rise of 1.5 °C; the changes that average temperatures across the continent will
are particularly noticeable in the Arctic in the cold season rise more than the global average. The magnitude of
and in mid-latitude regions in the warm season. Globally, changes will increase in line with increased warming
the trend for rainfall is for increased occurrence of once- scenarios, with the greatest impacts being predicted for
rare events (Chen et al., 2020). 3 °C and 4 °C scenarios. There are greater uncertainties
regarding future rainfall patterns. Models predict that
Hulme et al. (2001) estimated that the African continent there will be changes to rainfall across the continent,
warmed on average by 0.5 °C between 1900 and 2000, but the nature of those changes (more rain, less rain,
although others have documented a global average more intense rain or changes to the seasonality of rains,
temperature change of 0.89 °C over the same period; the for example) is uncertain, especially in tropical regions.
warming is primarily attributed to human activity (Perkins, The precipitation trends from a number of models,
2015). More recently, however, the United States National however, project a wetter East Africa and changing
Oceanic and Atmospheric Administration (NOAA, 2020) rainfall patterns over the Sahel with some models
suggested a considerably greater average increase of projecting an increase in rainfall over the central Sahel
0.12 °C per decade for the African continent. Analysing and a decrease over the western Sahel (see Box 2).
the data on such a decadal basis also indicates that, at
both a global and continental level, the rate of temperature Observational data appear to support the projections.
increase has been greater in the past few decades. The World Meteorological Organisation (WMO, 2020)
For example, from 1880 and for much of the twentieth notes that in 2019, rainfall deficit in Southern Africa
century until 1970, the global average rate of increase during the 2018–2019 season exacerbated an existing
has been estimated to have been around 0.07 °C per drought, but that heavy rainfall in 2019 led to flooding,
decade, increasing to an average rate of 0.18-0.19 °C and the footprints of rainfall from cyclones Idai and
per decade from 1971 to the present day (Blunden & Kenneth were clearly visible in the annual precipitation
Arndt, 2020). In terms of Africa, the most recent estimates anomalies despite the preceding drought conditions.
from NOAA (2020) suggest an increase from the 0.12 °C Erratic rainfall in East Africa meant that an incipient
per decade before 1981 to a much faster rate of 0.31 °C drought was superseded by flooding. In addition to East
per decade since then. The latest ‘State of the Climate Africa, much of the Sahel recorded above normal rainfall.
in Africa 2019’ report (WMO, 2020) notes that in 2019,
temperatures were averaged across mainland Africa The accumulation of anthropogenic greenhouse gases in
at between 0.56 °C and 0.63 °C above the 1981–2010 the atmosphere, largely from fossil fuel production and use,
long-term mean. The report says that 2019 was probably is of such magnitude that even if all emissions of climate-
the third warmest year on record after 2010 and 2016. harmful gases were stopped immediately, there would
Temperatures in excess of 2 °C above the 1981–2010 not be immediate stabilization of atmospheric gases. The
average were recorded in South Africa, Namibia and in reason is firstly because of the complexity of the climate
parts of Angola. system and carbon cycle, and secondly because the
persistence of greenhouse gases and aerosols in the
The upward trend in average annual temperature atmosphere varies from just days to thousands of years.
over Africa is evident from data observations and the To remove all anthropogenic methane would take around
continent’s ten hottest years have all been since 2005 50 years, but to remove all anthropogenic carbon dioxide
(Blunden & Arndt, 2020). At least three regions of Africa (CO2) could take several hundred years (Collins et al. 2013,
experienced temperature anomalies last year, in 2019, p1106). Clearly, the scenario is hypothetical because it is
according to data analysed from two different datasets implausible that all greenhouse gas emissions will cease
(HadCRUT 4.6 and NASA GISS). East, West and Southern immediately, but the exercise is useful as an example of a
Africa recorded land surface temperature increases of ‘best case’ scenario to highlight the urgent need to slow
between 1–2 °C in comparison to the 1981–2010 base and stop emissions.
period. The increases are greater than the 2019 global
Weathering the Storm Extreme weather events and climate change in Africa | GRL-TR(R)-04-2020 | 12Box 4: African weather drivers 101
El Niño–Southern Oscillation (ENSO) the western Indian Ocean region and cooler in the
The ENSO influences extreme weather events east, bringing heavy rainfall to East Africa. A negative
globally, causing floods in some regions and droughts dipole is the opposite and causes drier conditions in
in others. It is a naturally occurring oscillating East Africa. The effects of the IOD are exacerbated if
interaction between the tropical Pacific Ocean and the dipole is strongly positive or negative, which can
the atmosphere that is composed of two alternate, bring flash floods or prolonged drought, respectively.
opposing phases: El Niño and La Niña. El Niño occurs The IOD also affects weather systems in Australia and
irregularly about every three to seven years and brings Southeast Asia.
warm, dry air to Southern Africa and cool air and rain
to equatorial East Africa. The opposite happens in La Inter-Tropical Convergence Zone (ITCZ)
Niña years – cool air and rain to Southern Africa and The ITCZ is a band of clouds that forms across the
warm, dry air to equatorial East Africa. tropics. In Africa, the ITCZ brings seasonal daily
intense rainfall between latitudes of approximately
Indian Ocean Dipole (IOD) 23.5° N and S. The ITCZ shifts seasonally towards the
The IOD refers to an irregularly alternating sea- hemisphere that is warmer in relation to the other but
surface temperature difference in the waters of the the precise mechanisms that control its position, and
west and east Indian Ocean. A positive Indian Ocean rainfall intensity, are unclear.
Dipole means that sea temperatures are warmer in
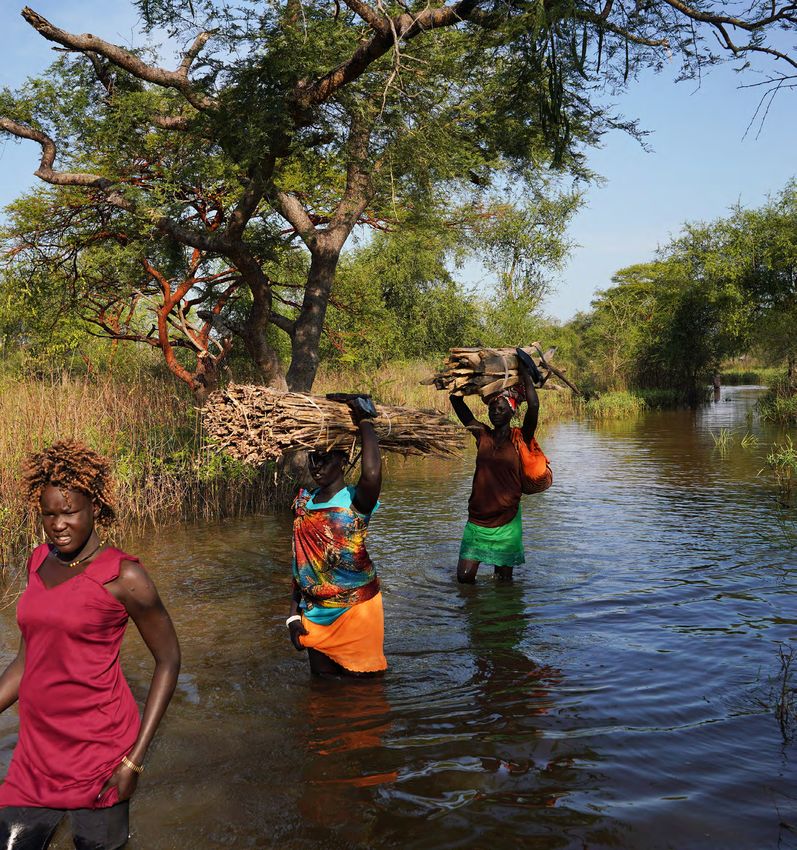
Children draw water from a well in Fuuta,
northeast Senegal, during harmattan, a season
that runs from November to March and is
characterised by dust-laden winds.
© Clément Tardif
Weathering the Storm Extreme weather events and climate change in Africa | GRL-TR(R)-04-2020 | 132.1 Heatwaves in Africa show that Africa has experienced an increase in mean
annual temperature over the past 50–100 years and
Heatwaves are periods of time in which the ambient projections suggest that the trend is set to continue. In
or outdoor air temperature is higher than usual. Many comparison to the mean annual temperature in the late
people will have experienced what they perceive to be a twentieth century, the mean annual temperature increase
heatwave, but the definition is subjective. In the scientific for much of the continent of Africa is expected to exceed
literature, the definition of a heatwave is inconsistent – it 2 °C, and possibly fall in the range 3 °C to 6 °C, by the
is not possible to provide a universal definition or metric end of the twenty-first century if high emissions continue
of a heatwave to cover all global regions. Heatwaves (Niang et al., 2014).
develop when high-pressure synoptic weather systems
(an anticyclone) remain in the same location for a longer A warming climate over the next 50 years is projected to
period than expected, which could be days or even lead to the displacement of an estimated 1-2 billion people
months. Other factors are involved in the formation of globally (figures specific to African countries are not
heatwaves include low soil moisture and teleconnections available), particularly those who live in the desert regions
with other climate systems (Perkins, 2015). along the equator, as the mean annual temperature in
some regions exceeds 29 °C. According to Xu et al.
Observed data using figures from the second half of (2020), introducing strict climate mitigation measures and
the twentieth century suggest that heatwave duration stopping greenhouse gas emissions, as in the RCP2.6
and intensity has increased over parts of Africa, most scenario, will reduce the impact of global heating on the
notably parts of Southern, East and Northern Africa. human population in the most vulnerable regions.
The observational temperature data indicate that much
of Africa experienced an increasing trend in ‘cumulative Although much research into the nature of heatwaves
heat’ by 50% per decade between 1950 and 2017 has been carried out globally over the past 10-15 years,
(Perkins-Kirkpatrick & Lewis, 2020). This study used there are still data-poor regions, of which Africa is one
‘cumulative heat’, a new conceptual metric to assess the (along with Central and South America, and India).
duration and intensity of heat waves during a season. Further research is needed to understand the extent to
For example, if a heatwave is defined as air temperature which human activity is causing changes to the systems
above 30 °C, and the temperature recorded is 33 °C, a that cause heatwaves and to investigate how climate
temperature anomaly of 3 °C is produced. If the period variability will affect heatwave formation (Perkins, 2015).
of the heatwave lasted for 5 days, the ‘cumulative heat’
produced will be 15 °C. On this basis, the authors In summary, global observed data have shown an
estimated that the extra (cumulative) heat produced by increasing trend in the overall number and frequency of
heatwaves over parts of Africa is increasing by 10 °C per heatwave days from the twentieth and into the twenty-
decade (Perkins-Kirkpatrick & Lewis, 2020). first century. Future projections for Africa through the
twenty-first century follow the global trend in that the
Studies using numerical models at regional and global frequency, intensity and duration of extreme heat events
scales project that during the twenty-first century, are expected to increase. The data trends that show
heatwaves will occur more often, at higher intensities, the long-term increase in ambient temperature will be
and last for longer under enhanced greenhouse gas important to policy makers to develop strategies to cope
concentrations (Perkins, 2015). Modelling studies with extended periods of heatwaves and also periods
project that the continent of Africa will experience an of intense heatwaves. Recommendations from climate
increased number of hot and humid days as the century scientists are to monitor heatwave events on a global
progresses, with a median increase of 2.5 heatwave level for three to four decades to enable the broad trends
events per season over Central and Southern Africa to be more accurately assessed and better understood.
(Perkins-Kirkpatrick & Gibson, 2017). Parts of Africa Determining heatwave trends using data from fewer than
(together with Central America and the Middle East) are several decades can be difficult because heatwaves
projected to experience the greatest impact of heating are susceptible to internal climate variability, which
and might experience an increase in heatwave duration means that short-term trends may not indicate long-term
by 10–12 days per season for every one degree of global changes (Russo et al., 2016; Perkins-Kirkpatrick & Lewis,
heating (Perkins-Kirkpatrick & Gibson, 2017). Another 2020). Failing to take measures, however, to reduce
projection (Rohat et al., 2019) suggests that by the emissions while such studies are carried out to develop
2090s, the number of people living on the continent of the evidence base would result in the time window for
Africa who will be exposed to dangerous heat conditions effective action being seriously compressed.
may reach 86–217 billion person-days per year. The
variance in the figures is because the computer model
used different scenarios using 12 Shared Socioeconomic
Pathway (SSP) – Representative Concentration Pathway
(RCP) combinations.
But it is not only the infrequent but extreme heat events
that are becoming more common; less extreme but also
higher-than-usual temperatures are being experienced
and can create long-term heat stress. Observational data
Weathering the Storm Extreme weather events and climate change in Africa | GRL-TR(R)-04-2020 | 142.2 Drought in Africa The following year, in 2017, an extensive drought across
East Africa affected Tanzania, Ethiopia, Kenya and Somalia
Drought can cause economic loss, bring crop failures, when the March–June rains failed. Research indicates
put food security at risk, and can lead to a shortage of that exceptionally warm sea surface temperatures in
safe, clean drinking water. Drought is an extended period the western Pacific and failure of the rains that caused
of time in which a region receives less precipitation than the drought conditions in East Africa are associated
expected. But attributing a drought – as with other extreme with ENSO variations. Attribution research using climate
weather events – to just one cause is not straightforward model simulations indicates that the extreme sea surface
because extreme events are usually caused by several temperature difference would be extremely unlikely
different (albeit interacting) factors (see section 4.0). without climate change driven by human activities (Funk
et al., 2019). The humanitarian consequence was that the
Attribution research is a growing field of study that can people living in the worst affected regions experienced
help to evaluate the extent to which an extreme event has near-famine conditions (Collins et al., 2019).
been driven by climate change. Research investigating
the 2011 drought in East Africa found that anthropogenic Models used to project drought over Southern Africa
climate change increased the risk of failure of the long suggest that, with increased global heating, the intensity
rains in 2011, which had preceded the drought and led and frequency of drought conditions will increase but
to dry conditions. But the same piece of research found not all regions will be affected equally. A study focused
that human influence was not significant in the failure of on four major Southern African river basins (Orange,
the 2010 short rains, which also created dry conditions Limpopo, Zambezi, and Okavango river basins that were
but were greatly affected by La Niña (Lott et al., 2013). chosen for their economic importance in agriculture,
mining, power generation and industry) projected that at
Between 2015 and 2017 the Western Cape province 2 °C above the pre-industrial baseline (1861–1890) there
in the southwest of South Africa was affected by three would be a statistically significant increase in drought
consecutive years of below-average precipitation. This, intensity over the southwestern coast, and an increase
in turn, led to a serious water shortage in Cape Town with in drought frequency by two events per decade. If the
the possibility of a complete failure of the water supply average annual temperature increases further, by 3 °C
at a point designated as ‘Day Zero’. When the Day Zero in comparison to the pre-industrial baseline, more than
event was analysed using a risk-based approach as a half of South Africa and Namibia may be severe drought
way of teasing out the part played by climate change ‘hotspots’ (Abiodun et al., 2019).
it was estimated that climate change had made this
otherwise very rare event more likely by a factor of three Modelling studies and observational data suggest that the
(Otto et al, 2018b). tropics (the meteorological term for the moist tropics and
dry subtropics at roughly 30° S and 30° N) are increasing
In another example, the 2015–2016 extreme drought in size and are expanding in a polewards direction.
event in East Africa severely impacted the food and Data suggest that the tropics have widened by around
water security of more than 15 million people in Ethiopia, 0.5° of latitude per decade since 1979 (when routine
Kenya, Somalia and Southern Africa (Funk et al., 2018). satellite observations became possible). A change in
The extreme drought caused severe food shortages and the size of the tropics could lead to changes in the rain
a nine-million tonne cereal crop deficit in the region, which belt and expansion of subtropical desert, as well as
meant that 28 million people had to rely on humanitarian affecting frequency of drought and wildfires. The reasons
food aid (Collins et al., 2019). In 2016, a very strong for the expansion of the tropics is a subject of current
negative Indian Ocean Dipole (see section 3.3), affected scientific research. One early theory was that the cause
the climate over East Africa, which experienced a failure was predominantly human-driven, although more recent
in the seasonal short rains in October–December. During analysis has suggested that several additional factors
that time, some regions received less than 50% of might be involved; as well as anthropogenic greenhouse
their normal rainfall (Lu et al., 2018). Climate scientists gas emissions and other pollutants, natural variability
found that anthropogenic climate change contributed may also contribute. The expectation is that if greenhouse
substantially to the 2015–2016 extreme drought over gas emissions continue then global heating will become
East and Southern Africa by accentuating the natural El the dominant cause driving the expansion of the tropics
Niño impacts. Attributing the 2015–2016 drought entirely (Staten et al., 2018). The expansion of subtropical deserts
to anthropogenic climate change would not be accurate could impact billions of people globally who live in semi-
because of the strong natural variability in the ENSO arid regions by affecting livelihoods through impacts on
and associated sea surface temperatures. However, agricultural yields and the availability of freshwater.
research suggests that anthropogenic climate change
significantly contributed to the exceptionally warm
sea surface temperature during the El Niño and to an
approximate 16% and 24% reduction in rainfall over East
and Southern Africa (Funk et al., 2016; Funk et al., 2018).
Other research also concluded that the drought that so
severely affected East and Southern Africa was caused
by a lack of rainfall exacerbated by a strong El Niño event
that decayed into a weak La Niña (Lu et al., 2018).
Weathering the Storm Extreme weather events and climate change in Africa | GRL-TR(R)-04-2020 | 15A herder takes his cattle out for grazing near
Gaza in the far north of Cameroon.
Weathering the Storm Extreme weather events and climate change in Africa | GRL-TR(R)-04-2020 | 16
© Patrick Meinhardt2.3 Rainfall in Africa Land-use change such as deforestation for agriculture,
pasture and timber can make a significant impact on
Projections for future rainfall patterns over the African landscapes and can impact livelihoods. For example, in
continent are more uncertain than those for future a study focused on the Olifants Basin in northeast South
temperature changes. In other words, climate scientists Africa, urbanisation and agriculture were identified as
are more confident in the accuracy of climate models causing the greatest changes in surface water runoff,
to project future temperature changes than future water yield and evapotranspiration. Land use and land
precipitation changes (see Box 2). cover change analysed using Landsat data from 2000
to 2013 found significant changes in the study area
Neither the new-generation climate modelling using (that drains an area of approximately 50,000 km2) in the
Climate Model Intercomparison Project 6 (CMIP6) (11 balance between urban areas, agricultural lands and
outputs analysed), nor the previous generation CMIP5 rangelands. Rangeland is an area of open land that is
(29 outputs analysed), reached firm conclusions on the not used for growing crops or for agricultural practices,
amount of change expected to rainfall over the Sahel that may be used for hunting or grazing animals and
during the twenty-first century. Greater confidence typically is covered with natural grasses and shrubs.
in precipitation projections over the Sahel (and other Urban areas increased from 13% in 2000 to 23% in
regions) will probably only be achieved with greater 2013 and agricultural land increased from 15% in 2000
understanding of global circulation (Monerie et al., 2020). to 35% in 2013. By contrast, rangeland decreased from
69% in 2000 to 37% in 2013. The study used a model
That said, the general consensus is that under RCP8.5, called the Soil and Water Assessment Tool to simulate
Southern and Northern African regions are projected the hydrological impact of the land-use and land cover
to experience decreases in mean annual rainfall by the change on surface runoff, water yield, lateral flow and
mid- to late twenty-first century. In contrast, Central and groundwater. The most significant impact of the modelled
East Africa are likely to experience increases in mean changes in land use that took place between 2000 and
annual rainfall under RCP8.5 from around 2050 onwards. 2013 was water runoff, which increased by 46.9% over
Projections for future rainfall patterns over the Sahel and the period. In figures, that is an increase of 14.52mm
West Africa are more uncertain because different models surface runoff water on average, annually, across the
have produced different outcomes. However, some Olifants basin in 2013 compared to 2000. A decrease in
regional-scale models project an increase in the number the average annual groundwater recharge from 34mm in
of extreme rainfall days over West Africa and parts of the 2000 to 22mm in 2013 was attributed to increased surface
Sahel during the twenty-first century (Niang et al., 2014; runoff, less soil infiltration and higher evapotranspiration.
Dosio et al., 2020). The authors noted that other studies found similar effects
of urbanisation (Gyamfi et al., 2016).
Another climate modelling study, investigating changes
to extreme weather events in Africa expected from Urban environments tend to lack trees and vegetation and
the middle of the century, projects an increase in the can be adversely affected by extreme weather events that
frequency and intensity of rainfall over the Sahel during can cause runoff (following heavy rainfall), dust storms
the summer rainy season, and an increase in the (in periods of drought) and high heat. Coastal areas
frequency, duration and intensity of rainfall over East and settlements on rivers are vulnerable to sea level rise
Africa (Han et al., 2019). The modelling also projected and flooding from sudden high volumes of water such
reduced rainfall and increased duration of dry periods in as intense periods of rainfall during tropical cyclones.
southeastern Africa. The study has limitations because Measures proposed to make cities more resilient include
it used only one regional climate model; if such findings reforestation of coastal areas to protect against storm
are subsequently confirmed by other models and studies surges and to help absorb excess rainfall, encouraging
then confidence in them would be increased.
urban farming and forestry to absorb water and heat and
to provide cooling shade (Kareem et al., 2020).
To mitigate the impact of unpredictable and/or extreme
rainfall events in future decades, the scientific consensus
2.3.2 Storms
is to try and restrict the average global temperature
rise to 1.5 °C (rather than >2 °C) above pre-industrial
temperatures. Doing so is likely to reduce the number of Storms that form over land are potentially devastating
extreme precipitation days in many regions around the if they coincide with areas of habitation or agriculture
world, including Africa (Chen et al., 2020). because of flooding and run-off. Extreme rainfall events
are predicted to increase in frequency globally with
2.3.1 Surface water and runoff climate change.
Equatorial Africa, over the Congo Basin and the Sahel
Regions subject to extreme rainfall events may experience
regions, are known to experience intense storms;
flooding and accelerated soil runoff. Although the primary
Sahelian storms, for example, occur seasonally (June to
driver of extreme rainfall events and altered rainfall
September) in a narrow band between 10°–18°N across
patterns is climate change, human activity such as land
West Africa during the West African Monsoon. Although
clearance exacerbates the problems that result by, for
defining an ‘intense storm’ is not straightforward, it is
example, enabling greater soil erosion, which leads to
generally accepted that the greater the convective vertical
soil runoff blocking drainage channels.
velocity, the more intense the storm (Zipser et al., 2006).
Weathering the Storm Extreme weather events and climate change in Africa | GRL-TR(R)-04-2020 | 17Rainfall over the Sahel varied during the twentieth are likely to be a combination of factors that include wind
century, with a wet period in the 1950s and 1960s, shear and drying air, coupled with warming temperatures
followed by drought in the 1970s and 1980s, whereas over the Sahara.
rainfall patterns since the 1990s have varied between
years. Research has found that the frequency of the most Projections suggest a rise in extreme daily rainfall over
intense storms – called ‘mesoscale convective systems’ the Sahel if the connection with the warming Sahara
– has increased over the Sahel in the past four decades, continues, but more research is needed to fully explore
according to analysis of satellite data from 1982–2016 this scenario (Taylor et al., 2017). The relevance of these
(Taylor et al., 2017). Mesoscale convective systems are findings is that, with increased frequency and intensity
a collection of intense storms that can last for at least 12 of storms and rainfall, the risk of damaging flash floods
hours. In the Sahel, mesoscale convective systems can also increases. In contrast, current data suggest that the
be vast, exceeding 25,000 km2, and have been shown frequency of intense storms is not expected to increase
on satellite data to coincide with extreme rainfall. The over the Congo Basin.
drivers of these intense Sahelian storms are unclear and
A collapsed road is seen near Chibuto in Mozambique. The South
African Airforce has been helping thousands of Mozambicans who have
been displaced by floods which ravaged the country in 2013. At least 70
people were killed in the floods and 150 000 were left homeless.
Credit: Daniel Born
Weathering the Storm Extreme weather events and climate change in Africa | GRL-TR(R)-04-2020 | 182.4 Tropical storms and cyclones in
Africa
Tropical cyclones are storms that originate over the ocean Tropical cyclones are also affected by wider weather
when the surface water reaches or exceeds around 26 °C. systems. The Mascarene High, for instance, is part
Tropical storms are associated with extreme rainfall and of the weather system that determines the path taken
destructive high winds that can cause damaging coastal by tropical cyclones over the Mozambique Channel
storm surges. The tropical cyclones that most frequently and Southern Africa, which can cause widespread
affect the African continent are generated in the southwest destruction when they make landfall (Xulu et al., 2020).
Indian Ocean basin and make landfall in Mozambique or See also section 3.2.1.
Madagascar. Tropical storms that affect Africa also form
on the Arabian Sea, making landfall in Somalia. Tropical cyclones that form in the North Indian Ocean and
make landfall may affect East Africa. Future projections
Tropical cyclones are graded from 1 (which have a (2070–2100) using modelling scenarios with RCP8.5
diameter of 50-100 km and sustained wind speeds of predict an increase in the genesis of tropical cyclones in
119-153 km/h) to category 5 (up to 500 km in diameter the Arabian Sea, but only a small increase of 0.5 tropical
with wind speeds exceeding 249 km/h). cyclones per decade that will make landfall and impact
East Africa in the future scenario (Bell et al., 2020).
Some of the latest high-resolution computer models
have projected that fewer tropical cyclones will form Nevertheless, cyclones that do make landfall and bring
in the Southern Africa region as the climate warms but extreme heavy rainfall frequently cause severe damage
those that do form will be more intense. This is in line to homes and infrastructure and may lead to outbreak
with projections suggesting that, although the global of disease. Last year, 2019, was exceptionally active for
average number of tropical storms will decrease by southwestern Indian Ocean cyclones including two of the
6–34% by 2100 (Knutson et al., 2010) as the troposphere strongest known cyclone landfalls on the east coast of
is expected to hold more water vapour and latent heat Africa. In March 2019, one of the most severe tropical
than at present, the globally averaged intensity of tropical cyclones ever recorded in the southern hemisphere
cyclones will increase by 2–11% over the same period. made landfall in southeast Africa (WMO 2020). Cyclone
Increased intensity of tropical cyclones could enhance Idai caused extensive flooding in Mozambique, Malawi
the risk to coastal communities of damage from storm and Zimbabwe, damaging more than 100,000 homes
surges, which may, in turn, be exacerbated by future sea and killing more than 1,200 people – although millions
level rise (Walsh et al., 2016). of people are thought to have been affected (Blunden
& Arndt, 2020). The human health consequences were
As a consequence of fewer tropical cyclones, however, serious: cases of diarrhoeal disease were reported at the
the Limpopo River Basin and southern, central and end of March, and at the beginning of April in excess of
northern Mozambique are expected to receive less 1,400 suspected cholera cases were reported (Chen &
rainfall (Muthige et al., 2018). Azman, 2019). The estimated cost of damage to local
infrastructure was approximately US$2.2 billion (Blunden
The total number of tropical cyclones forming annually & Arndt, 2020). The following month, in April 2019,
in the southern Indian Ocean is projected to decrease Cyclone Kenneth landed on Cabo Delgado province
by 26% in the late twenty-first century in comparison to in northern Mozambique, killing at least 45 people, left
the present day (1982–2005), but the number of intense around 40,000 homeless and led to a cholera epidemic
category 4 and 5 storms is projected to increase by 64% because the entire sewerage system was destroyed
according to a computer modelling study. The study (Cambaza et al., 2019).
used the results of a multimodel ensemble of CMIP5
models for the RCP4.5 scenario to force a high resolution
atmosphere model and subsequently a hurricane model
to estimate changes in hurricane activity (Knutson et al.,
2015), though the study did not project how many tropical
storms would make landfall. For comparison, the global
number of category 4 and 5 tropical cyclones forming
annually in the late twenty-first century is projected to
increase by 28% from the present-day baseline. The
same study projected an average increase of 8.5% in
rain rate, or the quantity of rainfall, by the late twenty-first
century for all tropical cyclones forming over the southern
Indian Ocean in comparison to the present day baseline
(compared to a global projected increase of 14%). The
authors suggest that their findings are in agreement with
other studies (Knutson et al., 2015).
Weathering the Storm Extreme weather events and climate change in Africa | GRL-TR(R)-04-2020 | 19You can also read