Search for dark matter produced in association with a leptonically decaying Z boson in proton-proton collisions at
←
→
Page content transcription
If your browser does not render page correctly, please read the page content below
Eur. Phys. J. C       (2021) 81:13
https://doi.org/10.1140/epjc/s10052-020-08739-5

 Regular Article - Experimental Physics

Search for dark matter produced in association with
                                               √ a leptonically
decaying Z boson in proton–proton collisions at s = 13 TeV
CMS Collaboration∗
CERN, 1211 Geneva 23, Switzerland

Received: 11 August 2020 / Accepted: 7 December 2020
© CERN for the benefit of the CMS collaboration 2021

Abstract A search for dark matter particles is performed              The search presented here considers a “mono-Z” sce-
using events with a Z boson candidate and large missing           nario where a Z boson, produced in proton–proton (pp) colli-
transverse momentum. The analysis is based on proton–             sions, recoils against DM or other beyond the standard model
proton collision data at a center-of-mass energy of 13 TeV,       (BSM) invisible particles. The Z boson subsequently decays
collected by the CMS experiment at the LHC in 2016–2018,          into two charged leptons (+ − , where  = e or μ) yield-
corresponding to an integrated luminosity of 137 fb−1 . The       ing a dilepton signature, and the accompanying undetected
search uses the decay channels Z → ee and Z → μμ. No              particles contribute to missing transverse momentum. The
significant excess of events is observed over the background      analysis is based on a data set of pp collisions at a center-of-
expected from the standard model. Limits are set on dark          mass energy of 13 TeV produced at the CERN LHC. The data
matter particle production in the context of simplified models    were recorded with the CMS detector in the years 2016–2018,
with vector, axial-vector, scalar, and pseudoscalar mediators,    and correspond to an integrated luminosity of 137 fb−1 . The
as well as on a two-Higgs-doublet model with an additional        results are interpreted in the context of several models for
pseudoscalar mediator. In addition, limits are provided for       DM production, as well as for two other scenarios of BSM
spin-dependent and spin-independent scattering cross sec-         physics that also predict invisible particles.
tions and are compared to those from direct-detection exper-          These results extend and supersede a previous search by
iments. The results are also interpreted in the context of mod-   CMS in the mono-Z channel based on a data set collected
                                                                     √
els of invisible Higgs boson decays, unparticles, and large       at s = 13 TeV corresponding to an integrated luminos-
extra dimensions.                                                 ity of 36 fb−1 [4]. The ATLAS experiment has published
                                                                  searches in this channel as well with the latest result based
                                                                  on a data set corresponding to an integrated luminosity of
1 Introduction                                                    36 fb−1 [5]. Similar searches for DM use other “mono-
                                                                  X” signatures with missing transverse momentum recoil-
The existence of dark matter (DM) is well established from        ing against a hadronic jet [6,7], a photon [8], a heavy-flavor
astrophysical observations [1], where the evidence relies         (bottom or top) quark [9–11], a W or Z boson decaying to
entirely on gravitational interactions. According to fits based   hadrons [5,7,12], or a Higgs boson [13–18]. An additional
on the Lambda cold dark matter model of cosmology [2]             DM interpretation is explored in searches for Higgs boson
to observational data, DM comprises 26.4% of the current          decays to invisible particles [19,20].
matter-energy density of the universe, while baryonic mat-            The paper is organized as follows. The DM and other
ter accounts for only 4.8% [3]. In spite of the abundance of      BSM models explored are introduced along with their rele-
DM, its nature remains unknown. This mystery is the sub-          vant parameters in Sect. 2. Section 3 gives a brief description
ject of an active experimental program to search for dark         of the CMS detector. The data and simulated samples are
matter particles, including direct-detection experiments that     described in Sect. 4, along with the event reconstruction.
search for interactions of ambient DM with ordinary matter,       The event selection procedures and background estimation
indirect-detection experiments that search for the products       methods are described in Sects. 5 and 6, respectively. Sec-
of self-annihilation of DM in outer space, and searches at        tion 7 details the fitting method implemented for the differ-
accelerators and colliders that attempt to create DM in the       ent models presented, while Sect. 8 discusses the systematic
laboratory.                                                       uncertainties. The results are given in Sect. 9, and the paper
                                                                  is summarized in Sect. 10.
 e-mail:   cms-publication-committee-chair@cern.ch

                                         0123456789().: V,-vol                                                         123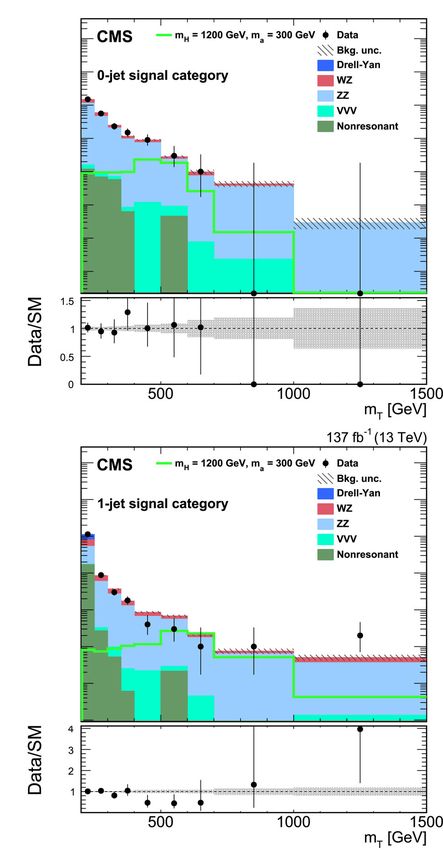
13    Page 2 of 33                                                                     Eur. Phys. J. C     (2021) 81:13

2 Signal models                                                    that contains a Higgs scalar (h), which we take to be the
                                                                   observed 125 GeV Higgs boson, a heavy neutral Higgs scalar
Several models of BSM physics can lead to a signature of a Z       (H), a charged Higgs scalar (H±), and two pseudoscalars (A,
boson subsequently decaying into a lepton pair and missing         a), where the pseudoscalar bosons couple to the DM parti-
transverse momentum. The goal of this paper is to explore          cles. For the process studied in this paper, the H boson is
a set of benchmark models for the production of DM that            produced via gluon fusion and decays into a standard model
can contribute to this final state. In all DM models we con-       (SM) Z boson and the pseudoscalar a. These subsequently
sider, the DM particles are produced in pairs, χχ̄, where χ is     decay into a pair of leptons and a pair of DM particles, respec-
assumed to be a Dirac fermion.                                     tively, as shown in Fig. 1 (upper right). The sizable couplings
   First, we consider a set of simplified models for DM pro-       of the Z boson to the Higgs bosons makes the mono-Z chan-
duction [21,22]. These models describe the phenomenology           nel more sensitive to this model than the mono-jet or mono-
of DM production at the LHC with a small number of param-          photon channels. Among the parameters of this model are the
eters and provide a standard for comparing and combining           Higgs boson masses, the ratio tan β of the vacuum expecta-
results from different search channels. Each model contains        tion values of the two Higgs doublets, and the mixing angle
a massive mediator exchanged in the s-channel, where the           θ of the pseudoscalars. We consider only configurations in
mediator (either a vector, axial-vector, scalar, or pseudoscalar   which m H = m H± = m A , and fix the values tan β = 1 and
particle) couples directly to quarks and to the DM particle        sin θ = 0.35, following the recommendations of Ref. [24].
χ. An example tree-level diagram is shown in Fig. 1 (upper            We also examine the case where the h boson acts as a
left). The free parameters of each model are the mass of           mediator for DM production, as discussed in “Higgs portal”
the DM particle m χ , the mass of the mediator m med , the         models [25–28]. If m χ < m h /2, the Higgs boson could decay
mediator-quark coupling gq , and the mediator-DM coupling          invisibly into a pair of DM particles. The mechanism for such
gχ . Following the suggestions in Ref. [22], for the vector        decays can be found, for example, in many supersymmetric
and axial-vector studies, we fix the couplings to values of        theoretical models that contain a stable neutral lightest super-
gq = 0.25 and gχ = 1 and vary the values of m χ and m med ,        symmetric particle, e.g., a neutralino [29], that is sufficiently
and for the scalar and pseudoscalar studies, we fix the cou-       light. An illustrative Feynman diagram for such a case is
plings gq = 1 and gχ = 1, set the dark matter particle mass        shown in Fig. 1 (lower left), while additional gluon-induced
to m χ = 1 GeV, and vary the values of m med . The compar-         diagrams are also considered.
ison with data is carried out separately for each of the four         In addition to the DM paradigm, we consider a model
spin-parity choices for the mediator.                              where unparticles are responsible for the missing transverse
   We also explore a two-Higgs-doublet model (2HDM) with           momentum in the final state. The unparticle physics con-
an additional pseudoscalar boson, a, that serves as the medi-      cept [30,31] is based on scale invariance, which is anticipated
ator between DM and ordinary matter. This “2HDM+ a”                in many BSM physics scenarios [32–34]. The effects of the
model [23,24] is a gauge-invariant and renormalizable model        scale-invariant sector (“unparticles”) appear as a non-integral

Fig. 1 Feynman diagrams
illustrative of the BSM
processes that produce a final
state of a Z boson that decays
into a pair of leptons and
missing transverse momentum:
(upper left) simplified dark
matter model for a spin-1
mediator, (upper
right) 2HDM+ a model, (lower
left) invisible Higgs boson
decays, and (lower
right) graviton (G) production in
a model with large extra
dimensions or unparticle (U)
production. Here A represents
the DM mediator, χ represents a
DM particle, while (H, h) and a
represent the scalar and
pseudoscalar Higgs bosons,
respectively. Here h is identified
with the 125 GeV scalar boson.
The dotted line represents either
an unparticle or a graviton

123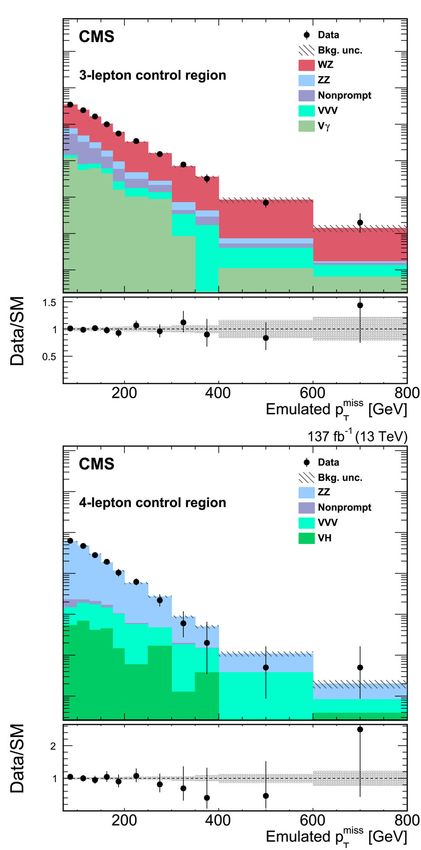
Eur. Phys. J. C    (2021) 81:13                                                                    Page 3 of 33   13

number of invisible massless particles. In this scenario, the    muon detectors to select events at a rate of around 100 kHz
SM is extended by introducing a scale-invariant Banks–Zaks       within a time interval of less than 4 μs. The second level,
field, which has a nontrivial infrared fixed point [35]. This    known as the high-level trigger (HLT), consists of a farm of
field can interact with the SM particles by exchanging heavy     processors running a version of the full event reconstruction
particles with a high mass scale MU [36]. Below this mass        software optimized for fast processing, and reduces the event
scale, where the coupling is nonrenormalizable, the inter-       rate to around 1 kHz before data storage.
action is suppressed by powers of MU and can be treated             A more detailed description of the CMS detector, together
within an effective field theory (EFT). The parameters that      with a definition of the coordinate system used and the rele-
characterize the unparticle model are the possible noninteger    vant kinematic variables, can be found in Ref. [40].
scaling dimension of the unparticle operator dU , the coupling
of the unparticles to SM fields λ, and the cutoff scale of the
EFT ΛU . In order to remain in the EFT regime, the cutoff        4 Data samples and event reconstruction
scale is set to ΛU = 15 TeV and to maintain unitarity, only
dU > 1 is considered. Figure 1 (lower right) shows the tree-     This search uses pp collision events collected with the CMS
level diagram considered in this paper for the production of     detector during 2016, 2017, and 2018 corresponding to a total
unparticles associated with a Z boson.                           integrated luminosity of 137 fb−1 . The data sets from the
    The final SM extension considered in this paper is the       three different years are analyzed independently with appro-
Arkani-Hamed–Dimopoulos–Dvali (ADD) model of large               priate calibrations and corrections to take into account the
extra dimensions [37,38], which is motivated by the dispar-      different LHC running conditions and CMS detector perfor-
ity between the electroweak (EW) unification scale (MEW ∼        mance.
100 GeV) and the Planck scale (MPl ∼ 1019 GeV). This                  Several SM processes can contribute to the mono-Z sig-
model predicts graviton (G) production via the process qq̄ →     nature. The most important backgrounds come from diboson
Z + G, as shown in Fig. 1 (lower right). The graviton escapes    processes: WZ → ν where one lepton escapes detection,
detection, leading to a mono-Z signature. In the ADD model,      ZZ → νν, and WW → νν. There can also be contribu-
the apparent Planck scale in four spacetime dimensions is        tions where energetic leptons are produced by decays of top
given by MPl  2 ≈ M n+2 R n , where M is the fundamental
                      D                 D                        quarks in t t̄ or tW events. Smaller contributions may come
Planck scale in the full (n+4)-dimensional spacetime and R       from triple vector boson processes (WWZ, WZZ, and ZZZ),
is the compactification length scale of the extra dimensions.    t t̄W → WWbb̄W, tt̄Z → WWbb̄Z, and tt̄γ → WWbb̄γ,
Assuming MD is of the same order as MEW , the observed           referred to collectively as VVV due to the similar decay prod-
large value of MPl suggests values of R much larger than         ucts. Drell–Yan (DY) production of lepton pairs, Z/γ∗ → ,
the Planck length. These values are on the order of nm for       has no intrinsic source of missing transverse momentum but
n = 3, decreasing with larger values of n. The consequence       can still mimic a mono-Z signature when the momentum of
of the large compactification scale is that the mass spectrum    the recoiling system is poorly measured. A minor source of
of the Kaluza–Klein graviton states becomes nearly continu-      background is from events with a vector boson and a misre-
ous [37,38], resulting in a broadened spectrum for the trans-    constructed photon, referred to as Vγ.
verse momentum ( pT ) of the Z boson.                                 Monte Carlo simulated events are used to model the
                                                                 expected signal and background yields. Three sets of sim-
                                                                 ulated events for each process are used in order to match
3 The CMS detector                                               the different data taking conditions. The samples for DM
                                                                 production are generated using the dmsimp package [41,42]
The central feature of the CMS apparatus is a supercon-          interfaced with MadGraph5_amc@nlo 2.4.2 [43–46]. The
ducting solenoid of 6 m internal diameter, providing a mag-      pseudoscalar and scalar model samples are generated at lead-
netic field of 3.8 T. Within the solenoid volume are a silicon   ing order (LO) in quantum chromodynamics (QCD), while
pixel and strip tracker, a lead tungstate crystal electromag-    the vector and axial-vector model samples are generated at
netic calorimeter (ECAL), and a brass and scintillator hadron    next-to-leading-order (NLO) in QCD. The powhegv2 [47–
calorimeter (HCAL), each composed of a barrel and two end-       51] generator is used to simulate the Zh signal process of
cap sections. Forward calorimeters extend the pseudorapid-       the invisible Higgs boson at NLO in QCD, as well as the
ity (η) coverage provided by the barrel and endcap detectors.    tt̄, tW, and diboson processes. The BSM Higgs boson pro-
Muons are detected in gas-ionization chambers embedded in        duction cross sections, as a function of the Higgs boson
the steel flux-return yoke outside the solenoid.                 mass for the Zh process are taken from Ref. [52]. Sam-
   Events of interest are selected using a two-tiered trigger    ples for the 2HDM+ a model are generated at NLO with
system [39]. The first level (L1), composed of custom hard-      MadGraph5_amc@nlo 2.6.0. Events for both the ADD
ware processors, uses information from the calorimeters and      and unparticle models are generated at LO using an EFT

                                                                                                                       123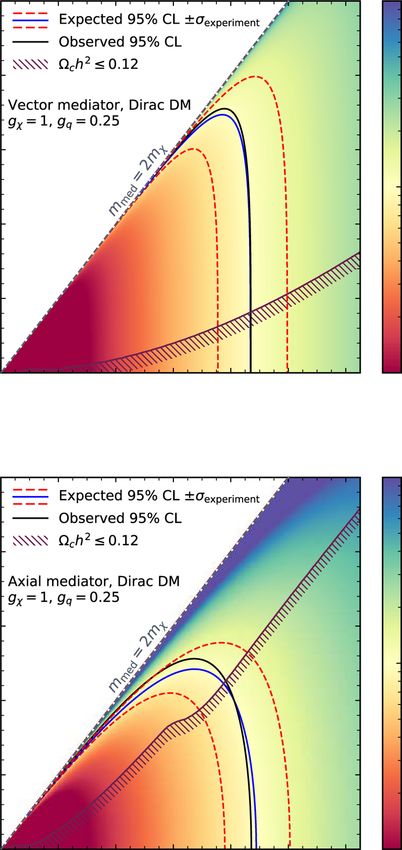
13   Page 4 of 33                                                                         Eur. Phys. J. C     (2021) 81:13

implementation in pythia 8.205 in 2016 and 8.230 in 2017              the response function of the calorimeters to hadronic show-
and 2018 [53,54]. In order to ensure the validity of the effec-       ers. Finally, the energies of neutral hadrons are obtained from
tive theory used in the ADD model, a truncation method,               the corresponding corrected ECAL and HCAL energies.
described in Ref. [55], is applied. Perturbative calculations            The candidate vertex with the largest value of summed
are only valid in cases where the square of the center-of-mass        physics-object pT2 is taken to be the primary pp interaction
energy (ŝ) of the incoming partons is smaller than the fun-          vertex. The physics objects are the jets, clustered using the jet
damental scale of the theory (MD2 ). As such, this truncation         finding algorithm [62,63] with the tracks assigned to candi-
method suppresses the cross section for events with ŝ > MD2          date vertices as inputs, and the associated missing transverse
by a factor of MD4 /ŝ 2 . The effect of this truncation is largest   momentum, taken as the negative vector sum of the pT of
for small values of MD , but also increases with the number           those jets.
of dimensions n as more energy is lost in extra dimensions.              Both electron and muon candidates must pass certain
The MadGraph5_amc@nlo 2.2.2 (2.4.2) generator in 2016                 identification criteria to be further selected in the analysis.
(2017 and 2018) is used for the simulation of the VVV, Vγ,            They must satisfy requirements on the transverse momen-
and DY samples, at NLO accuracy in QCD.                               tum and pseudorapidity: pT > 10 GeV and |η| < 2.5 (2.4)
    The set of parton distribution functions (PDFs) used for          for electrons (muons). At the final level, a medium working
simulating the 2016 sample is NNPDF 3.0 NLO [56] and                  point [64,65] is chosen for the identification criteria, includ-
for the 2017 and 2018 samples it is NNPDF 3.1 NNLO. For               ing requirements on the impact parameter of the candidates
all processes, the parton showering and hadronization are             with respect to the primary vertex and their isolation with
simulated using pythia 8.226 in 2016 and 8.230 in 2017                respect to other particles in the event. The efficiencies for
and 2018. The modeling of the underlying event is gener-              these selections are about 85 and 90% for each electron and
ated using the CUETP8M1 [57] (CP5 [58]) for simulated                 muon, respectively.
samples corresponding to the 2016 (2017 and 2018) data                   In the signal models considered in this paper, the amount
sets. The only exceptions to this are the 2016 top quark sam-         of hadronic activity tends to be small, so events with mul-
ple, which uses CUETP8M2 [57] and the simplified DM                   tiple clustered jets are vetoed. For each event, hadronic jets
(2HDM+ a) samples, which uses CP3 [58] (CP5) tunes for                are clustered from reconstructed particle candidates using the
all years. All events are processed through a simulation of the       infrared and collinear safe anti-kT algorithm [62,63] with a
CMS detector based on Geant4 [59] and are reconstructed               distance parameter of 0.4. Jet momentum is determined as
with the same algorithms as used for data. Simultaneous pp            the vectorial sum of all particle momenta in the jet, and is
collisions in the same or nearby bunch crossings, referred to         found from simulation to be, on average, within 5 to 10%
as pileup, are also simulated. The distribution of the number         of the true momentum over the entire spectrum and detec-
of such interactions in the simulation is chosen to match the         tor acceptance. Pileup interactions can contribute additional
data, with periodic adjustments to take account of changes            tracks and calorimetric energy depositions to the jet momen-
in LHC operating conditions [60]. The average number of               tum. To mitigate this effect, charged particles identified to
pileup interactions was 23 for the 2016 data and 32 for the           be originating from pileup vertices are discarded and an off-
2017 and 2018 data.                                                   set is applied to correct for remaining contributions [66].
    Information from all subdetectors is combined and used            Jet energy corrections are derived from simulation to bring
by the CMS particle-flow (PF) algorithm [61] for particle             the measured response of jets to the average of simulated
reconstruction and identification. The PF algorithm aims to           jets clustered from the generated final-state particles. In situ
reconstruct and identify each individual particle in an event,        measurements of the momentum balance in dijet, photon+jet,
with an optimized combination of information from the var-            Z+jet, and multijet events are used to determine corrections
ious elements of the CMS detector. The energies of photons            for residual differences between jet energy scale in data and
are obtained from the ECAL measurement. The energies of               simulation [66]. The jet energy resolution amounts typically
electrons are determined from a combination of the electron           to 15% at 10 GeV, 8% at 100 GeV, and 4% at 1 TeV. Addi-
momentum at the primary interaction vertex as determined              tional selection criteria are applied to each jet to remove
by the tracker, the energy from the corresponding ECAL                jets potentially dominated by anomalous contributions from
cluster, and the energy sum from all bremsstrahlung pho-              some subdetector components or reconstruction failures [67].
tons spatially compatible with originating from the electron          Jets with pT > 30 GeV and |η| < 4.7 are considered for the
track. The momentum of muons is obtained from the cur-                analysis.
vature of the corresponding track in the tracker detector in             To identify jets that originated from b quarks, we use the
combination with information from the muon stations. The              medium working point of the DeepCSV algorithm [68]. This
energies of charged hadrons are determined from a combi-              selection was chosen to remove events from top quark decays
nation of their momentum measured in the tracker and the              originating specifically from tt̄ production, without causing
matching ECAL and HCAL energy deposits, corrected for                 a significant loss of signal. For this working point, the effi-

123
Eur. Phys. J. C (2021) 81:13 Page 5 of 33 13
ciency to select b quark jets is about 70% and the probability we remove events containing additional electrons or muons
for mistagging jets originating from the hadronization of glu- with loose identification and with pT > 10 GeV. Events con-
ons or u/d/s quarks is about 1% in simulated t t̄ events. taining a loosely identified τh candidate with pT > 18 GeV
To identify hadronically decaying τ leptons (τh ), we use and |η| < 2.3 are also rejected. Decays that are consistent
the hadron-plus-strips algorithm [69]. This algorithm con- with production of muons or electrons are rejected by an
structs candidates seeded by PF jets that are consistent with overlap veto.
either a single or triple charged pion decay of the τ lepton. In addition to the above criteria, there are several selec-
In the single charged pion decay mode, the presence of neu- tions designed to further reduce the SM background. The
tral pions is detected by reconstructing their photonic decays. main discriminating variables are: the missing transverse
Mistagged jets originating from non-τ decays are rejected by momentum, pTmiss ; the azimuthal angle formed between the
a discriminator that takes into account the pileup contribution dilepton pT and the pTmiss , Δφ( pT , pTmiss ); and the bal-
to the neutral component of the τh decay [69]. The efficiency ance ratio, | pTmiss − pT |/ pT . The latter two variables are
to select real hadronically decaying τ leptons is about 75% especially powerful in rejecting DY and top quark pro-
and the probability for mistagging jets is about 1%. cesses. Selection criteria are optimized to obtain the best
The missing transverse momentum vector pTmiss is com- signal sensitivity for the range of DM processes consid-
puted as the negative vector sum of the transverse momenta ered. The final selection requirements are: pTmiss > 100 GeV,
of all the PF candidates in an event, and its magnitude is Δφ( pT , pTmiss ) > 2.6 radians, and | pTmiss − pT |/ pT < 0.4.
denoted as pTmiss [70]. The pTmiss is modified to account for For the 2HDM+ a model, the selection differs slightly.
corrections to the energy scale of the reconstructed jets in the We make a less stringent requirement on the missing trans-
event. Events with anomalously high pTmiss can originate from verse momentum, pTmiss > 80 GeV, and require the trans-
√
a variety of reconstruction failures, detector malfunctions, or verse mass, m T = 2 p T p miss [1 − cos Δφ( p
T T , pTmiss )] to
noncollision backgrounds. Such events are rejected by event be greater than 200 GeV. The kinematic properties of the
filters that are designed to identify more than 85–90% of the 2HDM+ a production yield a peak in the m T spectrum near
spurious high- pTmiss events with a misidentification rate of the neutral Higgs scalar (H) mass that is advantageous for
less than 0.1% [70]. background discrimination.
In order to avoid biases in the pTmiss calculation due to jet
mismeasurement, events with one jet are required to have
5 Event selection the azimuthal angle between this jet and the missing trans-
j
verse momentum, Δφ( pT , pTmiss ), larger than 0.5 radians.
Events with electrons (muons) are collected using dielectron To reduce the contribution from backgrounds such as WW
(dimuon) triggers, with thresholds of pT > 23 (17) GeV and and tt̄, we apply a requirement on the distance between
pT > 12 (8) GeV for the electron (muon) with the highest and the two leptons in the (η, φ) plane, ΔR < 1.8, where
√
second-highest measured pT , respectively. Single-electron ΔR = (Δφ )2 + (Δη )2 .
and single-muon triggers with pT thresholds of 25 (27) and 20 A summary of the selection criteria for the SR is given in
(24) GeV for 2016 (2017–2018) are used to recover residual Table 1.
inefficiencies, ensuring a trigger efficiency above 99% for
events passing the offline selection.
In the signal region (SR), events are required to have
two (N = 2) well-identified, isolated electrons or muons 6 Background estimation
with the same flavor and opposite charge (e+e− or μ+μ−).
At least one electron or muon of the pair must have pT > We estimate the background contributions using combined
25 GeV, while the second must have pT > 20 GeV. In order information from simulation and control regions (CRs) in
to reduce nonresonant background, the dilepton invariant data. A simultaneous maximum likelihood fit to the pTmiss
mass is required to be within 15 GeV of the world-average or m T distributions in the SR and CRs constrains the
Z boson mass m Z [71]. Additionally, we require the pT of background normalizations and their uncertainties. Specific
the dilepton system pT to be larger than 60 GeV to reject the CRs target different categories of background processes, as
bulk of the DY background. Since little hadronic activity is described below.
expected for the signal, we reject events having more than
one jet with pT > 30 GeV within |η| < 4.7. The top quark 6.1 The three-lepton control region
background is further suppressed by rejecting events con-
taining any b-tagged jet with pT > 30 GeV reconstructed The WZ → ν decay mode can contribute to the SR when
within the tracker acceptance of |η| < 2.4. To reduce the the third lepton ( = e or μ) escapes detection, and this
WZ background in which both bosons decay leptonically, same process can be monitored in an orthogonal CR, where
12313 Page 6 of 33 Eur. Phys. J. C (2021) 81:13
Table 1 Summary of the kinematic selections for the signal region
Quantity Requirement Target backgrounds
N = 2 with additional lepton veto WZ, VVV
pT > 25/20 GeV for leading/subleading Multijet
Dilepton mass |m − m Z | < 15 GeV WW, top quark
j
Number of jets ≤1 jet with pT > 30 GeV DY, top quark, VVV
pT > 60 GeV DY
b tagging veto 0 b-tagged jet with pT > 30 GeV Top quark, VVV
τ lepton veto 0 τh cand. with pTτ > 18 GeV WZ
j
Δφ( pT , pTmiss ) > 0.5 radians DY, WZ
Δφ( pT , pTmiss ) > 2.6 radians DY
| pTmiss − pT |/ pT < 0.4 DY
ΔR < 1.8 WW, top quark
pTmiss (all but 2HDM+ a) > 100 GeV DY, WW, top quark
pTmiss (2HDM+ a only) > 80 GeV DY, WW, top quark
m T (2HDM+ a only) > 200 GeV DY, WW, ZZ, top quark
the third lepton is identified and then removed. The construc- monitored via the decay mode ZZ → 4. The 4 CR is based
tion of the three-lepton (3) CR is based on events with three on events with two pairs of charged leptons. Each pair com-
well-reconstructed charged leptons. A Z boson candidate is prises two leptons of opposite charge and the same flavor
selected in the same manner as for the SR , while an addi- and corresponds to a Z candidate. Two of the four leptons
tional electron or muon with identical quality and isolation must fulfill the same requirements on the leptons as in the
is required. In cases where there are multiple Z boson candi- SR, while, in order to increase the yield, the other two lep-
dates, the candidate with invariant mass closest to the Z boson tons need only pass relaxed lepton quality requirements. The
mass is selected. To enhance the purity of the WZ selection, highest pT Z boson candidate is required to have an invariant
pTmiss of at least 30 GeV is required and the invariant mass mass within 35 GeV of the Z boson mass m Z [71]. Addition-
of three leptons is required to be larger than 100 GeV. The ally, we require the transverse momentum of this Z boson
backgrounds in this CR are similar to those in the SR, with a candidate to be larger than 60 GeV. Additional backgrounds
sizable nonprompt background from DY events where a jet is to the ZZ final state are events from triboson processes, events
misidentified as a lepton [72]. An additional minor source of with a vector boson and a higgs boson (Vh) and from non-
background is from events with a vector boson and a misre- prompt events. These backgrounds are almost negligible. All
constructed photon (Vγ). All background estimates for this background estimates for this CR are taken from simulation.
CR are taken from simulation. For these four-lepton events, the emulated pTmiss is cal-
To simulate the consequences of not detecting the third culated as the vectorial sum of the pTmiss and the pT of the
lepton, the “emulated pTmiss ” is estimated from the vecto- Z boson candidate with the larger absolute mass difference
rial sum of pTmiss and the transverse momentum ( pT ) of the to m Z . The choice of which Z boson to use as a proxy for
additional lepton. The emulated pTmiss is then used in place an invisibly decaying boson negligibly alters the emulated
of the reconstructed pTmiss and the same selection is applied pTmiss spectrum. The same selection as the SR is then applied
as for the SR. Since there is negligible contamination from using the emulated pTmiss in place of the reconstructed pTmiss ,
WZ → τν and top quark backgrounds in this CR, no veto with the exception of the τh and b jet candidate vetoes. The
is applied on additional τh or b jet candidates. The result- resulting emulated pTmiss spectrum is shown in Fig. 2 (lower).
ing emulated pTmiss spectrum is shown in Fig. 2 (upper). For Similarly to the 3 CR, the “emulated m T ” is used instead of
the 2HDM+ a case, the “emulated m T ” is used instead of “emulated pTmiss ” for the 2HDM+ a case and the distribution
“emulated pTmiss ” with the same selections. is well described by the SM background estimations.
6.2 The four-lepton control region 6.3 The electron-muon control region
The ZZ process contributes to the SR through the ZZ → We estimate the contribution of the flavor-symmetric back-
νν decay mode, and the same production process can be grounds from an eμ CR based on events with two leptons of
123Eur. Phys. J. C (2021) 81:13 Page 7 of 33 13
6.4 The DY control region
The DY background is dominant in the region of low pTmiss .
This process does not produce undetectable particles. There-
fore, any nonzero pTmiss arises from mismeasurement or lim-
itations in the detector acceptance. The estimation of this
background uses simulated DY events, for which the nor-
malization is taken from data in a sideband CR of 80 <
pTmiss < 100 GeV where the signal contamination is neg-
ligible, with all other selections applied. For the 2HDM+ a
analysis, a similar approach is taken with relaxed pTmiss selec-
tion of 50 < pTmiss < 100 GeV and an additional selection of
m T < 200 GeV applied. The sideband CR is included in the
maximum likelihood fit and a 100% uncertainty is assigned
to the extrapolation from this CR to the SR. This uncertainty
has little effect on the results because of the smallness of the
overall contribution from the DY process in the SR.
7 Fitting method
After applying the selection, we perform a binned maximum
likelihood fit to discriminate between the potential signal and
the remaining background processes. The data sets for each
data-taking year are kept separate in the fit. This yields a bet-
ter expected significance than combining them into a single
set because the signal-to-background ratios are different for
the three years due to the different data-taking conditions.
The electron and muon channels have comparable signal-
to-background ratios, and are combined in the fit, while the
contributions, corrections and systematic uncertainties are
calculated individually.
The pTmiss distribution of events passing the selection is
used as the discriminating variable in the fit for all of the
signal hypotheses except for the 2HDM+ a model. For this
model, the m T distribution is used since a Jacobian peak
around the pseudoscalar Higgs boson mass is expected.
Events in the SR are split into 0-jet and 1-jet categories to
Fig. 2 Emulated pTmiss distribution in data and simulation for the 3
(upper) and 4 (lower) CRs. Uncertainty bands correspond to the post- take into account the different signal-to-background ratios.
fit combined statistical and systematic components, where the fitting In addition, for the CRs defined in Sect. 6, events with 0-jet
method is described in Sect. 7 and 1-jet are included as a single category in the fit. The eμ
and DY CRs are each included as a single bin correspond-
ing to the total yield. The pTmiss or m T spectra in the 3 and
4 CRs are included in the fit with the same binning as in
different flavor and opposite charge (e± μ∓ ) that pass all other the SR, where these spectra are based upon the emulated
analysis selections. This CR is largely populated by nonres- pTmiss . To allow for further freedom in the ZZ and WZ back-
onant backgrounds (NRB) consisting mainly of leptonic W ground estimation, the pTmiss and emulated pTmiss distributions
boson decays in tt̄, tW, and WW events, where the dilep- are split into three regions with independent normalization
ton mass happens to fall inside the Z boson mass window. parameters: low (< 200 GeV), medium (200–400 GeV), and
Small contributions from single top quark events produced high (> 400 GeV), with uncertainties of 10, 20, and 30%,
via s- and t-channel processes, and Z → ττ events in which respectively. These values are based on the magnitudes of
τ leptons decay into light leptons and neutrinos, are also con- the theoretical uncertainties as described in Sect. 8. For fits
sidered in the NRB estimation. to the 2HDM+ a model, three similar m T regions are cho-
12313 Page 8 of 33 Eur. Phys. J. C (2021) 81:13
sen with the same uncertainties: low (< 400 GeV), medium uncertainties and Gaussian functions used for shape-based
(400–800 GeV), and high (> 800 GeV). To make the best uncertainties. The index i indicates the bin of the pTmiss or
use of the statistical power in the CRs and to take advantage m T distribution, r (i) corresponds to the region (low, medium,
of the similarities of the production processes, we take the high) of bin i, and the index j indicates either the 0-jet or 1-jet
normalization factors to be correlated for the ZZ and the WZ selection. The diboson process normalization in the region
backgrounds in each pTmiss region. r (i) is μVV,r (i) , while μDY is the DY background normaliza-
For each individual bin, a Poisson likelihood term descri- tion and μNRB is the normalization for the nonresonant back-
bes the fluctuation of the data around the expected central ground. The yield prediction from simulation for process x
y
value, which is given by the sum of the contributions from in region y is noted as N x . The smaller backgrounds in each
signal and background processes. Systematic uncertainties region are merged together and are indicated collectively as
are represented by nuisance parameters θ with log-normal “other”. The method above for constructing likelihood func-
probability density functions used for normalization uncer- tions follows that of Ref. [73], where a more detailed math-
tainties and Gaussian functions used for shape-based uncer- ematical description may be found.
tainties, with the functions centered on their nominal values
θ̂ . The uncertainties affect the overall normalizations of the
signal and background templates, as well as the shapes of the 8 Systematic uncertainties
predictions across the distributions of observables. Correla-
tions among systematic uncertainties in different categories In the following, we describe all of the uncertainties that
are taken into account as discussed in Sect. 8. The total like- are taken into account in the maximum likelihood fit. We
lihood is defined as the product of the likelihoods of the consider the systematic effects on both the overall normal-
individual bins and the probability density functions for the ization and on the shape of the distribution of pTmiss or m T
nuisance parameters: for all applicable uncertainties. We evaluate the impacts by
performing the full analysis with the value of the relevant
L = LSR L3 L4 Leμ LDY f NP θ | θ̂ (1) parameters shifted up and down by one standard deviation.
The final varied distributions of pTmiss or m T are used for
The factors of the likelihood can be written more explicitly
signal extraction and as input to the fit. For each source of
as
uncertainty, variations in the distributions are thus treated as
fully correlated, while independent sources of uncertainty are
LSR = P Nobs,i,
SR
j | μDY NDY,i, j (θ )
SR
treated as uncorrelated. Except where noted otherwise, the
i, j
systematic uncertainties for the three different years of data
+ μNRB NNRB,i,
SR
j (θ ) + Nother,i, j (θ )
SR
taking are treated as correlated.
+ μVV,r (i) (NZZ,i,
2
j (θ ) + NWZ,i, j (θ ))
SR The assigned uncertainties in the integrated luminosity
are 2.5, 2.3, and 2.5% for the 2016, 2017, and 2018 data
+ μNSig,i,
SR
j (θ ) , (2) samples [74–76], respectively, and are treated as uncorrelated
across the different years.
L3 = P Nobs,i
3
| Nother,i
3
(θ ) + μVV,r (i) NWZ,i
3
(θ ) ,
We apply scale factors to all simulated samples to cor-
i
(3) rect for discrepancies in the lepton reconstruction and iden-
tification efficiencies between data and simulation. These
L4 = P Nobs,i
4
| Nother,i
4
(θ ) + μVV,r (i) NZZ,i
4
(θ ) , factors are measured using DY events in the Z boson peak
i region [65,77,78] that are recorded with unbiased triggers.
(4) The factors depend on the lepton pT and η and are within
eμ eμ eμ a few percent of unity for electrons and muons. The uncer-
Leμ = P Nobs | μNRB NNRB (θ ) + Nother (θ ) , (5)
tainty in the determination of the trigger efficiency leads to
LDY = P Nobs
DY
| μDY NDY
DY
(θ ) + μNRB NNRB
DY
(θ ) an uncertainty smaller than 1% in the expected signal yield.
For the kinematic regions used in this analysis, the lepton
+ Nother
DY
(θ ) + NZZ
DY
(θ ) + NWZ
DY
(θ ) + μNSig
DY
(θ ) . momentum scale uncertainty for both electrons and muons
(6) is well represented by a constant value of 0.5%. The uncer-
tainty in the calibration of the jet energy scale (JES) and
The purpose of the fit is to determine the confidence inter- resolution directly affects the pTmiss computation and all the
val for the signal strengths μ. Here P(N | λ) is the Poisson selection requirements related to jets. The estimate of the
probability to observe N events for an expected value of λ, JES uncertainty is performed by varying the JES. The varia-
and f NP (θ | θ̂ ) describes the nuisance parameters with log- tion corresponds to a re-scaling of the jet four-momentum as
normal probability density functions used for normalization p → p(1 ± δpTJES / pT ), where δpTJES is the absolute uncer-
123Eur. Phys. J. C (2021) 81:13 Page 9 of 33 13
tainty in the JES, which is parameterized as function of the Table 2 Summary of the uncertainties in the branching fraction arising
pT and η of the jet. In order to account for the systematic from the systematic uncertainties considered in the Zh(invisible) model
assuming B(h → invisible) = 1 (signal) and B(h → invisible) = 0 (no
uncertainty from the jet resolution smearing procedure, the signal). Here, lepton measurement refers to the combined trigger, lepton
resolution scale factors are varied within their uncertainties. reconstruction and identification efficiencies, and the lepton momentum
Since the uncertainties in the JES are derived independently and electron energy scale systematic uncertainty. Theory uncertainties
for the three data sets, they are treated as uncorrelated across include variations of the renormalization and factorization scales, αs ,
and PDFs as well as the higher-order EWK corrections
the three data sets.
The signal processes are expected to produce very few Source of uncertainty Impact Impact
events containing b jets, and we reject events with any jets assuming assuming
signal no signal
that satisfy the b tagging algorithm working point used. In
order to account for the b tagging efficiencies observed in Integrated luminosity 0.013 0.002
data, an event-by-event reweighting using b tagging scale Lepton measurement 0.032 0.050
factors and efficiencies is applied to simulated events. The Jet energy scale and resolution 0.042 0.024
uncertainty is obtained by varying the event-by-event weight Pileup 0.012 0.009
by ±1 standard deviation. Since the uncertainties in the b b tagging efficiency 0.004 0.002
tagging are derived independently for the three data sets, Theory 0.088 0.085
they are treated as uncorrelated across the three data sets. Simulation sample size 0.024 0.023
The variation of the final yields induced by this procedure is Total systematic uncertainty 0.11 0.11
less than 1%. Statistical uncertainty 0.089 0.073
Simulated samples are reweighted to reproduce the pileup Total uncertainty 0.14 0.13
conditions observed in data. We evaluate the uncertainty
related to pileup by recalculating these weights for varia-
tions in the total inelastic cross section by 5% around the distribution are used as a shape uncertainty in the likelihood
nominal value [79]. The resulting shift in weights is propa- fit.
gated through the analysis and the corresponding pTmiss and The shapes of the pTmiss and m T distributions are needed
m T spectra are used as input to the maximum likelihood fit. for each of the background processes. For the DY and non-
The variation of the final yields induced by this procedure is resonant processes, we take the shape directly from simu-
less than 1%. lation. The distributions for the ZZ and WZ processes are
Shape-based uncertainties for the ZZ and WZ back- obtained by taking the shapes from the simulation and nor-
grounds, referred to jointly as VV, and signal processes are malizing them to the yield seen in the data in the CR. The
derived from variations of the renormalization and factoriza- gluon-induced and the quark-induced ZZ processes have dif-
tion scales, the strong coupling constant αS , and PDFs [80– ferent acceptances and their uncertainties are treated sepa-
82]. The scales are varied up and down by a factor of two. rately, while the normalization factors are taken to be cor-
Variations of the PDF set and αS are used to estimate the cor- related. In all cases, the limited number of simulated events
responding uncertainties in the yields of the signal and back- in any given bin gives rise to a systematic uncertainty. This
ground processes following Ref. [56]. The missing higher- uncertainty is treated as fully uncorrelated across the bins
order EW terms in the event generation for the VV processes and processes.
yield another source of theoretical uncertainty [83,84]. The A summary of the impact on the signal strength of the sys-
following additional higher-order corrections are applied: a tematic uncertainties is shown in Table 2. The Zh(invisible)
constant (approximately 10%) correction for the WZ cross model is used as an example to illustrate the size of the uncer-
section from NLO to NNLO in QCD calculations [85]; a con- tainties, both for the presence (B(h → invisible) = 1) and
stant (approximately 3%) correction for the WZ cross section absence (B(h → invisible) = 0) of a signal. These two
from LO to NLO in EW calculations, according to Ref. [86]; paradigms are used to generate Asimov data sets that are
a Δφ(Z, Z)-dependent correction to the ZZ production cross then fit to give the uncertainty estimates shown in Table 2.
section from NLO to next-to-next-to-leading order (NNLO) The systematic uncertainties are dominated by the theoret-
in QCD calculations [87]; a pT -dependent correction to the ical uncertainty in the ZZ and WZ background contribu-
ZZ cross section from LO to NLO in EW calculations, fol- tions.
lowing Refs. [83,84,86], which is the dominant correction in
the signal region. We use the product of the above NLO EW
corrections and the inclusive NLO QCD corrections [88] as 9 Results
an estimate of the missing NLO EW×NLO QCD contribu-
tion, which is not used as a correction, but rather assigned as The number of observed and expected events in the SR after
an uncertainty. The resulting variations in the pTmiss and m T the final selection is given in Table 3, where the values of the
12313 Page 10 of 33 Eur. Phys. J. C (2021) 81:13
Table 3 Observed number of events and post-fit background estimates
in the two jet multiplicity categories of the SR. The reported uncer-
tainty represents the sum in quadrature of the statistical and systematic
components
Process 0-jet category 1-jet category
Drell–Yan 502 ± 94 1179 ± 64
WZ 1479 ± 53 389 ± 16
ZZ 670 ± 27 282 ± 13
Nonresonant background 384 ± 31 263 ± 22
Other background 6.3 ± 0.7 6.8 ± 0.8
Total background 3040 ± 110 2120 ± 76
Data 3053 2142
Table 4 Expected yields and the product of acceptance and efficiency
for several models probed in the analysis. The quoted values correspond
to the Z → decays. The reported uncertainty represents the sum in
quadrature of the statistical and systematic components
Model Yields Product of accep-
tance and efficiency
(%)
Zh(125) 864 ± 64 10.6 ± 0.8
ADD MD = 35.1 ± 2.4 18.6 ± 1.3
3 TeV, n = 4
Unparticle 221 ± 16 8.2 ± 0.6
SU = 0, dU = 1.50
2HDM+ a m H = 14.1 ± 4.0 12.7 ± 2.7
1000 GeV, m a =
400 GeV
DM Vector m med = 64.8 ± 6.1 17.6 ± 1.7
1000 GeV, m χ =
1 GeV
expected yields and their uncertainties are obtained from the
maximum likelihood fit. The observed numbers of events are
compatible with the background predictions. The expected
yields and the product of acceptance and efficiency for several
signal models used in the analysis are shown in Table 4. The
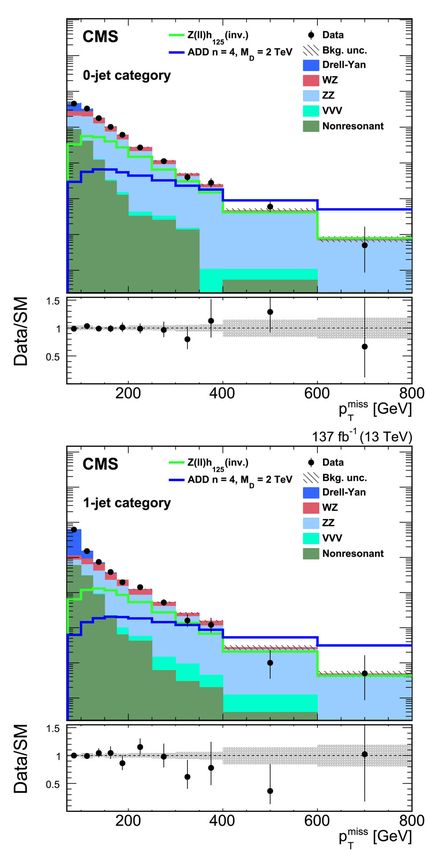
Fig. 3 The pTmiss distributions for events in the signal region in the 0-
post-fit pTmiss distributions for events in the signal region in jet (upper) and 1-jet (lower) categories. The rightmost bin also includes
the 0-jet and 1-jet categories are shown in Fig. 3. The final events with pTmiss > 800 GeV. The uncertainty band includes both
m T distributions used for the 2HDM+ a model are shown in statistical and systematic components. The Zh(invisible) signal nor-
Fig. 4. malization assumes SM production rates and the branching fraction
B(h → invisible) = 1. For the ADD model, the signal normalization
For each of the models considered, simulated signal sam- assumes the expected values for n = 4 and MD = 2 TeV
ples are generated for relevant sets of model parameters.
The observed pTmiss and m T spectra are used to set limits
on theories of new physics using the modified frequentist mediator as well as the coupling strengths of the mediator to
construction CLs [73,89,90] used in the asymptotic approx- quarks and to DM. The pTmiss distribution is used as an input
imation [91]. to the fit. Limits for the vector and axial-vector mediators are
shown as a function of the mediator mass m med and DM parti-
9.1 Simplified dark matter model interpretation cle mass m χ as shown in Figure 5. Cosmological constraints
on the DM abundance [92] are added to Fig. 5 where the
In the framework of the simplified models of DM, the signal shaded area represents the region where additional physics
production is sensitive to the mass, spin, and parity of the would be needed to describe the DM abundance. For vec-
123Eur. Phys. J. C (2021) 81:13 Page 11 of 33 13
Fig. 5 The 95% CL exclusion limits for the vector (upper) and the
axial-vector (lower) simplified models. The limits are shown as a func-
tion of the mediator and DM particle masses. The coupling to quarks is
fixed to gq = 0.25 and the coupling to DM is set to gχ = 1
Fig. 4 The m T distributions for events in the signal region in the 0-
jet (upper) and 1-jet (lower) categories. The rightmost bin includes all
events with m T > 1000 GeV. The uncertainty band includes both sta-
tistical and systematic components. The signal normalization assumes nucleon cross sections calculated following the suggestions
the expected values for m H = 1200 GeV, m a = 300 GeV within in Ref. [22]. Limits are shown as a function of the DM par-
the 2HDM+ a framework where m H = m H± = m A , tan β = 1 and
sin θ = 0.35 ticle mass for both the spin-independent and spin-dependent
cases and compared to selected results from direct-detection
experiments.
tor mediators, we observe a limit around m med > 870 GeV In addition to vector and axial-vector mediators, scalar
for most values of m χ less than m med /2. For axial-vector and pseudoscalar mediators are also tested. For these mod-
mediators the highest limit reached in the allowed region is els, we fix both couplings to quarks and to DM particles:
about m med > 800 GeV. In both cases, the previous lim- gq = 1 and gχ = 1 as suggested in Ref. [22]. Since the
its from this channel are extended by about 150 GeV, but choice of DM particle mass is shown to have negligible
the limits are still less restrictive than those from published effects on the kinematic distributions of the detected par-
mono-jet results [7] because weakly coupled Z bosons are ticles, we set it to the constant value of m χ = 1 GeV.
radiated from the initial state quarks much less frequently Figure 7 gives the 95% CL exclusion limits on the pro-
than gluons. Figure 6 shows the 90% CL limits on the DM- duction cross section over the predicted cross section as a
12313 Page 12 of 33 Eur. Phys. J. C (2021) 81:13
Fig. 6 The 90% CL DM-nucleon upper limits on the cross section
for simplified DM in the spin-independent (upper) and spin-dependent Fig. 7 The 95% CL upper limits on the cross section for simplified
(lower) cases. The coupling to quarks is set to gq = 0.25 and the DM models with scalar (upper) and pseudoscalar (lower) mediators.
coupling to DM is set to gχ = 1. Limits from the XENON1T [93], The coupling to quarks is set to gq = 1, the coupling to DM is set to
LUX [94], PandaX-ll [95], CRESST-III [96], and DarkSide-50 [97] gχ = 1 and the DM mass is m χ = 1 GeV
experiments are shown for the spin-independent case with vector cou-
plings. Limits from the PICO-60 [98], PICO-2L [99], IceCube [100],
and Super-Kamiokande [101] experiments are shown for the spin- 9.2 Two-Higgs-doublet model interpretation
dependent case with axial-vector couplings
For the 2HDM+ a model, the signal production is sensitive
to the heavy Higgs boson and the pseudoscalar a masses. As
discussed in Sect. 7, the m T distribution is used in the fit rather
function the mediator mass m med . The expected limits are than pTmiss . The limits on both the heavy Higgs boson and the
about 25% better than the previous results in this channel [4], additional pseudoscalar mediator a are shown in Fig. 8. The
but are not yet sensitive enough to exclude any value of mixing angles are set to tan β = 1 and sin θ = 0.35 with a
m med . The best limits obtained on the cross section are about DM particle mass of m χ = 10 GeV. The mediator mass with
1.5 times larger than the predicted values for low values of the most sensitivity is m H = 1000 GeV, where the observed
m med . (expected) limit on m a is 440 (340) GeV. For small values
123Eur. Phys. J. C (2021) 81:13 Page 13 of 33 13
Fig. 9 The value of the negative log-likelihood, −2ΔlnL, as a func-
tion of the branching fraction of the Higgs boson decaying to invisible
particles
Fig. 8 The 95% CL upper limits on the 2HDM+ a model with the
mixing angles set to tan β = 1 and sin θ = 0.35 and with a DM particle
mass of m χ = 10 GeV. The limits are shown as a function of the heavy
Higgs boson and the pseudoscalar masses
of m a , the limit on m H is about 1200 GeV. These can be
compared with the observed (expected) limits from ATLAS
of m a > 340 (340) GeV and m H > 1050 (1000) GeV based
√
on a s = 13 TeV data set corresponding to an integrated
luminosity of 36 fb−1 [102].
9.3 Invisible Higgs boson interpretation
For the search for invisible decays of the Higgs boson,
we use the pTmiss distribution as input to the fit. We obtain
upper limits on the product of the Higgs boson produc-
tion cross section and branching fraction to invisible par-
ticles σZh B(h → invisible). This can be interpreted as an Fig. 10 The 95% CL upper limits on unparticle+Z production cross
section, as a function of the scaling dimension dU . These limits apply
upper limit on B(h → invisible) by assuming the produc- to fixed values of the effective cutoff scale ΛU = 15 TeV and coupling
tion rate [52,103,104] for an SM Higgs boson at m h = λ=1
125 GeV. The observed (expected) 95% CL upper limit at
m h = 125 GeV on B(h → invisible) is 29% (25+9 −7 %) as
shown in Fig. 9. The observed (expected) limit from the pre- and 0.09 (0.07) pb for dU = 1, dU = 1.5, and dU = 2
vious CMS result in this channel was B(h → invisible) < respectively, compared to 1.0 (1.0) pb, 0.4 (0.4) pb, and 0.15
45(44)%. The combinations of all earlier results yields an (0.15) pb for the earlier result [4]. These limits depend on
observed (expected) limit of 19 (15)% from CMS [19] and the choice of λ and ΛU , as the cross section scales with the
26% (17+5 Wilson coefficient λ/ΛU [30]. We fix the coupling between
−5 %) from ATLAS [20].
the SM and the unparticle fields to λ = 1.
9.4 Unparticle interpretation
9.5 The ADD interpretation
In the unparticle scenario, the same analysis of the pTmiss
spectrum is performed. At 95% CL, upper limits are set on In the framework of the ADD model of extra dimensions, we
the cross section with ΛU = 15 TeV. The limits are shown use the fits to the pTmiss distribution to calculate limits on the
in Fig. 10 as a function of the scaling dimension dU . The number of extra dimensions n and the fundamental Planck
observed (expected) limits are 0.5 (0.7) pb, 0.24 (0.26) pb, scale MD . The cross section limit calculated as a function of
12313 Page 14 of 33 Eur. Phys. J. C (2021) 81:13
Table 5 Observed and expected 95% CL limits on parameters for the
simplified DM models, invisible decays of the Higgs boson, two-Higgs-
doublet model, large extra dimensions in the ADD scenario, and unpar-
ticle model. For the scalar and pseudoscalar mediators, the limits are
dependent on the mediator mass, so the lowest values for the ratio of
observed to theoretical cross sections are presented. For the vector and
axial-vector mediators, the limits are dependent on the DM particle
mass, so the limits are shown for m χ < 300 GeV for the vector media-
tor and m χ = 240 GeV for the axial-vector mediator
Model Parameter Observed Expected
DM-vector m med 870 GeV 870 GeV
gχ = 1
gq = 0.25
DM-axial-vector m med 800 GeV 800 GeV
gχ = 1
gq = 0.25
Fig. 11 The 95% CL cross section limit in the ADD scenario as a
DM-scalar σobs /σtheo 1.8 1.5
function of MD for n = 4
gχ = 1
gq = 1
m χ = 1 GeV
DM-pseudoscalar σobs /σtheo 1.8 1.4
gχ = 1
gq = 1
m χ = 1 GeV
2HDM+ a ma 330 GeV 440 GeV
tan β = 1
m χ = 1 GeV
sin θ = 0.35
m H = m A = 1 TeV
2HDM+ a mH 1200 GeV 1200 GeV
tan β = 1
m χ = 1 GeV
sin θ = 0.35
Fig. 12 The 95% CL expected and observed exclusion limits on MD
as a function of the number of extra dimensions n m a = 100 GeV
Invisible Higgs boson B(h → invisible) 0.29 0.25
ADD MD 2.8–2.9 TeV 2.6–2.7 TeV
MD for the case where n = 4 is shown in Fig. 11. The limits n = 2–7
on MD as a function of n are obtained, as shown in Fig. 12. Unparticles σ 0.26 pb 0.24 pb
The observed (expected) 95% CL exclusion upper limit on
Scaling dimension dU =1.5
the mass MD is 2.9–3.0 (2.7–2.8) TeV compared to earlier
results of 2.3–2.5 (2.3–2.5) TeV [4].
9.6 Summary of limits to search for physics beyond the standard model. The results
are interpreted in the context of several different models of
Table 5 gives a summary of the limits expected and observed the coupling mechanism between dark matter and ordinary
for a selection of relevant parameters in all of the models matter: simplified models of dark matter with vector, axial-
considered. vector, scalar, and pseudoscalar mediators; invisible decays
of a 125 GeV scalar Higgs boson; and a two-Higgs-doublet
model with an extra pseudoscalar. Outside the context of dark
10 Summary matter, models that invoke large extra dimensions or propose
the production of unparticles could contribute to the same sig-
Events with a Z boson recoiling against missing transverse nature and are also considered. The observed limits on the
momentum in proton–proton collisions at the LHC are used production cross sections are used to constrain parameters
123Eur. Phys. J. C (2021) 81:13 Page 15 of 33 13
of each of these models. The search utilizes a data set col- 128713, 128786, and 129058 (Hungary); the Council of Science and
lected by the CMS experiment in 2016–2018, corresponding Industrial Research, India; the HOMING PLUS program of the Foun-
√ dation for Polish Science, cofinanced from European Union, Regional
to an integrated luminosity of 137 fb−1 at s = 13 TeV. No Development Fund, the Mobility Plus program of the Ministry of Sci-
evidence of physics beyond the standard model is observed. ence and Higher Education, the National Science Center (Poland), con-
Comparing to the previous results in this channel based on tracts Harmonia 2014/14/M/ST2/00428, Opus 2014/13/B/ST2/02543,
√
a partial data sample collected at s = 13 TeV in 2016, 2014/15/B/ST2/03998, and 2015/19/B/ST2/02861, Sonata-bis 2012/
07/E/ST2/01406; the National Priorities Research Program by Qatar
corresponding to an integrated luminosity of approximately National Research Fund; the Ministry of Science and Higher Edu-
36 fb−1 for CMS [4] and for ATLAS [5], the exclusion limits cation, project no. 02.a03.21.0005 (Russia); the Programa Estatal de
for simplified dark matter mediators, gravitons and unpar- Fomento de la Investigación Científica y Técnica de Excelencia María
ticles are significantly extended. For the case of a 125 GeV de Maeztu, grant MDM-2015-0509 and the Programa Severo Ochoa del
Principado de Asturias; the Thalis and Aristeia programs cofinanced by
scalar boson, an upper limit of 29% is set for the branching EU-ESF and the Greek NSRF; the Rachadapisek Sompot Fund for Post-
fraction to fully invisible decays at 95% confidence level. doctoral Fellowship, Chulalongkorn University and the Chulalongkorn
Results for the two-Higgs-doublet model with an additional Academic into Its 2nd Century Project Advancement Project (Thai-
pseudoscalar are presented in this final state and probe masses land); the Kavli Foundation; the Nvidia Corporation; the SuperMicro
Corporation; the Welch Foundation, contract C-1845; and the Weston
of the pseudoscalar mediator up to 440 GeV and of the heavy Havens Foundation (USA).
Higgs boson up to 1200 GeV when the other model parame-
ters are set to specific benchmark values. Data Availability Statement This manuscript has no associated data or
the data will not be deposited. [Authors’ comment: Release and preser-
Acknowledgements We congratulate our colleagues in the CERN vation of data used by the CMS Collaboration as the basis for publica-
accelerator departments for the excellent performance of the LHC and tions is guided by the CMS policy as written in its document “CMS data
thank the technical and administrative staffs at CERN and at other CMS preservation, re-use and open access policy” (https://cms-docdb.cern.
institutes for their contributions to the success of the CMS effort. In ch/cgi-bin/PublicDocDB/RetrieveFile?docid=6032\&filename=CMS
addition, we gratefully acknowledge the computing centers and per- DataPolicyV1.2.pdf\&version=2).]
sonnel of the Worldwide LHC Computing Grid for delivering so effec-
tively the computing infrastructure essential to our analyses. Finally, we Compliance with ethical standards
acknowledge the enduring support for the construction and operation
of the LHC and the CMS detector provided by the following funding
agencies: BMBWF and FWF (Austria); FNRS and FWO (Belgium); Conflict of interest The authors declare that they have no conflict of
CNPq, CAPES, FAPERJ, FAPERGS, and FAPESP (Brazil); MES interest.
(Bulgaria); CERN; CAS, MoST, and NSFC (China); COLCIENCIAS
(Colombia); MSES and CSF (Croatia); RIF (Cyprus); SENESCYT Open Access This article is licensed under a Creative Commons Attri-
(Ecuador); MoER, ERC IUT, PUT and ERDF (Estonia); Academy of bution 4.0 International License, which permits use, sharing, adaptation,
Finland, MEC, and HIP (Finland); CEA and CNRS/IN2P3 (France); distribution and reproduction in any medium or format, as long as you
BMBF, DFG, and HGF (Germany); GSRT (Greece); NKFIA (Hun- give appropriate credit to the original author(s) and the source, pro-
gary); DAE and DST (India); IPM (Iran); SFI (Ireland); INFN (Italy); vide a link to the Creative Commons licence, and indicate if changes
MSIP and NRF (Republic of Korea); MES (Latvia); LAS (Lithuania); were made. The images or other third party material in this article
MOE and UM (Malaysia); BUAP, CINVESTAV, CONACYT, LNS, are included in the article’s Creative Commons licence, unless indi-
SEP, and UASLP-FAI (Mexico); MOS (Montenegro); MBIE (New cated otherwise in a credit line to the material. If material is not
Zealand); PAEC (Pakistan); MSHE and NSC (Poland); FCT (Portugal); included in the article’s Creative Commons licence and your intended
JINR (Dubna); MON, RosAtom, RAS, RFBR, and NRC KI (Russia); use is not permitted by statutory regulation or exceeds the permit-
MESTD (Serbia); SEIDI, CPAN, PCTI, and FEDER (Spain); MOSTR ted use, you will need to obtain permission directly from the copy-
(Sri Lanka); Swiss Funding Agencies (Switzerland); MST (Taipei); right holder. To view a copy of this licence, visit http://creativecomm
ThEPCenter, IPST, STAR, and NSTDA (Thailand); TUBITAK and ons.org/licenses/by/4.0/.
TAEK (Turkey); NASU (Ukraine); STFC (United Kingdom); DOE Funded by SCOAP3 .
and NSF (USA). Individuals have received support from the Marie-
Curie program and the European Research Council and Horizon 2020
Grant, contract Nos. 675440, 752730, and 765710 (European Union);
the Leventis Foundation; the A.P. Sloan Foundation; the Alexander
von Humboldt Foundation; the Belgian Federal Science Policy Office;
the Fonds pour la Formation à la Recherche dans l’Industrie et dans
References
l’Agriculture (FRIA-Belgium); the Agentschap voor Innovatie door
Wetenschap en Technologie (IWT-Belgium); the F.R.S.-FNRS and 1. G. Bertone, D. Hooper, History of dark matter. Rev. Mod.
FWO (Belgium) under the “Excellence of Science – EOS” – be.h project Phys. 90, 045002 (2018). https://doi.org/10.1103/RevModPhys.
n. 30820817; the Beijing Municipal Science & Technology Commis- 90.045002. arXiv:1605.04909
sion, No. Z191100007219010; the Ministry of Education, Youth and 2. S.F. Daniel et al., Testing general relativity with current cosmo-
Sports (MEYS) of the Czech Republic; the Deutsche Forschungsge- logical data. Phys. Rev. D 81, 123508 (2010). https://doi.org/10.
meinschaft (DFG) under Germany’s Excellence Strategy – EXC 2121 1103/PhysRevD.81.123508. arXiv:1002.1962
“Quantum Universe” – 390833306; the Lendület (“Momentum”) Pro- 3. Planck Collaboration, Planck 2018 results. I. overview and the
gram and the János Bolyai Research Scholarship of the Hungarian cosmological legacy of Planck (2018). arXiv:1807.06205
Academy of Sciences, the New National Excellence Program ÚNKP, 4. CMS Collaboration, Search for new physics in events with a
the NKFIA research grants 123842, 123959, 124845, 124850, 125105, leptonically decaying Z boson and a large transverse
√ momen-
tum imbalance in proton-proton collisions at s = 13 TeV.
123You can also read