CLIMATE CHANGE REPORT - MANITOBA HYDRO'S Insight into the strategies making Manitoba Hydro an industry leader in responding to climate change
←
→
Page content transcription
If your browser does not render page correctly, please read the page content below
MANITOBA HYDRO’S

           CLIMATE CHANGE REPORT

               Insight into the strategies making Manitoba Hydro
               an industry leader in responding to climate change

Published March 2020
CONTENT

     INTRODUCTION                                                  6
         Climate Change Science                                     8

         Climate Change Indicators                                 10

         Climate Change Strategies                                 12

    1 UNDERSTAND                                                   14
     1.1 Global Climate Change                                     15

     1.2 Climate Change & Manitoba Hydro                           17

     1.3 Manitoba Hydro’s Climate Change Studies                   18

         1.3.1 Hydroclimatic Monitoring & Analysis                 20

         1.3.2 Climate Change Scenarios                            26

         1.3.3 Hydrological Modelling                              48

         1.3.4 Uncertainty in Future Projections                   55

     1.4 Memberships, Working Groups, and Research & Development   56

    2 REPORT                                                       62
     2.1 Emission Trends                                           64

     2.2 Direct Emission Sources                                   66

     2.3 Mandatory Reporting Requirements                          69

     2.4 Life Cycle Assessments                                    70

     2.5 Reservoir GHG Research                                    72

1
2
3 REDUCE                                                       74
 3.1 Reductions in Fossil-Fueled Generation                    75

 3.2 Renewable Generation Development                          76

 3.3 Demand-Side Management                                    78

 3.4 Global Emission Reductions                                79

4 SUPPORT                                                      80
 4.1 Canadian Climate Mitigation Policies                      81

 4.2 Manitoba’s Climate & Green Plan                           82

 4.3 Supporting Climate Policy in Wholesale Markets            83

 4.4 Renewable Electricity Energy Markets                      84

 4.5 Memberships, Working Groups, and Research & Development   85

5 ADAPT                                                        86
 5.1 Resource Planning                                         88

 5.2 Streamflow Forecasting                                    89

 5.3 Transmission & Distribution System Reliability            90

 5.4 Greenhouse Gas Pricing Implications                       91

 REFERENCES                                                    92

                                                                    1
                                                                    3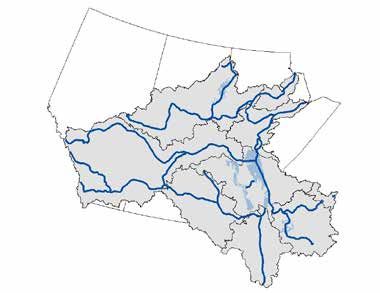
MANITOBA HYDRO'S

          CLIMATE CHANGE STRATEGY
                            CLIMATE CHANGE AFFECTS US ALL

  International efforts like the Paris Agreement bring humanity closer to solutions, but realities like increased greenhouse
  gases in our atmosphere and continued global industrialization mean that some climate change effects are inevitable.
  Our interaction with climate change is two-way: we can be impacted by physical changes in the climate and our
  operations can impact greenhouse gas emissions that contribute to climate change.
    • As earth’s climate changes, our environment is also changing, which can affect our water supply, infrastructure,
      energy demand, and other things. These effects of climate change may require us to adapt in order to continue
      meeting Manitobans’ energy expectations.
    • Renewable energy like hydropower is environmentally friendly and helps mitigate climate change. We continually
      strive to maintain our leadership in reducing global greenhouse gas emissions.

                   5 STRATEGIES HELP SHAPE OUR RESPONSE

                           1
                 UNDERSTAND
  Earth’s climate is warming and temperature changes
  affect many of the planet’s natural processes
  like precipitation, streamflow, and wind patterns.
  We collaborate with leading researchers and apply
  rigorously reviewed scientific knowledge to
  more thoroughly understand historical climate
  records and future climate projections.

                                                                                                 2

 AVERAGE              AVERAGE                MANITOBA
                                                                                           REPORT
 AMERICAN             CANADIAN                HYDRO’S                   Canadian governments now require large companies to
 UTILITY’S            UTILITY’S             CO2 PER GWh                 report their greenhouse gas emissions, but we began
CO2 PER GWh          CO2 PER GWh
                                                 0.4                    voluntarily reporting in 1995. Reporting on emissions
                                                                        helps us see how we’re doing and how we can improve.
  459                    135                   TONNES
  TONNES                TONNES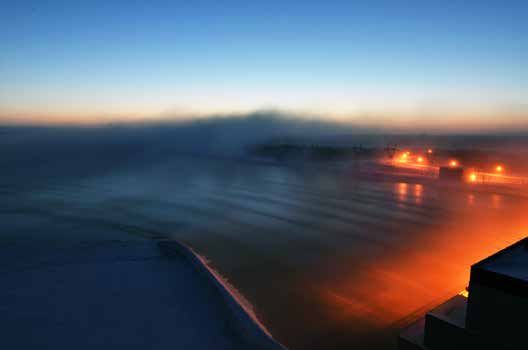
WIND
                                3
                          REDUCE
Greenhouse gas emissions cause climate change. By relying as                               HYDRO
much as possible on renewable resources we are reducing global
emissions. The Keeyask hydroelectric generating station is under
construction and we have ceased all generation using coal as fuel.
Our hydro energy is often abundant and hydropower
systems offer flexibility. Exporting extra electricity
to neighbouring provinces and states can
help reduce their emissions too.

                                                                                                       4
                                                                                               SUPPORT
                                          100            +               Everyone needs to help reduce greenhouse gas emissions.
                                                                         Through engagement with governments, industry groups,
                                           YEARS                         non‑government organizations, and other stakeholders, we
                                                                         support the development of policies that reduce emissions
                                                                         and help mitigate climate change. Our support also
                                  OF RENEWABLE                           includes openly sharing the technical knowledge
                                ENERGY EXPERIENCE                        and experience we’ve gained over decades.

                                5                                             INCREASED
                                                                              RESILIENCE

                           ADAPT                                                                            STREAMFLOW
                                                                                                            FORECASTING
Whether it’s increasing our system’s resilience or enhancing
our streamflow forecasting capabilities, applying climate
information helps us reduce weather-related risks, manage
reliability, and capitalize on opportunities. We’re continuing our
work to identify, assess, prioritize, and study climate change’s
effect on our world and our business. Areas of interest
include energy generation, energy demand, environmental
sustainability, and infrastructure.

                                             WE’RE IN IT TOGETHER

                                            Manitoba Hydro is committed to helping the world reduce
                                            emissions and mitigate the effects of climate change.
                                            As the climate continues to change, we are adapting
                                            our processes to ensure we continue delivering reliable,
                                            renewable energy to Manitobans.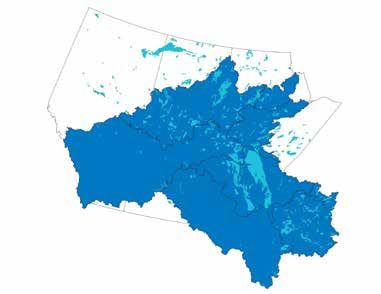
INTRODUCTION

            Earth’s climate is dynamic. Changes result from internal (natural) forcing – such
            as oceanic oscillations – and external forcing such as volcanic eruptions, solar
            activity, and atmospheric greenhouse gas (GHG) concentrations. The likely
            dominant cause of recently observed warming since the mid-20th century is
            human-caused increases in GHG emissions ultimately leading to increased GHG
            concentrations in the atmosphere [IPCC, 2014]. International efforts like the
            Paris Agreement bring humanity closer to solutions, but increased GHGs in our
            atmosphere and continued global industrialization mean some effects of climate
            change are inevitable. As an energy utility, our interaction with climate change is
            two-way: physical changes in the climate system impact us, and our operations
            can impact GHG emissions that contribute to climate change.

1
6   INTRODUCTION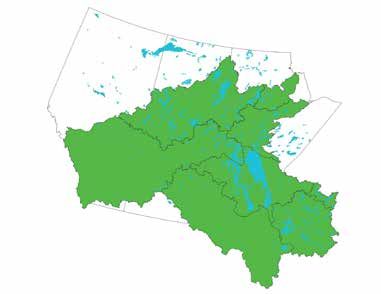
Climate change has been on our radar since the 1980s. This report provides an update to our climate change activities
including research, greenhouse gas emission reporting, greenhouse gas reductions, policy support, and adaptation activities.
This is the third climate change report, which builds on previous versions (Manitoba Hydro, 2013a; Manitoba Hydro,
2015a). Additional details on some of our past activities, not included in this report, can be found in those reports.

                 Up to now we have focused on                     “Warming of the climate system during
                 building a foundation of knowledge
                                                                   the Industrial Era is unequivocal, based
                 and tools that enable us to conduct
                 climate change impact studies. We                 on robust evidence from a suite of
                 employ sophisticated climate models               indicators. Global average temperature
                 and downscaling techniques to
                                                                   has increased, as have atmospheric water
                 develop future climate scenarios and
                 examine resulting impacts on business             vapour and ocean heat content. Land ice
                 practices. Future water supply                    has melted and thinned, contributing to
                 remains a large focus of our work
                                                                   sea level rise, and Arctic sea ice has been
                 and these assessments use advanced
                 hydrological models for watersheds                much reduced.”
                 of interest to help simulate potential                   Canada’s Changing Climate Report [ECCC, 2019a]
                 future hydrological conditions.

                 It’s more than water – our impact
                 studies are expanding to help us understand how climate change might affect
                 all our operations. This understanding will help us adapt to continue meeting
                 Manitobans’ energy expectations in the face of climate change.

                 Our low-emitting renewable power also mitigates global climate change.
                 Meeting global climate targets means relying on renewable energy, like
                 hydropower, and the power we export helps mitigate emissions from other
                 forms of energy.

                 We also assist in shaping policy frameworks, guiding development of efficient
                 technologies, and helping domestic customers make wise choices regarding their
                 energy use.

                                                                                                   INTRODUCTION            1
                                                                                                                           7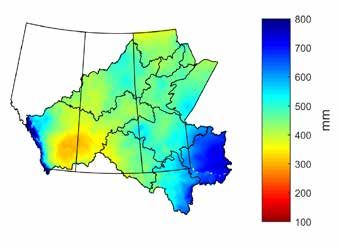
CLIMATE CHANGE SCIENCE
            To understand how GHGs influence the Earth’s temperature, consider
            the Earth’s energy balance. It is driven mainly by radiation from the sun.
            Approximately 30% of sunlight that reaches Earth’s atmosphere is reflected
            back into space. The rest is absorbed and is converted from light energy into
            heat. Keeping the energy roughly in balance, Earth radiates heat back to space
            as longwave (infrared) radiation. GHGs (e.g. water vapor; carbon dioxide CO2;
            methane CH4; and nitrous oxide N2O) absorb the reflected infrared radiation,
            acting as a partial blanket. By trapping heat, these gases act like the glass in a
            greenhouse, warming Earth’s surface. This results in the common name for the
            GHG-caused climate change: “the greenhouse effect”. This process is critical in
            maintaining a habitable planet. In the absence of any GHGs, the planet would be
            too cold to support many life forms. But an excess of GHGs in the atmosphere
            presents problems.

             FIGURE

               1         Schematic of the greenhouse effect

                                                            CO2 and other gases in
                                                            the atmosphere trap heat,
                                                            keeping the earth warm.

                  Some solar
                  radiation is
                  reflected back
                  into space.

1
8   INTRODUCTION
Burning fossil fuels like coal, natural gas, and oil releases   “Human activities are
additional heat-trapping gases. Since the industrial
                                                                 estimated to have caused
revolution, humans have burned more fossil fuels each
successive decade. This intensifies the greenhouse effect,       approximately 1.0°C of
changing the Earth’s climate. A key atmospheric indicator        global warming above pre-
is the accumulation of CO2 in the atmosphere. The
                                                                 industrial levels, with a likely
average concentration measured at Mauna Loa in 2019
was 411.44 ppm [Trans and Keeling, 2019]. Although               range of 0.8°C to 1.2°C.
GHG composition within the atmosphere has changed                Global warming is likely to
over the course of the Earth’s history, the magnitude and
                                                                 reach 1.5°C between 2030
rate of the recent changes appear to be unprecedented.
                                                                 and 2052 if it continues to
International efforts to reduce GHG emissions will help
limit the impacts of climate change but warming due
                                                                 increase at the current rate.
to historic emissions will persist for centuries and will        (high confidence)”.
continue to cause long-term changes in the climate                    IPCC Special Report [IPCC, 2018]
system [IPCC, 2018].

 FIGURE      Monthly mean carbon dioxide at Mauna Loa Observatory, Hawaii

   2         [Trans and Keeling 2019]
             Atmospheric CO2 data on Mauna Loa constitutes the longest
             record of direct measurements of CO2 in the atmosphere.

                                                                            INTRODUCTION           1
                                                                                                   9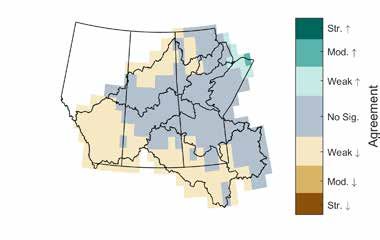
CLIMATE CHANGE INDICATORS
             Physical and biological indicators can help us measure changes to the Earth’s
             environment. Surface temperatures measured on land and at sea for more than a
             century show a long-term warming trend in globally averaged temperature. The
             spatial extent of Arctic sea ice is another useful indicator as ice grows and shrinks
             over the course of the year. Throughout summer, increased solar radiation and
             higher temperature typically result in sea ice shrinking to its minimum extent
             each September. Sea ice responds to warmer temperature by retreating further.
             Minimum sea ice (observed in September) has declined by an average of 13% per
             decade compared to the 1981–2010 average [Derksen et al., 2018]. Reduced ice
             and snow cover decreases the amount of sunlight reflected from Earth’s surface
             and allows for more absorption of heat, which contributes to additional warming.
             This is an example of “positive feedback”, which reinforces the warming cycle.

             Studies conducted nationally and regionally have also presented other indicators
             of a changing climate [ECCC, 2019a; Henderson and Sauchyn, 2008; Lemmen
             and Warren, 2004; Meehl et al., 2007; van Oldenborgh et al., 2013; Sauchyn and
             Kulshreshtha, 2008; Warren and Lemmen, 2014]. Some regional studies show that
             changes that may be attributed to climate change are already being observed in
             specific components of the environment (Table 1). For example, shifts in seasonality
             are evident in the observed shortening of the winter season [Vincent et al., 2018],
             increases in vegetation growth [Ballatyne and Nol, 2015], and decreases in the
             establishment of perennial lake ice in Northern regions [Paquette et al., 2015].
             Seasonal shifts are prominent during the melting season and indicated by earlier
             ice break up and earlier spring peak streamflow [Bonsal et al., 2019; Derksen
             et al., 2018; Du et al., 2017]. Due to challenges in attribution studies, longer
             observational time frames are typically required before more confident statements
             can be drawn linking detected changes in some indicators to climate change.

             Climate change studies can often be hindered by short time frames of available
             observations. Indigenous peoples of regions with observable climate change
             impacts can provide insights into these challenges through the application of
             Traditional Knowledge Systems. Traditional knowledge is a separate way of knowing
             and is the “cumulative body of knowledge, practice, and belief, evolving by adaptive
             processes and handed down through generations by cultural transmission, about
             the relationship of living beings (including humans) with one another and with their
             environment” [Berkes, et al., 2000]. Traditional Knowledge Systems can provide
             distinct ways of understanding climate change, identifying indicators as well as
             preparing and applying innovative adaptation techniques.

1
10   INTRODUCTION
TABLE
1 Sample of climate change indicators and references
Climate Change
Observation Climate Seasonality
Indicators
Climate Seasonality Shorter winter season Vincent et al., 2018
Permafrost Increasing depth of active Derksen et al., 2018
Thaw Rates layer above permafrost
Aquatic Animals Increases in algal production Paterson et al., 2017
& Habitat
Decrease in nesting density Ballatyne and Nol, 2015
of whimbrels (shore bird) due
Terrestrial Animals to increases in shrub cover
& Habitat
Increase in Canada goose
population
Earlier break up of lake ice Derksen, et al., 2018;
Du et al., 2017
Unusual loss of perennial Paquette et al., 2015
lake ice cover
Lake & Sea
Ice Cover
Decrease in sea ice extent Kirchmeier-Young,
et al., 2017
Decrease in extent of ice and Mudryk, et al., 2018
snow cover
Earlier spring peak Bonsal et al., 2019
streamflow
Streamflow
Higher winter and spring
flows
INTRODUCTION 1
11CLIMATE CHANGE STRATEGIES
It is clear our activities as humans are resulting in climate change. Reducing GHG
emissions and avoiding risks associated with climate change requires a variety of actions
to address local and global challenges. We strive to understand and manage risks,
liabilities, and opportunities related to climate change. The following five climate change
strategies have been established to shape our response to climate change:
1. Understand
2. Report
3. Reduce
4. Support
5. Adapt
UNDERSTAND REPORT
We strive to understand the Accurately reporting our GHG
implications of climate change. This emissions is essential for us to
includes maintaining a comprehensive understand our liabilities and to help
understanding of the science of us discover opportunities for further
anthropogenic climate change, and mitigation. Reporting also allows the
the resulting local, regional, and global public and governments to see how
hydrological impacts. A comprehensive we are doing, and follow our progress.
understanding is vital to ensure Estimating the emissions of our major
that we can plan for and adapt to a projects provides transparency and
changing physical environment. clarifies their overall impact.
1
12 INTRODUCTIONFIGURE Global implications of Manitoba Hydro operations
3 [Manitoba Hydro, 2019]
Net cumulative greenhouse emission reductions.
240
220
Global GHG Emission Reductions
200
(Megatonnes of CO2e)
180
160
140
120
100
80
60
40
20
2004
2008
2016
2000
2002
2012
2018
1998
2006
1994
1996
1992
2014
2010
WIND INCREASED
RESILIENCE
HYDRO 100 +
YEARS
OF RENEWABLE STREAMFLOW
ENERGY EXPERIENCE FORECASTING
REDUCE SUPPORT ADAPT
Our operations have always had low We all need effective strategies Responding to a changing physical
GHG emissions intensity relative to to mitigate the effects of climate environment means we need
other electrical utilities but our entire change and achieve necessary GHG robust plans for potential climate
inventory is still emitting at historically reductions. For more than 25 years, scenarios, and we need to position
low levels. This is because we have we have lent our technical and market our operations to adapt to changing
continued to pursue hydropower, expertise to support the development, parameters like flow conditions and
wind generation, and demand-side evaluation, and implementation of electrical loads. We must also adapt to
management and removed coal standards, regulations, legislation, the human response to climate change
power from our portfolio. Our overall voluntary programs, and markets that that may include changes in societal
operations continue to significantly aim to reduce GHG emissions. We preferences for energy sources and
help reduce global GHG emissions, far continue to support local, regional, policies and their implications on the
outweighing the impact of any direct national, and international climate market price for electricity.
emissions we cause. and energy policy dialogues, striving
to encourage policies that are
both environmentally effective and
economically efficient.
INTRODUCTION 1
131
UNDERSTAND
The physical environment is critical to our core business. We continue to invest
resources to ensure we understand the changing climate and the potential range
of climate change impacts. This positions us to adapt accordingly.
1
14 UNDERSTAND1.1 GLOBAL CLIMATE CHANGE
Understanding the difference between weather The United Nations Environment
and climate is critical to studying climate change.
Programme and the World
• Weather refers to the day-to-day Meteorological Organization
variable state of the atmosphere, and is
characterized by temperature, precipitation,
established the Intergovernmental
wind, clouds, and various other weather Panel on Climate Change (IPCC)
elements [IPCC, 2013]. Weather results in 1988. The IPCC was created
from rapidly developing and decaying
weather systems and is challenging to
to provide policymakers with
predict on a daily basis. regular scientific assessments on
• Climate refers to the weather statistics in climate change, its implications
terms of its means, variability, extremes, and potential future risks, as well
etc. over a certain time span and area as to put forward adaptation
[IPCC, 2013]. Climate varies from place to
place depending on many factors including: and mitigation options. Along
latitude, vegetation cover, distance to large with other reports, the IPCC
bodies of water, topography, and other brings together many of the
significant geographic features.
world’s leading scientists
The IPCC refers to climate change when there
to prepare comprehensive
is a statistically significant variation to the mean
state of the climate (or of its variability) that Assessment Reports about the
usually persists for decades or longer and which state of scientific, technical and
includes shifts in the frequency and magnitude
socio-economic knowledge
of sporadic significant weather events as well as
the slow continuous rise in global mean surface on climate change; the IPCC is
temperature [IPCC, 2013]. currently working on their sixth
Meeting the Paris Agreement target of holding Assessment Report.
Global Mean Temperature (GMT) “well below
2°C” requires an understanding of how GMT
has changed historically and is projected to change in the future. The pre-industrial
period—until approximately 1750—corresponds to the time before large-scale
industrial activity involving fossil fuel combustion and is used as a reference for the
2°C target. However, due to limited observations during this time, 1850–1900
is used by the IPCC to approximate pre-industrial GMT [IPCC, 2018]. The
IPCC also commonly reports more recent baseline periods. Kirtman et al.,
(2013) reported a GMT increase of 0.61°C from the pre-industrial period to
1986–2005. And using the average of multiple datasets, Allen et al., (2018)
estimates GMT increases of 0.63°C, 0.64°C and 0.87°C for the 1986–
2005, 1981–2010, and 2006–2015 periods respectively.
UNDERSTAND 1
15“This Agreement... Temperature is not expected to increase uniformly in space or time and there
is an interest in understanding impacts at the regional and local scales, but
aims to strengthen
evaluating historic changes can be challenging due to limited observations. For
the global response example, the Hadley Centre – Climatic Research Unit Version 4 dataset [Morice
to the threat of et al., 2012] used in Kirtman et al. (2013) and Allen et al. (2018) is gridded at
5° latitude by 5° longitude and has 11 grids that intersect Manitoba. Of these
climate change...by
11 grids, the earliest observation is 1872 in the grid containing Winnipeg.
holding the increase Considering the 1981–2010 period and using 1872–1900 as a proxy for pre-
in the global average industrial times, Winnipeg has warmed approximately 2.3°C. Adjusted and
Homogenized Canadian Climate Data (AHCCD) [Vincent et al., 2015] from
temperature to
Environment and Climate Change Canada suggests 2.6°C of warming over the
well below 2°C same periods. Cowtan and Way (2014) applied kriging interpolation to fill gaps
above pre‑industrial in the Hadley Centre – Climatic Research Unit Version 4 dataset and show
an increase of 1.7°C at Winnipeg from 1850–1900 to 1981–2010, which
levels and pursuing
highlights some of the uncertainty in quantifying historic changes.
efforts to limit the
Global Climate Models (GCMs) can also be used to compare projected local
temperature increase changes relative to increases in GMT. Following a time sampling approach
to 1.5°C above [James et al., 2017] the median of 40 GCM simulations projects 2°C of GMT
pre-industrial levels, warming (0.61°C observed plus 1.39°C projected from 1981–2010) to occur in
the 2030–2059 period. This future period corresponds to 2.4°C of additional
recognizing that this warming at Winnipeg, relative to 1981–2010. Similarly, the average scaling
would significantly relationship between GMT increase and local change developed from 40 GCM
reduce the risks and simulations project Winnipeg to warm at approximately 1.7 times the rate of
GMT which is consistent with supplementary information in Seneviratne et al.
impacts of climate (2016). Li et al. (2018) found that Canada as a whole is projected to warm at
change” about twice the rate of GMT and shows how several extreme climate indices are
The Paris Agreement projected to change. Overall, it is evident that changes in climate can occur more
[United Nations, 2015] rapidly at the local scale relative to global average change.
FIGURE Examples of weather, natural climate variability, and
4 climate change time scales
CLIMATE CHANGE
NATURAL VARIABILITY
WEATHER
HOURS DAYS MONTHS YEARS DECADES CENTURIES
Rain Blizzard Wet/Dry El Niño/ Pacific Global Warming
Season Southern Decadal
Oscillation Oscillation
1
16 UNDERSTAND1.2 CLIMATE CHANGE & MANITOBA HYDRO
Climate change scientists have
projected changes in future FIGURE Impacts of climate change on
temperature and precipitation
patterns, frequency and intensity
5 Manitoba Hydro
of severe weather events, and ENERGY SUPPLY
sea level rise as a result of rising • Resource availability (water, wind)
• Generation planning and operations
concentrations of anthropogenic • Financial planning
GHGs in the atmosphere [IPCC, • Export markets
2014]. For energy utilities like us,
these changes have the potential ENERGY DEMAND (Electricity and Natural Gas)
• Decreased winter heating
to influence a wide variety of • Increased summer cooling
corporate functions (Figure 5). • Policy and technology changes
We plan, construct, and
operate physical assets based INFRASTRUCTURE DESIGN & MANAGEMENT
• Spillways, powerhouses, dykes, transmission
on historical climatic and and distribution towers, electrical stations, etc.
hydrologic conditions, and • Dam safety and asset management
changes in climate may alter • Changing codes and standards
their performance. Transmission
ENVIRONMENTAL ASSESSMENTS
and distribution systems may • Physical environment studies
be exposed to a number of • Life cycle assessment and greenhouse
vulnerabilities of climate change gas reporting
• Stakeholder engagement
such as extreme weather
events. We are striving to assess HUMAN RESOURCES & CUSTOMER SERVICE
the risks associated with climate • Safety and emergency preparedness
change and determine how best • Working conditions for field staff
• Communication availability
to adapt to future conditions.
We consider several study
domains when conducting climate change studies. Hydrological studies consider
all of the basins in the Nelson-Churchill Watershed which supply approximately
97% of our energy in the form of water. This watershed is 1.4 million km2
which covers a sizable portion of central North America and includes a range
of different ecozones and geographic areas. The average water volume and
energy supplied from each of the major sub-basins is illustrated in Figure 6 as
a percentage of the entire Nelson-Churchill Watershed. Other climate change
studies, such as those concerning the impact of atmospheric variables on
infrastructure, may consider a smaller domain such as the province of Manitoba.
UNDERSTAND 1
171.3 MANITOBA HYDRO’S
CLIMATE CHANGE STUDIES
We have initiated a series of comprehensive studies to increase our knowledge
of the implications of future climate change. The main objectives of these
studies is to incorporate results into long-term planning, operations, and risk
management and to adapt infrastructure and business practices to continue
serving our core functions.
FIGURE
6 Nelson-Churchill Watershed characteristics
• Panel A illustrates the major sub-basin names and general flow direction.
• Panel B illustrates Ecozones [Commission for Environmental Cooperation, 1997].
1
A Major sub-basin names and general flow direction 1
B Ecozones
Ecozone
BOREAL PLAIN
HUDSON PLAIN
MIXED WOOD PLAINS
MIXED WOOD SHIELD
SOFTWOOD SHIELD
TAIGA SHIELD
TEMPERATE PRAIRIES
WEST-CENTRAL SEMIARID PRAIRIES
WESTERN CORDILLERA
1
18 UNDERSTANDThe approach to these studies is to couple impact models with outputs from
reputable climate change modelling centres. We have been working with leading
experts (such as those involved in the Ouranos consortium; Section 1.4) in
climatology, hydrology, and atmospheric sciences. As new models and tools
become available, the ability to project changes in climatic variables at the
regional level will evolve.
Nelson-Churchill Watershed characteristics (continued)*
• Panel C illustrates contribution of total water supply.
• Panel D illustrates contribution of total energy supply.
Percentages are based on 1981–2010 average inflows available for outflow. For the Churchill River,
only a portion of the inflow available for outflow is diverted into the Nelson River.
*Totals may not add up to 100% due to rounding
1
C Contribution of total water supply (%) 1
D Contribution of total energy supply (%)
30% 25%
10% 7%
17% 19%
10% 8%
6% 26% 5% 35%
UNDERSTAND 1
191.3.1 HYDROCLIMATIC MONITORING & ANALYSIS
Monitoring & analysis is an important step for characterizing the historical hydrology
and climate (hydroclimate) conditions in the Nelson-Churchill Watershed. This
information provides the foundation for understanding future hydroclimatic variability
and change.
MONITORING
We monitor changes in the regional climate and hydrology using meteorological and
hydrometric information. This information includes measurements of temperature,
precipitation, wind speed, and streamflow provided by our Hydrometrics Program
Environment, and Climate Change Canada (e.g., Meteorological Service of Canada and
Water Survey of Canada), and other gridded and modelled datasets. Under Manitoba
Hydro/Manitoba’s Coordinated Aquatic Monitoring Program, we also monitor additional
environmental parameters including water quality (more than 50 parameters are
analyzed including temperature, dissolved oxygen, pH, etc.), phytoplankton (algae), fish
community, benthic invertebrates, and sediment quality.
NORMALS (1981–2010)
In general, the annual average temperature in the Nelson-Churchill Watershed ranges
from −6.5˚C in the northeast to +6.1˚C in the southwest. Total precipitation ranges
from 323 mm in the west to 777 mm in the east with some Rocky Mountain regions
exceeding 1,000 mm annually. The Nelson-Churchill Watershed shows strong seasonal
patterns with colder temperatures and less precipitation in the
Climate normals winter, and warmer temperatures and greater precipitation in the
represent the average summer. Spring and fall are shoulder seasons with temperature and
precipitation normals falling between those observed during winter
climatic conditions over and summer.
a certain time period at
The figures on the following page illustrate annual temperature
a certain location. and total precipitation normals across Manitoba and the
Nelson‑Churchill Watershed. These annual normals are
also supplemented with seasonal normals. Data used to generate these figures is
interpolated from observed stations to a 10 km × 10 km grid. A Canadian dataset
archived by Natural Resources Canada [Hopkinson et al. 2011, Hutchinson et al. 2009]
was merged with a U.S. dataset [Livneh at al., 2013] by Ouranos.
Similar to meteorological conditions, hydrological conditions (e.g., annual water supply)
within the Nelson-Churchill Watershed is also spatially diverse.
1
20 UNDERSTANDFIGURE Annual climate normals for average temperature (left) and total precipitation (right)
7 (1981–2010)
FIGURE
8 Seasonal average temperature normals (1981–2010)
Seasons are winter (DJF), spring (MAM), summer (JJA), and fall (SON).
Winter Spring Summer Fall
FIGURE
9
Seasonal precipitation normals (1981–2010)
Seasons are winter (DJF), spring (MAM), summer (JJA), and fall (SON).
Winter Spring Summer Fall
UNDERSTAND 1
21Table 2 summarizes the average streamflow conditions for contributing
sub-basins of the Nelson-Churchill Watershed for the 1981–2010 period.
Average streamflow near the outlets of each basin varies from 48 cubic metres
per second (m3/s) from the Assiniboine River Basin to 947 m3/s from the
Winnipeg River Basin.
TABLE
2 Average annual streamflow near basin outlets (1981–2010)
Annual Streamflow (m3/s)
Outlet
Basin Station Name
Gauge ID
Min Mean Max
Saskatchewan Saskatchewan 05KJ001 308 551 960
River River at The Pas
Assiniboine Assiniboine River 05MJ001 14 48 103
Rivera at Headingley
Red River at 05OC001 28 184 405
Red River
Emerson
Winnipeg River at 05PF063 458 947 1415
Winnipeg Riverb
Pine Falls
East and West 05UB008 1139 2181 3566
Lake Winnipegc Channels 05UB009
Churchill River 06EB004 574 844 1321
Churchill River
above Leaf Rapids
Nelson River at 05UF006 2157 3278 5114
Nelson Riverc,d
Kettle Rapids
a Record reflects losses due to the Portage Diversion
b Includes flow from the Lake St. Joseph Diversion
c Record represents the combined flow of all upstream basins
d Includes Churchill River Diversion
1
22 UNDERSTANDTRENDS
A gridded version of Environment and Climate Change Canada's AHCCD is used
to evaluate temperature and precipitation trends. All grids within Manitoban and
Canadian portions of the Nelson-Churchill Watershed show statistically significant
increasing mean temperature trends over the 1948–2014 period. Statistically
significant changes to precipitation were also found in some regions, however,
the results are less spatially consistent (Figure 10). Most grids show increasing
precipitation trends but decreasing trends can also be found. Despite the variability
in precipitation trend direction and magnitude, there seems to be evidence that
precipitation has increased in eastern portion of the Nelson-Churchill Watershed.
Vincent et al. (2015) presents seasonal trends, examines different time periods,
and looks at additional variables such as the snowfall ratio, snow cover, snow depth,
and streamflow.
FIGURE
Historic trends for mean annual temperature (left) and mean annual precipitation
10 (right) (1948–2014)
Hatching indicates statistically significant trends at the 5% level. This dataset does
not contain information for the United States.
Regional and global trends in extreme events are described in the IPCC’s Special
Report on Managing the Risks of Extreme Events and Disasters to Advance Climate
Change [SREX, 2012] which generally reports greater confidence in temperature-
related extremes. Trends in extreme events vary spatially throughout Manitoba.
Figure 11 illustrates trends in extreme low temperatures using point values from
Environment and Climate Change Canada's AHCCD, for stations with suitable data
from 1948 to 2014. Results show increases throughout a large portion of the
Nelson-Churchill Watershed with only a few stations reporting insignificant trends.
Results are similar for other temperature-related variables including decreases in
frost and ice days, increased growing season length, and reduced cold spell durations.
UNDERSTAND 1
23FIGURE Historic trends in extreme minimum temperature using Adjusted and
11 Homogenized Canadian Climate Data (1948–2014)
Triangle orientation indicates the direction of the trend. Larger filled triangles
indicate statistically significant trends, while smaller open triangles indicate
stations where trends are not statistically significant. Colours also indicate trend
direction where red shows an increase in temperature and blue shows a decrease.
This dataset does not contain information for the United States.
Trends in extreme precipitation events are less consistent in space, but show
some instances of statistically significant increases in the number of cumulative
wet days, and reduced number of cumulative dry days. Some other precipitation-
related extreme indices show varied results with increases in some regions and
decreases in other areas; and there is low confidence in wind speed-related trends.
More complex trends such as multi-year hydrological droughts, with fewer historic
events, are more difficult to draw conclusions about. Vincent et al. (2018) provides
a more comprehensive view of changes to extreme indices derived from daily
temperature and precipitation data.
Streamflow trends are useful in representing the area aggregated climate signal
within a watershed. However, trend analysis can be challenging due to large natural
variability and regulatory effects. Streamflow trends in the Nelson-Churchill
Watershed exhibit spatial variability and are sensitive to the time period examined.
Using unadjusted Water Survey of Canada data, statistically significant increasing
trends in mean annual streamflow were detected for a number of streamflow
gauges in the Nelson-Churchill Watershed (Figure 12). Special interpretation is
required at some sites due to anthropogenic influences such as diversions in the
Winnipeg River Basin and on the Burntwood and Nelson rivers.
1
24 UNDERSTANDFIGURE Historic trends for mean annual streamflow using unadjusted water survey of
12 Canada data (1975–2014)
Triangle orientation indicates the direction of the trend. Large filled triangles
indicate statistically significant trends, while smaller open triangles indicate stations
where trends are not statistically significant. Colours also indicate trend direction
where blue shows an increase in flow and red shows a decrease. This dataset does
not contain information for the United States.
It is important to acknowledge that trend analysis results can be sensitive to the record length, missing
data, and the use of different record periods, all of which can contribute to variability. Trend analysis
results are intended to develop an understanding on the direction and significance of historic climate
change and are not to be used to project the precise change into the future.
ADDITIONAL DATA SOURCES
We also use a number of additional data sources to understand historic climate. These data sources
include paleoclimate data, oceanic oscillations, reanalysis products from numerical models, and
remote‑sensed data from satellites.
Paleoclimate data is recognized as a potential source for extending observed records back in time.
Sources of paleoclimate data include tree rings and lake sediments which can be correlated to
hydroclimatic variables and used as proxy records. We are interested in exploring the use of these
datasets in our hydroclimatic studies, but direct applications are currently limited due to availability
of long term spatially consistent proxy records and uncertainties in reconstructed hydroclimatic time
series, especially in watersheds as large and diverse as the Nelson-Churchill Watershed. We follow the
advances of paleoclimatic reconstruction techniques and explore potential applications of paleoclimatic
records to better inform our decision making.
We also seek to understand connectivity between observed phenomena (such as oceanic oscillations
and sun spots) and hydroclimate in the Nelson-Churchill Watershed. While some variability may be
explained through study of these relationships, there are challenges in operationalizing the information
throughout the entire hydraulic system due to spatial variability and the absence of a single signal that
accurately predicts water supply in all hydrological conditions (i.e. wet, dry, and average flow years).
UNDERSTAND 1
251.3.2 CLIMATE CHANGE SCENARIOS
In addition to leading research, compiling information, and providing climate change
study guidance, the IPCC also brings together international modelling agencies that have
developed GCMs to conduct assessments. The IPCC’s Fifth Assessment Report was released
in 2013 and is the most recent report available. Work is
Representative Concentration currently underway for the Sixth Assessment Report and
it is scheduled for publication in 2021 and 2022. The Fifth
Pathways (RCPs) represent
Assessment Report was based on results using a suite of GCMs
socio-economic and emission from the Coupled Model Intercomparison Project Phase 5
scenarios used as inputs for (CMIP5). Many of the CMIP5 GCMs offer improvements
over the previous generation (CMIP3), including finer spatial
climate models to explore
resolutions and the inclusion of carbon cycling. Simulations
plausible future conditions. and analyses are currently underway for CMIP6, which include
RCPs consider multiple a number of special experiments such as an abrupt quadrupling
of CO2 simulation [Eyring et al., 2016].
factors including population,
technology, energy use, and GCMs are numerical models used to translate future
atmospheric forcing (e.g. GHG concentrations) scenarios into
emissions of greenhouse gases.
physically consistent effects on the climate. GCMs compute
Four RCPs describe a range energy and mass balances based on physical equations and are
of future worlds and their the most advanced tools for projecting future climate. GCM
is used herein as a generic term referring to Atmosphere-
associated warming potential as
Ocean General Circulation Models and Earth System Models.
a function of radiative forcing GCMs couple multiple sub-models which simulate various
measured in watts per square processes including the atmosphere, ocean, land surface, sea
ice, and biosphere. Common variables of interest such as air
meter (W/m2). RCP8.5 is a
temperature, precipitation, pressure, and wind are products
high end scenario (high energy of the atmospheric sub-model. Hydrology is represented
intensity, high population coarsely within land surface schemes which output variables
such as runoff and soil moisture.
growth, limited technology
development, and limited GCMs are forced by Representative Concentration Pathways
(RCP) [van Vuuren et al., 2011] which are used to prescribe
climate policy) and is associated the levels of various forcing agents (e.g. GHGs and aerosols)
with an increase of 8.5 W/m2 in the atmosphere. RCPs include a number of assumptions
of additional warming on the about societal evolution and represent different demographic,
social, economic, regulatory, technological, and environmental
earth's surface. developments. Four RCPs are currently considered by the
CMIP5 GCMs and they represent a range of futures from the
optimistic (RCP2.6) to a business as usual case (RCP8.5). Global CO2 emissions are presently
tracking closest to RCP8.5 but given the large time horizon, it is not possible to accurately
predict which RCP will be the closest to reality in the year 2100.
1
26 UNDERSTANDFIGURE
13 Trajectories of CO2 concentration and modelled global surface
warming from various Representative Concentration Pathways
CO2
GCMs tend to agree on the future warming of the earth however their projection of
precipitation and other climatic parameters at the regional or local scale is less consistent
and has a greater degree of uncertainty. GCMs use relatively coarse resolutions, ranging
from approximately 40 km to 400 km horizontally, and include 18 to 95 vertical levels
which can make it challenging to interpret projected changes at finer scales. Therefore,
agencies have developed Regional Climate Models (RCMs) which simulate the climate for
a limited area such as North America at a finer resolution than the GCMs. Just like the
GCMs, these models are physically based but their resolution is typically 50 km or less
allowing them to be able to account for important local forcing factors such as better
topography representation, especially in mountain regions and other geographic features
which GCMs are unable to resolve.
Figure 23 and 24 illustrate the resolution of the Canadian Centre for Climate Modelling
and Analysis Canadian Earth System Model version 2 (CanESM2) compared to two RCMs.
Manitoba Hydro (2015a) employed a GCM simulation ensemble of opportunity
(147 simulations from 18 GCMs available at the time) to develop future climate projections.
Reflected in this report, the GCM simulation selection process was recently improved to
provide a more democratic ensemble [Sanderson et al., 2015]. Future climate projections
are based on an ensemble of 40 simulations from 18 GCMs, shown in Table 3.
The selection captures GCM simulations with both RCP4.5 and RCP8.5 forcing scenarios
that contain monthly output for variables of interest (minimum, maximum, and mean
temperature, precipitation, evapotranspiration, runoff, and wind speed) spanning 1981–
2099. The selection process reduces over-representation of GCMs with multiple member
UNDERSTAND 1
27runs and modelling agencies with multiple GCMs. The Kullback-Liebler Divergence
[Knutti et al., 2013] was used to guide GCM simulation selection and ensure that
a wide range of GCM projection uncertainty was sampled. Figure 14 illustrates
the difference between the original 147 simulation ensemble and the new
ensemble (sub-set) of 40 simulations. This particular comparison shows that the
40 simulation ensemble forecasts a similar, but slightly warmer and wetter, future
compared to the original ensemble on an annual basis. For certain studies, RCMs
such as the Canadian Regional Climate Model or the Weather Research Forecast
Model are also used and allow analysis at finer spatial resolution.
TABLE
3 Global Climate Models [Flato et al., 2013]*
Number of Simulations Ensemble Representation
Model Country
RCP4.5 RCP8.5 by Model Agency
BCC-CSM1.1 China 1 1
10%
BCC-CSM1.1(m) China 1 1
BNU-ESM China 1 1 5%
CanESM2 Canada 2 2 10%
CMCC-CM Italy 1 1 5%
CSIRO-Mk3.6.0 Australia 2 2 10%
GFDL-ESM2g USA 1 1
10%
GFDL-ESM2m USA 1 1
GISS-E2-H USA 1 1
10%
GISS-E2-R USA 1 1
INM-CM4 Russia 1 1 5%
IPSL-CM5a-MR France 1 1
10%
IPSL-CM5b-LR France 1 1
MIROC5 Japan 1 1
10%
MIROC-ESM Japan 1 1
MPI-ESM-LR Germany 1 1
10%
MPI-ESM-MR Germany 1 1
MRI-CGCM3 Japan 1 1 5%
*Manitoba Hydro acknowledges the World Climate Research Programme’s Working Group on
Coupled Modelling which is responsible for CMIP and the climate modelling groups who produced
and made their model outputs available.
1
28 UNDERSTANDFIGURE Projected changes in annual precipitation and temperature
14 within the Nelson-Churchill Watershed for the 2050s
relative to 1981–2010
Each point represents a Global Climate Model simulation
with the selected 40 simulations outlined in black. Red circle
marker denotes the ensemble average from all simulations
while the orange star marker denotes the ensemble average
from the sub-set of 40 simulations.
Most climate models (GCMs and RCMs) have a tendency to underestimate or
overestimate baseline climate conditions. These differences in climate models
are called biases when they occur consistently. Applying adjustments to raw
climate simulations before they are used in a regional climate analyses is one way
we handle these biases. We apply various methods to develop regional scenarios
such as dynamic downscaling with a RCM, bias correction with quantile mapping,
and the delta method (Figure 15). Bias correction methods aim to adjust the
climate simulation time series such that it better matches historic observations
while delta methods add the change computed from climate simulations to
the observed record [Huard et al., 2014]. The delta method is one of the most
common methods as it provides realistic temporal sequencing associated with
the historic record and allows future climate change impacts to be evaluated in
the context of historical events.
UNDERSTAND 1
29To assist with developing quality regional climate change (downscaled)
projections we have become an affiliated member of the Ouranos consortium
(Section 1.4). Through its affiliation we gain access to expert guidance for
analytical processes used to resolve key features of regional climate and
Ouranos’ Canadian RCM data.
FIGURE
15 Downscaling methods
Global Climate Model Observations/Reanalysis
Dynamical Downscaling
(regional climate model)
Bias Correction Statistical Downscaling
(analogue, transfer
(delta, quantile mapping) functions, stochastic)
Regional Climate
Scenarios
For the Nelson-Churchill Watershed the GCM ensemble median (using the
40 simulation ensemble of RCP4.5 and RCP8.5) projected changes (deltas) in
minimum, maximum, and mean temperature, precipitation, evaporation, runoff,
and wind speed for the 2050s (2040–2069) are presented in Table 4, and
Figures 16, 17, 19, 20, and 21. Figures present deltas obtained from raw GCM
data that have been interpolated to a common grid of 1° latitude by 1° longitude.
Future streamflow projections can be found in Section 1.3.3.
1
30 UNDERSTANDAgreement among GCM projections can provide a measure of confidence. For
example, mean annual temperature in the Nelson-Churchill Watershed will likely
increase as all GCM projections are in agreement on this direction of change. Some
literature refers to this type of information as a measure of robustness or evidence
supporting a signal. The IPCC [Mastrandrea et al., 2010] provides guidance on
treating uncertainty and suggests qualifiers to express confidence and likelihood
(virtually certain; very likely; likely; about as likely as not; unlikely; very unlikely; and,
exceptionally unlikely). Since we rely on an ensemble of GCM simulations, we use
agreement among these simulations about the direction of projected change to
characterize the climate change signal:
• strong increase or strong decrease describes signals where 90% to 100% of
GCM projections are in agreement;
• moderate increase or moderate decrease describes signals where 76% to 89%
of GCM projections are in agreement;
• weak increase or weak decrease describes signals where 61% to 75% of
GCM projections are in agreement;
• no signal describes instances where only 50% to 60% of GCM projections are
in agreement.
These definitions provide a simple means of better understanding certainty in
the direction of change but do not provide information about the magnitude of
change. The GCM ensemble median is used as a best guess for the magnitude.
Projections are presented and discussed separately, by climate variable, below.
Projections are tabulated in Tables 4 to 7 and illustrated in Figures 16, 17, 19, 20,
and 21.
TABLE
Global Climate Model ensemble median annual projections for the 2050s
4 relative to 1981–2010
Temperature Wind
Watershed Precipitation Evaporation Runoff
Min Mean Max Speed
Churchill River 3.1°C Ç 2.7°C Ç 2.5°C Ç 7.1% Ç 8.4% Ç 4.0% Ç -0.7% È
Saskatchewan River 2.6°C Ç 2.5°C Ç 2.3°C Ç 6.9% Ç 7.8% Ç 6.2% Ç -0.9% È
Assiniboine River 2.9°C Ç 2.7°C Ç 2.5°C Ç 7.6% Ç 8.5% Ç -1.2% È -0.5% È
Red River 2.9°C Ç 2.8°C Ç 2.6°C Ç 5.6% Ç 7.3% Ç -1.1% È -0.5% È
Winnipeg River 3.1°C Ç 2.8°C Ç 2.4°C Ç 6.9% Ç 8.2% Ç 3.3% Ç -0.4% È
Lake Winnipeg 3.1°C Ç 2.8°C Ç 2.6°C Ç 7.1% Ç 9.1% Ç 2.3% Ç -0.3% È
Nelson River 3.2°C Ç 2.9°C Ç 2.6°C Ç 6.2% Ç 8.0% Ç 1.4% Ç 0.1% Ç
Nelson-Churchill Watershed 2.9°C Ç 2.7°C Ç 2.5°C Ç 6.8% Ç 7.8% Ç 4.6% Ç -0.7% È
UNDERSTAND 1
31TEMPERATURE
GCMs show a strong signal that temperature will increase in the future at annual
and seasonal scales. Annually, the Nelson-Churchill Watershed is projected to
experience mean temperatures that are 2.7°C warmer than the baseline. This
corresponds to slightly greater changes in the average minimum temperature
relative to changes in the average maximum temperature.
Seasonally, the Nelson-Churchill Watershed is projected to experience greater
temperature increases in the winter relative to other seasons. This is supported
in literature suggesting that reduced snow cover in a warmer climate provides
lower reflectance (surface albedo) of incoming solar radiation and therefore
more absorption of heat by the land surface.
Similarly, northern areas are projected to experience greater temperature
increases relative to southern areas. One exception to this projection is
during summer months where southern areas may experience slightly greater
increases than northern areas. This behaviour is possibly due to the absence of
precipitation which reduces capacity for evaporative cooling in the summer.
TABLE Global Climate Model ensemble median
5 seasonal temperature projections for the
2050s relative to 1981–2010
Watershed Winter Spring Summer Fall
Churchill River 3.8°C Ç 2.4°C Ç 2.2°C Ç 2.8°C Ç
Saskatchewan River 3.1°C Ç 2.1°C Ç 2.5°C Ç 2.5°C Ç
Assiniboine River 3.5°C Ç 2.3°C Ç 2.6°C Ç 2.8°C Ç
Red River 3.5°C Ç 2.3°C Ç 2.6°C Ç 2.7°C Ç
Winnipeg River 3.4°C Ç 2.4°C Ç 2.6°C Ç 2.7°C Ç
Lake Winnipeg 3.6°C Ç 2.5°C Ç 2.5°C Ç 2.8°C Ç
Nelson River 3.9°C Ç 2.6°C Ç 2.3°C Ç 2.9°C Ç
Nelson-Churchill Watershed 3.4°C Ç 2.3°C Ç 2.4°C Ç 2.7°C Ç
1
32 UNDERSTANDFIGURE
Global Climate Model ensemble median projected change (left) and agreement (right) for 2050s
16 mean annual temperature relative to 1981–2010 (top panels)
Seasonal projected change and agreement shown in lower panels. Seasons are winter (DJF),
spring (MAM), summer (JJA), and fall (SON).
SEASONAL PROJECTED CHANGE
Winter Spring Summer Fall
SEASONAL AGREEMENT
Winter Spring Summer Fall
UNDERSTAND 1
33PRECIPITATION
Annually, the GCM ensemble shows a moderate to strong signal that annual
precipitation will increase in the Nelson-Churchill Watershed. The ensemble
median projects a spatially averaged 6.8% increase.
The GCM ensemble shows moderate to strong signals that precipitation will
increase in winter and spring accompanied with weak to strong signals that
precipitation will increase in fall. Southern (northern) basins project decreasing
(increasing) summer precipitation but the agreement is weak.
TABLE Global Climate Model ensemble median
6 seasonal precipitation projections for the
2050s relative to 1981–2010
Watershed Winter Spring Summer Fall
Churchill River 11.3% Ç 10.5% Ç 4.7% Ç 8.1%Ç
Saskatchewan River 9.2% Ç 14.3% Ç -0.4% È 5.6%Ç
Assiniboine River 9.2% Ç 16.8% Ç -1.7% È 8.3%Ç
Red River 7.7% Ç 11.7% Ç -0.8% È 5.0%Ç
Winnipeg River 11.3% Ç 11.5% Ç -0.1% È 5.7%Ç
Lake Winnipeg 11.3% Ç 12.2% Ç 0.0%ÅÆ 7.6%Ç
Nelson River 12.8% Ç 10.7% Ç 2.1% Ç 6.5%Ç
Nelson-Churchill Watershed 10.9% Ç 14.0% Ç 0.1% Ç 7.8%Ç
1
34 UNDERSTANDFIGURE
Global Climate Model ensemble median projected change (left) and agreement (right) for 2050s
17 mean annual precipitation relative to 1981–2010 (top panels)
Seasonal projected change and agreement shown in lower panels. Seasons are winter (DJF),
spring (MAM), summer (JJA), and fall (SON).
SEASONAL PROJECTED CHANGE
Winter Spring Summer Fall
SEASONAL AGREEMENT
Winter Spring Summer Fall
UNDERSTAND 1
35EVAPORATION
The GCM ensemble shows moderate to strong signals that evaporation will
increase in the future annually as well as in winter and spring. Increases are also
projected for summer and fall, but there are regions of less agreement (weaker
signals; Figure 19).
This is largely due to evaporative potential being driven by temperature
and precipitation.
FIGURE January morning evaporation near the Long Spruce
18 generating station
Despite frigid air temperatures, evaporation can still occur in
winter. When cold, dry air blows over a (relatively) warm water
body, it is heated by the water’s surface and humidified through
evaporation. This relatively warm air quickly cools as it rises
from the water surface, causing the water vapour in the air to
condense into a thick fog.
1
36 UNDERSTANDFIGURE
Global Climate Model ensemble median projected change (left) and agreement (right) for 2050s
19 mean annual evaporation relative to 1981–2010 (top panels)
Seasonal projected change and agreement shown in lower panels. Seasons are winter (DJF),
spring (MAM), summer (JJA), and fall (SON). Some grids are masked due to differences in GCM land
surface schemes and representation of large water bodies like Lake Winnipeg.
SEASONAL PROJECTED CHANGE
Winter Spring Summer Fall
SEASONAL AGREEMENT
Winter Spring Summer Fall
UNDERSTAND 1
37RUNOFF
GCM runoff is used as a basic measure of water availability [Frigon, 2010]
to better understand changes in water supply. Due to limitations in GCM
representations of hydrological processes (e.g., coarse resolution and lack of
routing) GCM runoff is used as a preliminary variable, providing a broad view
of how runoff is projected to change over large geographic areas. GCM runoff
projections are complemented with more thorough hydrological modelling
to examine finer details such as seasonal shifts in timing at finer temporal and
spatial resolutions. This is covered in Section 1.3.3.
The GCM ensemble median projects a 4.6% increase in mean annual runoff in
the Nelson-Churchill Watershed, but there is little agreement among GCM
simulations in most areas. Some northern and eastern parts of the watershed
show weak to moderate agreement that runoff will increase annually and a small
area in the south shows weak agreement that runoff will decrease. Similar signals
are seen for summer and fall.
In contrast, a strong signal is seen throughout a majority of the basin indicating
that winter runoff will increase. This is likely due to warmer temperatures
reducing the duration when precipitation is stored as snow and not contributing
to runoff. Warmer temperatures may also lead to increased rain-on-snow
events and snowmelt which contribute to runoff. GCMs also show weak
agreement in a large portion of the watershed that spring runoff will decrease.
This behaviour can likely be attributed to reduced snowpack accumulated
over the winter or increased temperatures causing more evaporation. It is
important to note that for large basins, seasonal runoff changes may not directly
correspond to streamflow changes in the same season as there is often a lag due
to river routing, lake attenuation, and regulation.
1
38 UNDERSTANDYou can also read