Investing in a Time of Climate Change - GLOBAL WEALTH The Sequel 2019 - India Environment Portal
←
→
Page content transcription
If your browser does not render page correctly, please read the page content below

G L O B A L W E A LT H

Investing in a Time
of Climate Change
The Sequel 2019

Investing in a Time of Climate Change   The Sequel 2019                                                    1

Contents                                     Foreword

                                             Executive Summary
                                                                                                          02

                                                                                                          06

                                             Why Is Climate Change Important to Investors?                12

                                             How Can Mercer’s Climate Scenario Modeling Help Investors?   18

                                             What Are the Portfolio Impact Results?                       32

                                             What Actions Can Investors Take?                             65

                                             Supplement 1: Investor Case Studies                          70

                                             Appendix 1: Sample Asset Allocations                         75

                                             Appendix 2: Methodology                                      76

                                             Acknowledgements                                             84

                                             Select Bibliography                                          86

                                             Contacts                                                     87

                                             End Notes                                                    88

                                             Important Notices                                            94
Investing in a Time of Climate Change   The Sequel 2019                                                                     2

Foreword                                In 2011, Mercer published its first major global research report on climate
                                        change and its implications for strategic asset allocation, in partnership with a
                                        number of our institutional investment clients. In June 2015, we released a major
                                        update, Investing in a Time of Climate Change (“the 2015 Report”), another client
                                        collaboration. We are now publishing Investing in a Time of Climate Change —
                                        The Sequel (“the Sequel”).

                                        Following our 2015 Report, major developments in late 2015 included two global
                                        agreements: The Paris Climate Change Agreement and the UN Sustainable
                                        Development Goals. The Paris Agreement reflects a collective goal to hold the
                                        increase in the climate’s global mean surface temperature to “well below 2⁰C
                                        above preindustrial levels and to pursue efforts to limit the temperature increase
                                        to 1.5⁰C.”¹ The current aggregate commitments, as measured by each country’s
                                        nationally determined contributions (NDCs) will not, however, meet the agreed
                                        global ambitions unless commitments are significantly improved in the relatively
                                        near term.²

                                        Since 2015, there have been many environmental, scientific, political and
                                        technological developments that continue to evolve our understanding of the
                                        climate-change-related investment context. In response to these developments
                                        and client demand, Mercer has now updated its climate scenario model and is
                                        proud to publish the Sequel. Mercer is recognized globally for its contribution to
                                        the investment industry’s growing attention to and action on climate change. The
                                        Sequel provides practical advice for clients as well as case studies on what peers
                                        are doing. Our focus is on what is new and the “why, how and what” for investors
                                        as well as providing clients with the flexibility to undertake stress testing.

                                        The Sequel is intended to help investors understand how climate change can
                                        influence their investment performance in both the short and long term and what
                                        steps they should take to protect and position portfolio assets. Given climate-
                                        related physical damages under higher-warming scenarios, we encourage
                                        investors to adopt a “Future Maker” approach, a term coined in the 2015 Report.
                                        Advocating for and creating the investment conditions that support a “well-below
                                        2⁰C scenario” outcome through investment decisions and engagement activities
                                        is most likely to provide the economic and investment environment necessary
                                        to pay pensions, endowment grants and insurance claims over the timeframes
                                        required by beneficiaries. We look forward to engaging directly with our clients
                                        to ensure their portfolios are well-positioned for and resilient to the impacts of
                                        climate change in the future.

                                        Deb Clarke
                                        Global Head of Investment Research

    Return to Contents page
Investing in a Time of Climate Change   The Sequel 2019                                         3

                                        Advocating for and creating the investment
                                        conditions that support a “well-below 2⁰C scenario”
                                        outcome through investment decisions and
                                        engagement activities is most likely to provide the
                                        economic and investment environment necessary
                                        to pay pensions, endowment grants and insurance
                                        claims over the timeframes required by beneficiaries.
Investing in a Time of Climate Change   The Sequel 2019                                                                  4

Mercer’s Actions to Date                Mercer is working to ensure that climate change is integral to our advice and
                                        solutions for clients on a global basis, as championed by our industry-leading
on Climate Change                       global Responsible Investment business.³
Investing in a Time of Climate Change     The Sequel 2019                                                                       5

Mercer has evolved internal investment    Mercer collaborates with industry
processes to include:                     groups, including:

• Specific references to climate          • Actively participating in the TCFD as      Our parent company, Marsh &
  change in our global investment           a Task Force member and signing the        McLennan Companies, created Marsh
  beliefs as a “systemic risk” and          statement of support⁹                      & McLennan Insights (previously the
  encouraging investors to “consider                                                   Global Risk Center). This group plays a
  the potential financial impacts of      • Signing all G20 investor letters on        key role in the World Economic Forum
  both the associated transition to a       climate change since 201410                Global Risks Report each year and has
  low-carbon economy and the                                                           established Climate Resilience as a key
                                          • Producing an in-depth study with
  physical impacts under different                                                     theme16 and published a handbook on
                                            Ceres on addressing climate-related
  climate outcomes”⁴                                                                   the topic.17 It has also released a report
                                            considerations for insurers11
                                                                                       in collaboration with CDP18 and recently
• Updated global manager research                                                      appointed its first Director of
                                          • Producing an in-depth study on the
  guidance by asset class to                                                           Climate Resilience.
                                            implications of climate change for
  incorporate relevant climate
                                            public defined benefit plans in the US
  change considerations
                                            in collaboration with CIEL12
• Commitments on the Financial
                                          • Focusing on the critical theme of
  Stability Board’s Task Force on
                                            mobilizing private-sector investment
  Climate-related Financial Disclosures
                                            in sustainable infrastructure
  (TCFD)⁵ reporting, through the
                                            in emerging markets through
  regional sustainable investment
                                            partnerships with the Inter-American
  policies⁶ governing Mercer’s assets
                                            Development Bank Group (IDBG)13 and
  under management (along with other
                                            the Mobilizing Institutional Investors
  market-leading practices)
                                            for the Development of African
• Formal allocations to sustainability-     Infrastructure initiative (MiDA)14
  themed equity, private equity and
                                          • Supporting our sister company Oliver
  real assets (infrastructure and
                                            Wyman in 2017/2018 in their climate
  natural resources) in Mercer’s global
                                            risk tool development to assess
  reference portfolios⁷
                                            credit risk in bank-lending portfolios15
• Issuing a first “impact report”
  in 2018 quantifying the positive
  environmental contributions of
  our private markets Sustainable
  Opportunities strategy⁸
Investing in a Time of Climate Change   Executive Summary                                                                   6

Executive                               Why Is Climate Change Important to Investors?
                                        Investors such as pension funds, insurers, wealth managers, and endowments

Summary
                                        and foundations typically have multidecade time horizons, with portfolio exposure
                                        across the global economy. The implications of climate change are systemic
                                        and are already apparent.19 We have already experienced around 1⁰C of average
                                        warming above preindustrial levels,20 and extraordinary weather events with
                                        significant financial and human consequences are increasing in frequency.21
                                        Humans have never lived in a world much warmer than today; yet the current
                                        trajectory of at least 3⁰C above the preindustrial average by 2100 could put us
Humans have never lived
                                        beyond the realm of human experience sometime in the next 30 years.22 Investors
in a world much warmer                  need to consider both climate-related mitigation and adaptation in an active way
than today; yet the current             to develop climate resilience in their portfolios. Financial regulators, particularly
trajectory of at least 3°C              for pension funds, are increasingly reinforcing this message by formalizing the
above the preindustrial                 expectation that investors should consider the materiality of climate-related
                                        risks and manage them accordingly, consistent with their fiduciary duties.
average by 2100 could
put us beyond the realm
of human experience
sometime in the next
30 years.

    Return to Contents page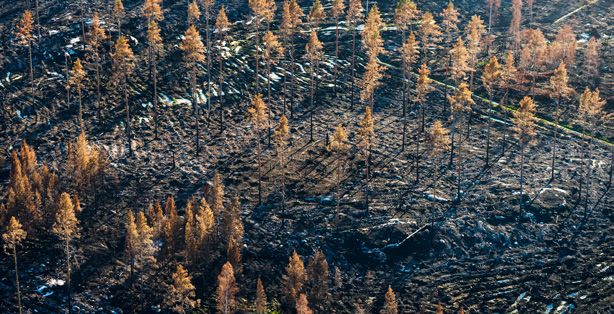
Investing in a Time of Climate Change   Executive Summary                                                                  7

                                        How Can Client Scenario Modeling Help Investors?
                                        Investors often use scenario analysis to support strategic asset allocation
                                        decisions, as it helps to test portfolio resilience under multiple potential
                                        future outcomes. Climate scenario analysis was a key element of the TCFD23
                                        recommendations released in 2017.

                                        Mercer’s latest climate scenario model draws on third-party data that integrates
                                        the treatment of economics, energy systems and the environment to capture
The model assists investors             linkages and feedbacks. The model helps investors analyze the impact of climate-
                                        related physical damages (physical risks) and the transition to a low-carbon
in analyzing the impact of              economy (transition risks) on their expected investment return outlook.
climate-related physical
damages (physical risks)                Mercer’s three climate scenarios provide investors with analysis of asset-class
and the transition to a low-            and industry-sector sensitivities to climate risk factors to quantify a forward-
                                        looking “climate impact on return.” In addition to calculating long-term annualized
carbon economy (transition              impacts, the model also contains a short-term stress-testing component, which
risks) on their expected                enables an assessment of present-value impacts for sudden market repricing
investment return outlook.              events, allowing for changes in view on scenario probability, physical damages
                                        likelihood and market awareness.
Investing in a Time of Climate Change           Executive Summary                                                                   8

What’s New?                                     • New economic underpinnings: The 2019 model uses an established econometric
The Sequel builds on the 2015                     model, maintained by Cambridge Econometrics, based primarily on empirical
climate scenario model and                        evidence rather than assumptions regarding optimization. This results in a
approach but evolves it in a number               very different treatment of transition risk impacts and a more positive view
of ways to capture developments                   on the investment opportunity presented by a low-carbon transition than the
over the past three years. New                    2015 model.
features include:
                                                • Updated climate scenarios: These scenarios use the Cambridge Econometrics
                                                  transition-risk climate model, which has applied recent econometric research
                                                  across multiple economic variables to consider three scenarios, 2⁰C, 3⁰C and
                                                  4⁰C temperature increases, with evolved pathways and magnitude.i

                                                • Updated climate risk factors approach: This approach evolves the four
                                                  risk factors from 2015 — policy and technology to capture transition and
                                                  resource availability and impact of catastrophes to capture physical damages.
                                                  In the updated model, the interactions between policy and technology are
                                                  represented together as “transition” and the rate of investment spending
                                                  isolated as “spending,” better identifying the difference between 2⁰C and 3⁰C
                                                  scenario transitions.

                                                • Physical damages: Damages are assessed with results extending to 2100 (rather
                                                  than 2050 as in the 2015 Report) under the different climate scenarios. Many
                                                  institutional investors and their beneficiaries have multidecade time horizons
                                                  that reach beyond 2050. Alternative physical damages views in academic
                                                  literature are also presented, given the many data gaps and uncertainties in
                                                  this area, allowing model users to test different assumptions regarding the
                                                  potential physical damage impact on asset returns.

                                                • Additional asset classes: New asset classes have been incorporated, including
                                                  additional regional flexibility and several sustainability-themed options — for
                                                  example, sustainable global equity, sustainable private equity and sustainable
                                                  infrastructure — to improve the mapping of investor portfolios transitioning to
                                                  low-carbon, resilient exposures.

                                                • A stress-test component: This has been introduced to better compare
i
 In October 2018, the Intergovernmental
                                                  potential climate-related repricing events in the short term (for example, over
Panel on Climate Change (IPCC) released
a new report on 1.5⁰C and the difference          one year) to other, more “traditional” events tested in strategic asset allocation
between that and 2⁰C to illustrate the            reviews. These market-pricing events could come from changes in views
additional impact that 0.5⁰C is expected to
have, why the Paris Agreement ambition is         relating to:
for “well below” 2⁰C and how close we are to
that window of opportunity closing. Further       –– Physical damage impact on GDP — the likelihood of physical risk
detail is provided in Appendix 2: Methodology
on the scenarios, including the logic for
applying a 2⁰C rather than 1.5⁰C scenario in      –– Scenario probabilities — a change in the likelihood of the 2⁰C
the Sequel. However, when 2⁰C is referenced          scenario occurring
as an ambition throughout, please take this
to mean “well below” 2⁰C and, ultimately,
1.5⁰C as the preferred 2100 ambition for
                                                  –– Market awareness — the extent to which climate-related impacts are “priced
the climate.                                         in” by the markets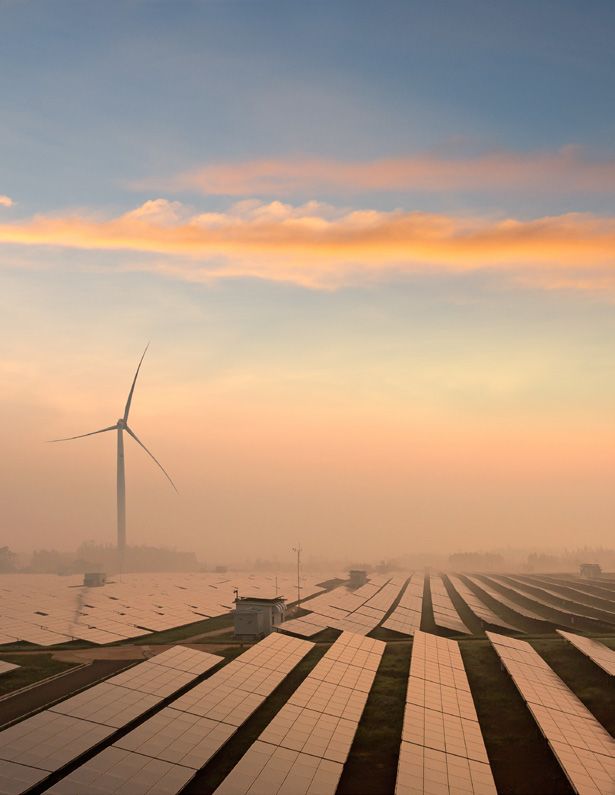
Investing in a Time of Climate Change   Executive Summary                                                                   9

                                        What Does the Sequel Modeling Tell Investors?
                                        The modeling results have evolved from the 2015 Report given there have
                                        been many environmental, scientific, political and technological developments
                                        that continue to evolve both our understanding and the climate change
                                        modeling data. However, the headline messages remain consistent, reinforce
                                        the recommendations made at that time and support greater urgency for
                                        action to achieve a well-below 2⁰C scenario. The relative impacts across asset
                                        classes and sectors convey a number of key signals for investors to consider in
                                        portfolio construction and asset allocation decisions. Stress-test modeling is
                                        also beneficial to demonstrate the potential magnitude of return impacts in the
                                        shorter term if changes in policy, market pricing or physical damages are more
                                        sudden than currently anticipated.

                                        A key conclusion is that investing for a 2⁰C scenario is both an imperative and
                                        an opportunity:

                                        • An imperative, since, for nearly all asset classes, regions and timeframes, a 2⁰C
                                          scenario leads to enhanced projected returns versus 3⁰C or 4⁰C and therefore
                                          a better outcome for investors

                                        • An opportunity, since, although incumbent industries can suffer losses in a 2⁰C
                                          scenario, there are many notable investment opportunities enabled in a low-
                                          carbon transition
Investing in a Time of Climate Change Executive Summary 10
The Sequel’s highlights include the following:ii
ii
In the Sequel, two sample asset allocations were
used to illustrate the key findings: 1) the same
diversified growth asset allocation introduced 1. The results emphasize the physical damages risks and why a below 2⁰C
in the 2015 Report and 2) a 2019 portfolio that is scenario is most beneficial, and the 4⁰C and 3⁰C scenarios are to be avoided,
equivalent to the 2015 portfolio but with explicit
allocations to sustainability-themed investments from a long-term investor perspective. In the two sample portfolios, there is
in multiple asset classes. Current limitations in a return opportunity to 2030 of between 0.10% p.a. and 0.30% p.a. in a 2°C
data and methodology available for modeling
physical damages, together with the myriad
scenario compared to -0.07% p.a. in a 4⁰C scenario. To 2100, a 4⁰C scenario
of factors not yet captured and multidecade leaves each portfolio down more than 0.10% p.a. compared to a 2⁰C scenario.
timeframes, mean the resulting magnitudes
are likely to be significantly underestimated
2. Transition opportunities emerge from a 2⁰C scenario, with transition now
and invariably relatively small in absolute
terms. The Sequel outlines more on these expected to be a benefit from a macroeconomic perspective,24 including the
additional considerations when assessing potential to capture a “low-carbon transition (LCT) premium.”25 Although
quantitative results.
a 2⁰C scenario definitely still presents transition risk (especially for
portfolios aligned to a 3⁰C or 4⁰C+ world), opportunistic investors can target
investment in the many mitigation and adaptation solutions required for a
transformative transition. In the two sample portfolios, the sustainability-
themed version is nearly 0.20% p.a. better off to 2030.
3. Expected annual return impacts remain most visible at an industry-sector
level, with significant variations by scenario, particularly for energy,
utilities, consumer staples and telecoms. Asset class returns can also vary
significantly by scenario, with infrastructure, property and equities being the
most notable. Variations in results between asset classes and across regions,
cumulative impacts, and the emphasis on sustainable opportunities provide
multiple portfolio construction possibilities for investors.
% cumulative impact % cumulative impact
Example industry sectors % p.a. to 2030 in % p.a. to 2050 in
to 2030 in 2°C to 2050 in 2°C
and asset classes 2⁰C scenario 2⁰C scenario
scenario scenario
Coal -7.1 -8.9 -58.9 -100.0*
Oil and gas -4.5 -8.9 -42.1 -95.1
Renewables +6.2 +3.3 +105.9 +177.9
Electric utilities -4.1 -3.3 -39.2 -65.7
Developed market equities 0.0 -0.2 -0.5 -5.6
Emerging market equities +0.2 -0.1 +1.8 -4.0
All world equities — sustainability themed +1.6 +0.9 +21.2 +32.0
Infrastructure +2.0 +1.0 +26.4 +39.4
Infrastructure — sustainability themed +3.0 +1.6 +42.3 +67.1
All world real estate 0.0 -0.2 -0.1 -4.7
* Effective absolute loss of value is expected to occur in 2041 under a scenario in which global warming is limited to 2°C by 2100.Investing in a Time of Climate Change Executive Summary 11
In a 2⁰C scenario by 2050, there are minor positives as well for materials,
telecoms and consumer staples sectors. In 3°C and 4°C scenarios, all
sectors, apart from renewables, have negative return impacts, to 2030, 2050
and 2100, with return impacts varying between 0.1% p.a.and 7.7% p.a.iii
Real estate is expected to be flat to 2030 under a 2°C scenario, but a 4°C
scenario, even in the near term, starts to impact negatively. A 4°C scenario
to 2050 sees infrastructure and property down 0.4% p.a. and 0.2% p.a.,
respectively, developed market equities are down 0.1% p.a. and emerging
markets are down 0.3% p.a. In a 4°C scenario, India and China equities are
down 0.4% p.a. and 0.3% p.a., respectively. Sovereign debt provides a safe
haven and marginally positive results, with fixed income continuing to remain
relatively muted overall, with some variations within the asset class.
4. In reality, sudden changes in return impacts are more likely than neat,
annual averages, so stress testing is an important tool in preparing for
this eventuality. Stress testing portfolios for changes in view on scenario
probability, market awareness and physical damage impacts can help
investors to consider how longer-term return impacts that may appear small
on an annual basis could emerge as more-meaningful shorter-term market
repricing events.
Testing an increased probability of a 2⁰C scenario with increased market
awareness can result in sector-level returns where renewables increase
by more than 100% and coal decreases by nearly 50%. Positive asset class
impacts include infrastructure at almost 23% and sustainable equity at more
than 5%. Testing an increased probability of a 2°C scenario or a 4°C scenario
with greater market awareness, even for the modeled diversified portfolios,
results in +3% to -3% return impacts in less than a year.
What’s Next for Investors? The recommended Investor Actions from the 2015 Report remain valid — to
The findings strengthen the argument incorporate climate change considerations as part of good governance
for investor action on climate change and investment decision-making — and are consistent with the 2017 TCFD
and suggest greater attention is recommendations. We include several investor case studies, which reinforce how
required on how investors will actively scenario analysis helps prioritize the portfolio risks for some and opportunities
support the transition to a 2⁰C scenario for others. The case studies also demonstrate the pace of change by peers.
— as Future Makers as opposed to
Future Takers.26 Consistent with Mercer’s thinking on the best way to incorporate ESG and
climate change considerations into the investment process, we continue to
recommend an integrated approach when setting investment beliefs, policies
and processes, and when constructing and managing portfolios, as set out in
Mercer’s Responsible Investment Pathway. This enables climate-related risks and
opportunities to be included alongside other investment considerations and for
processes and portfolios to evolve over time — grounded in agreed-upon beliefs
and policies.
iii
The strongly negative impacts reflect sectors that are required to essentially discontinue by 2050. Therefore, return would be driven more by the income
received within that time period, and this income is not allowed for in these figures.Investing in a Time of Climate Change Why Is Climate Change Important to Investors? 12
Why Is Climate
Change Important
to Investors?
Long-term investors typically have multidecade time horizons, often 50 years or
more, with exposure across the global economy. With this time horizon in mind,
it is essential to address in the short term both the potential impacts of a low-
carbon transition and physical damages associated with climate change to better
prepare portfolios for the future.
The Big Picture As an example, for a 2⁰C scenario by 2100, the expected
The world’s climate is already, on average, 1°C warmer than physical damages include30:
in preindustrial times. The vast majority of climate scientists
anticipate that with current action on climate change, • Increase in average sea level of 50 cm
by 2100, the world will be between 2⁰C and 4⁰C warmer
• Increase in annual maximum daily temperature of 2.6⁰C;
(current commitments made as part of the Paris Agreement,
25% increase in number of hot days
if implemented, put the trajectory at 3⁰C), noting that
averages mask the differences that will be felt regionally.27 • 36% increase in frequency of rainfall extremes over land
Humans have never lived in a world much warmer than today,
and experiencing such a material temperature change in less There is scientific consensus31 that greenhouse gas (GHG)
than a century will have substantial and damaging effects on emissions from human activity are being trapped in the
society and nature.28 atmosphere and creating a “greenhouse effect,” which is
causing the increase in global mean surface temperature
The recent Intergovernmental Panel on Climate Change and the consequent effects on underlying weather
(IPCC) report, which compares the expected physical patterns. Fossil-fuel use is the principal source of GHG
damages under both a 1.5⁰C and 2⁰C scenario, demonstrates emissions, primarily carbon dioxide (CO2). The second-
the impacts associated with a warming climate, even in largest contributor to GHG emissions is methane, primarily
the “best-case” scenarios.29 The scenarios modeled in the related to agricultural activities, fossil fuel production and
Sequel are outlined in Appendix 1: Sample Asset Allocations waste/landfills. Agriculture and the built environment are
and include physical damages indicators for each warming the principle drivers behind deforestation, which not only
scenario, all of which have social and economic implications. reduces CO2 absorption capacity but also is a major source
of emissions as the carbon stored in vegetation and soils is
released into the atmosphere.32
Return to Contents pageInvesting in a Time of Climate Change Why Is Climate Change Important to Investors? 13
The last time the global mean surface
temperature was comparable to today was
more than 100,000 years ago. The last time
CO2 concentrations were as high as today
(over 400 ppm) was three to four million
years ago, and the last time the world was 4⁰C
warmer was more than 10 million years ago. It is
currently possible that we could reach 4⁰C of
warming by the end of the century.33Investing in a Time of Climate Change Why Is Climate Change Important to Investors? 14
The current trajectory could put us Figure 1. Atmospheric CO2 Levels Over Time
beyond a temperature that humans
have ever experienced sometime in Now at
405+ ppm 450
the next 30 years. The last time the and rising
global mean surface temperature was Homo sapiens evolve 400
comparable to today was more than 150,000–200,000 years ago
100,000 years ago. The last time CO2 Last ice age ends
Atmospheric CO2 (ppm)
350
concentrations were as high as today 12,000 years ago —
Holocene begins
(over 400 ppm) was three to four million For 800,000 years, atmospheric CO2 has been below this line.
300
years ago, and the last time the world
was 4⁰C warmer was more than 10
million years ago. It is currently possible 250
that we could reach 4⁰C of warming by
the end of the century.33 200
The earth’s climate has experienced 150
many natural variations over millions of
years, including ice ages and periods 100
of warming with much higher sea 800,000 700,000 600,000 500,000 400,000 300,000 200,000 100,000 0
levels. Humans have flourished in the
Years ago
past 12,000 years (when the current
geological epoch, the Holocene,
Source: NASA, available at https://climate.nasa.gov/climate_resources/24/graphic-the-relentless-
began after the last glacial period rise-of-carbon-dioxide/
ended), and today’s societies reflect
Data: National Oceanic and Atmospheric Administration. Some description adapted from the Scripps
the benefits of agriculture over the CO2 Program website, “Keeling Curve Lessons.”
past 8,000 years,34 thanks in part to
the levels of CO2 in the atmosphere.
However, the scale and pace of change The Global Risk Landscape
poses serious concerns for human Dedicated global institutions were formally established in 1992 to focus on climate
adaptation given our dependency on change, and since then, awareness of the associated risks has been growing.35
the natural environment for water Acknowledgement of the risks posed by climate change among business and
and food, a growing population with government leaders is reflected in the recent World Economic Forum Global Risks
resource-intensive consumption Report,36 which displays the heightened focus on environmental and social risks
practices and the exposure of our built over time as compared to economic, geopolitical or technological risks. (Note the
environment to severe environmental higher incidence of red and green boxes in recent years in Figure 2, next page.)
damage. Changes in technology, system
design and consumption patterns will
be central to human adaptation in a
climate-changed world.Investing in a Time of Climate Change Why Is Climate Change Important to Investors? 15
Figure 2. Evolving Global Risk Landscape (2009–2019)
Top Five Global Risks in Terms of Likelihood
2009 2010 2011 2012 2013 2014 2015 2016 2017 2018 2019
1 Asset price Asset price Storms and Income Income Interstate Involuntary Extreme Extreme
Income disparity Extreme weather
collapse collapse cyclones disparity disparity conflict migration weather weather
2 Slowing Chinese Slowing Chinese Fiscal Fiscal Extreme Extreme Extreme Involuntary Natural
Climate change
Flooding mitigation and
economy economy imbalances imbalances weather weather weather migration catastrophes
adaptation failure
3 Greenhouse gas Greenhouse
Unemployment/ National Weak climate
Natural Natural
Chronic disease Chronic disease Corruption under- governance change Cyberattacks
emissions gas emissions catastrophes catastrophes
employment failures response
4 Global
Water supply Interstate Terrorist
governance Fiscal crises Biodiversity loss Cyberattacks Climate change State collapse Data fraud Data fraud
crises conflict attacks
gaps
5 Retrenchment Global
Water supply Aging High Natural
Climate change
from governance Climate change Cyberattacks Data fraud adaptation Cyberattacks
crises population unemployment catastrophes
globalization gaps failure
Top Five Global Risks in Terms of Impact
2009 2010 2011 2012 2013 2014 2015 2016 2017 2018 2019
1 Asset price Asset price Systematic Systematic
Weak climate
Fiscal crises Fiscal crises Water crises change WMDs WMDs WMDs
collapse collapse financial failure financial failure
response
2 Retrenchment Retrenchment
Water supply Water supply Infectious Extreme Extreme
Climate change
from from Climate change Climate change WMDs mitigation and
crises crises diseases weather weather
globalization globalization adaptation failure
3 Oil and gas Geopolitical Fiscal Natural Natural
Oil price spike Food crises Water crises WMDs Water crises Extreme weather
price spike conflict imbalances catastrophes catastrophes
4 Chronic Asset price
Unemployment/
Interstate Involuntary
Climate change
Chronic disease Fiscal imbalances WMDs under- Water crises adaptation Water crises
disease collapse conflict migration
employment failure
5 Extreme energy
Volatility in Weak climate Critical ICT Weak climate
Energy price
Weak climate
Natural
Fiscal crises Fiscal crises energy and agri- change systems change change Water crises
price volatility shock catastrophes
cultural prices response breakdown response response
Economic Geopolitical Technological
Environmental Societal
Source: World Economic Forum. Global Risks Report 2019.
Figure 2 outlines the top perceived risks by likelihood of Economic risks are not represented in the top five risks in
the risk occurring globally within the next 10 years and its recently published Global Risks Reports. However, another
negative impact for several countries or industries over the asset price collapse in the short term could significantly
same timeframe. Environmental risks, particularly on climate distract from the current focus on addressing environmental
change, now dominate concerns in terms of likelihood and social risks or could even be caused by such risks.
and impact. Many of the risks are also interconnected. Current debt levels are also a concern because of the
For example, survey participants believe weak climate spending potentially required on climate-related mitigation
change mitigation exposes business and government to and adaptation. The global economic context and outlook
extreme weather, natural catastrophes and water crises. remain fundamental influences for investors, and it is for
These issues, in turn, are more likely to lead to involuntary this reason that some of the foundational inputs to Mercer’s
migration and conflict. Considering the interconnectedness climate scenario modeling are economic indicators, such as
of these issues will be increasingly important in anticipating the overall view on growth, as currently measured by GDP,37
and preparing for a changing investor context. industry profitability and interest rates.Investing in a Time of Climate Change Why Is Climate Change Important to Investors? 16
Climate Change —
A Fiduciary Issue
Mercer advises a variety of investors,
including those with responsibility for
paying pensions, making endowment
and foundation grants, paying
insurance claims and providing wealth
management products. These investors
have varying objectives and portfolio
allocations and function within different
regulatory requirements and contexts.
Typically, though, they are all aiming to
deliver substantial returns to members,
beneficiaries and stakeholders over
many years and even decades. They
are true long-term investors, invested
across the global economy and
collectively managing trillions of dollars.
As the evidence grows that there are
1. Financial materiality of transition with real asset exposures, such
climate-related financial implications
and physical damages risks/ as property, directly or indirectly,
for investors, financial regulators are
opportunities: Transition risk will need to increasingly review
increasingly formalizing the expectation
consists of the technology and insurance coverage and uninsured
that investors should consider the
policy changes necessary (and to loss implications together with
materiality of these risks and manage
some extent, already underway) additional capital expenditure
them accordingly as part of their
to transform the economy away requirements. Physical damages
fiduciary duties — particularly for
from fossil fuels as the primary are also expected to negatively
pension funds.
energy source and to mitigate impact consumer
additional temperature increases. staples and telecoms, as two
Two key elements support this fiduciary
The financial implications most equity-sector examples.
duty alignment:
naturally point to the energy
sector, but transformative change The expected financial materiality
will invariably have significant of these risks is evidenced in the
implications for all energy- 2015 Report and the Sequel and
dependent and high-emitting supported in reports by The Bank
sectors of the economy. of England,38 the G20 Financial
Stability Board39 and The Economist
Physical risk captures the damages Intelligence Unit40 as well as
that come with temperature an increasing number of other
increases that we have failed to investment-industry participant
avoid. The frequency of storms, reports on recommended actions.41
wildfires and floods will shift The findings in the Sequel show
as will the availability of natural that it is in investors’ best interests
resources like food and water. and therefore consistent with
The willingness of and ability fiduciary duty to actively support
for society to adapt to these the low-carbon transition to
changes is uncertain. Investors avoid the worst physical damagesInvesting in a Time of Climate Change Why Is Climate Change Important to Investors? 17
duty to consider climate change Laws and litigation related to
risk when making their investment climate change also continue to
decisions.”43 develop.49 Litigation is primarily
being targeted at companies
The legal argument has been for failure to mitigate, adapt or
strengthened by recent pension- disclose, but there are examples
fund guidance and legislation, of litigation against governments50
particularly in Europe, which and, most recently, pension funds.51
recognizes at least the potential ClientEarth, a legal advocacy
for financial materiality and organization, has also been
requires climate change to be developing legal challenges against
considered in investment decision- pension funds and investors that
making processes, consistent with fail to consider climate-change-
the timeframes of beneficiaries; related risks.52 As signals from
for example, the 2016 EU Directive regulators become stronger and/or
on Institutions for Occupational more investors take action, those
Retirement Provision (IORP)44 that fail to consider, manage and
and the UK’s Department for disclose their potential portfolio-
Work and Pensions.45 Regulatory specific risks may be susceptible to
activity has also extended across legal challenges in the future.
the Atlantic, with the provincial
scenarios, which will have almost government in Ontario, Canada,
entirely negative impacts across requiring pensions to disclose in
sectors and asset classes. their statements of investment
policies and procedures whether
2. Growing legal and regulatory
environmental, social and
consensus that material
governance (ESG) factors are
climate-related factors must
considered and, if so, how46 and the
be considered and managed by
insurance regulator in California
fiduciaries: As awareness of the
requiring insurers to disclose their
financial materiality of climate-
fossil-fuel-related holdings.47
related factors has increased,
In a number of other countries,
financial regulators in a number
particularly in Europe, laws are
of jurisdictions have indicated
also being changed to explicitly
that many investors will need to
require investors to consider and
consider and manage climate-
disclose management of climate-
related risks in order to comply
change-related risks (for example,
with their existing fiduciary duties.
the French Energy Transition Law,
In the UK, for example, a 2018
Article 173). The China Securities
paper by law firm Pinsent Masons
and Regulatory Commission
neatly summarizes the fiduciary
issued guidelines requiring listed
duty debate in recent years
heavy polluters to give more-
given an absence of legislation
specific information on emissions,
and case law.42 However, the
with all listed firms to disclose
conclusion now is that “in cases
environmental impact information
where climate change has the
by the end of 2020.48
potential to impact on long-term
investment performance, pension
scheme trustees have a fiduciaryInvesting in a Time of Climate Change How Can Mercer’s Climate Scenario Modeling Help Investors? 18
How Can Mercer’s
Climate Scenario
Modeling Help Investors?
The Mercer climate scenario model draws on an integrated assessment model
(IAM)53 for climate change (which combines climate science and economic data)
to analyze the return outlook in investor portfolios across asset classes and
industry sectors. Three different climate scenarios provide the basis for this
analysis of sensitivities to climate risk factors, enabling investors to quantify a
forward-looking “climate impact on return.” A new aspect of the Mercer model is
the ability to “stress test” the impact of sudden changes in scenario probabilities
and market valuations in the short term or shifts in the magnitude of physical
damages in the long term.
Investors often use scenario analysis to support strategic Mercer’s climate scenario model supplements the traditional
asset allocation decisions, as they help to model risk and investor asset-allocation process, which typically relies to
return outcomes under different future scenarios and a significant extent on the use of historical data to model
identify the most resilient portfolios. the expected risk and return of different asset classes
within portfolios. Mercer’s model is based on a forward-
In addition to typical scenarios, such as extreme inflation looking approach that allows investors to consider the
or energy price spikes, investors have been aiming to effects of both the transition to a low-carbon economy and
understand how different climate scenarios could impact the anticipated physical damages of climate change. The
the performance of different asset classes, regions, sectors outputs can be used to report against the recommendations
and companies. Challenges include the limited relevance of the TCFD in the “Strategy” component of its four-part
of historical data for modeling future climate-change- framework, covered further in the Investor Actions section
related impacts and, therefore, the greater uncertainties in on page 65.
forward-looking climate change scenarios compared with
other traditional scenarios that rely on historical data.
Return to Contents pageInvesting in a Time of Climate Change How Can Mercer’s Climate Scenario Modeling Help Investors? 19
The key benefit of Mercer’s climate scenario model is that it can be applied as
2015 Report Reference Guide part of strategic decision-making in relation to asset allocation and/or portfolio
construction. This top-down, portfolio-wide scenario analysis can then be
Study Background — pages 8–10 combined with further insights from bottom-up analytical tools that assess
climate exposures of sectors and companies. For example, carbon footprinting
Investment Modeling — pages 25–58 is a bottom-up way of assessing historical carbon emissions volume/intensity
relative to benchmarks and targets and is now commonly undertaken (in equities
Appendices — pages 83–100 and fixed income).
“Part of the process of isolating risks The methodology for Mercer’s climate scenario model is outlined in brief below.
for investors is to identify the factors Further detail on the inputs behind this update — the climate models, scenarios
that signpost drivers of change.” and risk factors — are included in Appendix 2: Methodology.iv
(page 27)
Methodology — Overview
“Scenarios provide helpful guides for The Mercer climate scenario model isolates transition and physical risk factors
prioritizing actions when faced with and maps the relative impact of those risk factors under three climate scenarios.
uncertainty.” (page 8)
“As noted by the Intergovernmental
Scenarios
2⁰C
Panel on Climate Change (IPCC),
a low-carbon economy transformation most closely
the ‘warming of the climate system’
aligned with both successful implementation of the Paris
is ‘unequivocal.’ The extensive
Agreement’s ambitions and the greatest chance of lessening
uncertainties that still exist include
physical damages
just how much our current practices
will contribute to this unequivocal
3⁰C
warming by way of emissions, what some climate action but a failure both to meet the Paris
level of warming will be sustainable Agreement 2ºC objective and meaningfully alleviate
and what damages investors need anticipated physical damages
to prepare for, whatever the level of
4⁰C
warming.” (page 35)
reflecting a fragmented policy pathway where current
commitments are not implemented and there is a serious
failure to alleviate anticipated physical damages
Note there were two 4⁰C scenarios in the 2015 Report, differentiated only by
the range of physical damages. This range is now being addressed through the
stress-testing approach, which includes multiple physical damages
pathway options.
In the 2019 model, we kept the same three scenarios, but the construction
(for example, emissions trajectory/mix) was modified based on third-party
input (Cambridge Econometrics). Figure 3 on the following page illustrates the
emissions trajectory for the three Sequel scenarios.
iv
Mercer clients undertaking climate scenario modeling also have access to a Technical Addendum,
which is not public, that provides more detail on the methodology, assumptions and modeling
decisions.Investing in a Time of Climate Change How Can Mercer’s Climate Scenario Modeling Help Investors? 20
Figure 3. Emissions Pathways for Climate Scenarios
Annual GtCO2 Emissions
Cumulative Carbon Emissions
(fossil fuel and industrial only)
(2018–2100)
85
Scenario GtCO2
75
Sequel 2⁰C 1,100
65
Sequel 3⁰C 3,500
55
Sequel 4⁰C 5,100
45
Global carbon law 650
35
Emissions in the last decade: 350 GtCO2
25
Emissions in 2010: 49 GtCO2eq.
15
NOTE: The CO2 emissions shown on the
5 graph and above do not include land-use-
related emissions, which are currently
15 about five GtCO2 annually, which must
2000 2010 2020 2030 2040 2050 2060 2070 2080 2090 2100 also reach net-zero or below, nor does it
include the CO2 equivalent of other GHGs.
Sequel 2ºC Sequel 3ºC Sequel 4ºC Cambridge Econometrics did not model
land-use CO2 emissions and other GHG
Carbon law Actual emissions.
Source: Mercer
The longer policymakers, companies and investors delay, the global carbon law,54 which would see emissions peaking
either a) the less likely we will stay below the 2°C target or in 2020 and halving every decade thereafter. The “carbon
b) the more rapid the transition to a low-carbon economy law” concept is based on Moore’s Law in the computer
and, ultimately, a zero-carbon economy will need to be. industry, applied to cities, nations and industrial sectors
Sudden changes are more likely to be disruptive than an that would ensure the greatest efforts to reduce emissions
“orderly” transition. A delayed “catch up” to achieve a happen sooner not later and reduces the risk of exceeding
carbon budget would also require the removal of carbon the remaining global carbon budget to stay well below 2⁰C.
from the atmosphere, which would require significant areas
of land and water to implement afforestation (new forests), Risk Factors
reforestation (replacement forests), and carbon capture The climate risk factors identified in the 2015 Report were
and storage (CCS), which requires technologies/processes deemed to be the most climate-change-specific factors
that have not yet been fully commercialized. relevant for investors. This approach was reinforced by the
TCFD recommendations in 2017 that also emphasized the
The Sequel 2⁰C scenario represents a 50% chance of differential nature of transition and physical damages risks.
staying below 2⁰C. Given the physical risks associated with
warming above 2⁰C, this is not the preferred target. To have
a 66% chance of staying below 2⁰C, emissions would have to
decline more rapidly; for example, in a trajectory known asInvesting in a Time of Climate Change How Can Mercer’s Climate Scenario Modeling Help Investors? 21
Figure 4. Climate Change Risk Factors Over Time
The Investor Zone The Climate Zone
2019 2050 2100
Risk Factors
Transition Physical Damages
Spending — Investment Impact of Natural Catastrophes
Technology and Policy Availability of Natural Resources
Scenarios
2⁰C Outside of human experience and meaningful physical damages
1⁰C+ 3⁰C Not seen for three million years, highly disruptive physical damages
4⁰C Not seen for tens of millions of years, severe physical damages
Source: Mercer
Note: The world’s climate is already, on average, 1°C warmer than in preindustrial times. The Mercer scenarios of 2°C, 3°C and 4°C represent total warming by
2100 relative to preindustrial times.
Figure 4 compares the timeframe of a STIR Risk Factors 3. Impact of natural catastrophes:
typical investor with the timeframe of 1. Spending: rate of investment physical damages due to acute
this study and the horizon of climate spending to catalyze the transition weather incidence/severity — for
change impacts. The “STIR” risk factors example, extreme or catastrophic
for the Sequel are founded in the 2. Transition: development of events
2015 “TRIP” factors, with an evolved technology and low-carbon
approach to the transition. solutions and the international, 4. Resource availability: long-term
national and subnational policy weather pattern changes — for
targets, legislation and regulations example, in temperature or
aiming to reduce the risk of further precipitation — impacting the
human-induced climate change availability of natural resources
like waterInvesting in a Time of Climate Change How Can Mercer’s Climate Scenario Modeling Help Investors? 22
In the final 2019 modeling, the policy and technology interactions were captured
as a single transition risk factor, with different asset sensitivities in a 2⁰C and
a 3⁰C scenario. This is an important distinction, because sectors will respond
differently to alternate policy pathways (for example, the extent to which coal is
replaced and/or the role of gas as a transition fuel). A key difference between the
2⁰C and 3⁰C scenarios is captured as spending, the “S” risk factor, highlighting the
impact of public and private spending to catalyze the transition and the positive
investment implication in the near term under a 2⁰C scenario.
The relative overall cumulative impact on global GDP for each scenario for each
risk factor is shown below, with S = spending, T= transition (2⁰C and 3⁰C versions —
T2 and T3), I = impact of natural catastrophes and R= resource availability.
Figure 5. Risk Factor Pathways — Cumulative GDP Impacts by Scenario
2ºC 3ºC 4ºC
2064
2069
2099
2064
2069
2099
2064
2069
2099
2054
2054
2054
2049
2059
2049
2059
2049
2059
2039
2044
2039
2044
2039
2044
2034
2084
2094
2034
2084
2094
2034
2084
2094
2089
2089
2089
2024
2029
2024
2029
2024
2029
2079
2079
2079
2074
2074
2074
2019
2019
2019
2.5% 2.5% 2.5%
0.0% 0.0% 0.0%
-2.5% -2.5% -2.5%
-5.0% -5.0% -5.0%
-7.5% -7.5% -7.5%
-10.0% -10.0% -10.0%
-12.5% -12.5% -12.5%
S T I R
Source: Mercer
More detail is provided on the scenarios in Appendix 2: Methodology on
pages 76-83.
Calculating the Climate Impact on Return
The diagram on page 24 summarizes how the various inputs fit together. The
IAM forms the foundation for the work, along with a qualitative literature
review, which, in turn, informs the magnitude of physical damages risk in the
macroeconomic modeling. The IAM is used to develop the scenario pathways and
the climate risk factor sensitivities that are the two key inputs to the Mercer
climate scenario model. The relative impacts of each input and their interaction
enables the additional climate impact on return to be calculated.Investing in a Time of Climate Change How Can Mercer’s Climate Scenario Modeling Help Investors? 23
The longer policymakers, companies and investors
delay, either a) the less likely we will stay below the
2⁰C target or b) the more rapid the transition to a
low-carbon economy and, ultimately, a zero-carbon
economy will need to be.Investing in a Time of Climate Change How Can Mercer’s Climate Scenario Modeling Help Investors? 24
Figure 6. Illustrative Approach for Modeling the Investment Impacts of Climate Change
Portfolio
Implementation
Identifying areas of risk
and opportunity
4 Portfolio Implications
3 Asset Sensitivity
2 Risk Factors and Scenarios
1 Climate Change Modeling and Literature Review
Climate Change Modeling Risk Factors and Asset Portfolio
and Literature Review Scenarios Sensitivity Implications
The modeling foundations Three climate change scenarios The sensitivity to the climate The sensitivity and scenarios
are provided by a third-party provide a framework for the change risk factors is are integrated into Mercer’s
macroeconomic model, E3ME, relative impacts for identified determined for different asset investment modeling tool
which draws upon the “GENIE” climate change risk factors classes and industry sectors. to estimate the impact of
integrated assessment model over time. climate change on investment
(IAM). IAMs combine climate portfolio returns.
science and economic data
to estimate the costs of
mitigation, adaptation and
physical damages.
Source: MercerInvesting in a Time of Climate Change How Can Mercer’s Climate Scenario Modeling Help Investors? 25
The scenarios modeled are deterministic,
which is necessary given the gaps in scientific
research and our current understanding of
climate change (not to mention the complexity
of conducting investment analysis 80 years
into the future). However, the interactions are
likely to be much more complex than we can
ever model.Investing in a Time of Climate Change How Can Mercer’s Climate Scenario Modeling Help Investors? 26 The two modeling approaches on the following page are used to calculate climate impact on return.
Investing in a Time of Climate Change          How Can Mercer’s Climate Scenario Modeling Help Investors?                                     27

Modeling Approach 1:                           Portfolio implications are generated by calculating the average annual climate
Long-Term Return                               impact on return for different asset classes and industry sectors across the
Impact Analysis                                three scenarios over different time periods (for example, over 10 years, to 2050
                                               and to 2100).

Figure 7. Annual Return Impact Analysis Inputs and Outputs

                                                     Annual Return Impacts

            Scenario Pathways                                Asset Sensitivity                               Annual Return Impacts

  • How will each risk factor change              • How sensitive is each sector and                  • How are different sectors or asset
    over time for each scenario?                    asset class to each risk factor on a                classes impacted on an annual,
  • A quantitative pathway is developed
    for each risk factor and scenario.
                                           x        relative basis?
                                                                                              =         average basis over multi-year time
                                                                                                        periods?
                                                                                                      • What are the risk and opportunity
                                                                                                        priorities?

Source: Mercer

Modeling Approach 2:                           Many clients requested that we consider how longer-term return impacts could
Short-Term Stress-Testing                      manifest as shorter-term climate-related market repricing events (for example,
Analysis                                       reflecting short-term changes in how the market prices climate change risks
                                               and opportunities, including changing views on the probabilities of different
                                               climate scenarios).

                                               As a result, we have developed a climate stress-testing addition to the model,
                                               which immediately capitalizes expected future impacts in present-value terms
                                               using a dividend discount modeling (DDM) approach, driven by a change in view on
                                               scenario probabilities, market awareness and/or physical damages.

Figure 8. Stress Test Inputs and Outputs

                                                             Stress Tests

      Scenario Probability Change                        Market Pricing Change                              Capitalized Pricing Event

  • What might the probability be for             • How likely is it that the market                  • This describes the percentage
    changes in either transition risk or            has the same view or is under- or                   impact on valuation if market
    physical damages risks becoming
    more likely?                           x        overpricing?
                                                                                              =         pricing changed to a) account for
                                                                                                        a different view on the more likely
                                                                                                        climate scenario and b) account
                                                                                                        for climate change to a different
                                                                                                        extent.

Source: Mercer
Investing in a Time of Climate Change How Can Mercer’s Climate Scenario Modeling Help Investors? 28
Quantitative Models — Mercer continues to believe that climate scenario
A Cautionary Note modeling for assessing the potential investment
impacts of climate change is a valuable exercise,
notwithstanding the shortcomings mentioned below.
However, quantitative modeling in itself is limited
when assessing climate-related risk and opportunity
and requires qualitative judgment to also be applied,
along with stress testing. As with other forms of
investment modeling, the climate scenario modeling
featured in this report is subject to uncertainty
introduced at several levels, including a) the overall
construct of our modeling approach, b) the specific
assumptions made and c) the time horizon over
which the analysis is performed. The approach and
assumptions are all documented in more detail in
a Technical Addendum made available for Mercer
clients undertaking comprehensive climate
scenario modeling.Investing in a Time of Climate Change How Can Mercer’s Climate Scenario Modeling Help Investors? 29
Forecasting is notoriously difficult: As former US Federal Reserve Chair Alan
Greenspan reflected in 2013 when looking back on the financial crisis, “The whole
period upset my view of how the world worked — the models failed at a time when
we needed them most … and the failure was uniform.”
Although we typically focus on what is modeled, it is just as important to
recognize what is not modeled. The points below are intended to highlight known
shortcomings in climate scenario modeling, both in the IAMs and in economic
modeling generally, to encourage additional discussions in decision-making.
In summary, know the limitations regarding the current data and methodology
available for climate scenario modeling:
• The magnitude of results — particularly related to physical damages — is
likely underestimated.
• When you combine the above with multidecade timeframes, the annual
investment impacts are invariably relatively small in absolute terms. Focusing on
the relativities rather than the actual magnitude will thus be more-informative.
• The scenarios we have used reflect a single pathway for each factor and
temperature outcome, when the range of potential pathways is actually quite
broad, especially later in the century.
• Similarly, we have used each scenario to modify the expected (mean) return
impact on asset classes and portfolios. For want of available probabilistic data
on the range of potential temperature and economic outcomes, the impact
of climate on asset class and portfolio risk (for example, in terms of standard
deviation or credit value at risk [CVAR] of returns) has not been estimated,
though this could be significant.Investing in a Time of Climate Change How Can Mercer’s Climate Scenario Modeling Help Investors? 30
The additional points below are Costs of Adaptation and Planned Resilience
To date, the focus has been on mitigation actions, but,
intended to highlight known increasingly, adaptation activities are becoming a reality.
shortcomings in climate scenario Planning to ensure resilience with manageable adaptation
modeling, both in the IAMs and in costs is already underway, yet the IAMs generally assume
adaptation costs come later and outside the typical investor
economic modeling generally, to timeframe.
encourage additional discussions in
decision-making. Economic Damages Simplified Into GDP
IAMs generally capture economic damages by focusing on
impacts to GDP. The flaws in GDP as a simplistic measure of
Physical Impacts of Climate Change
economic growth and progress are widely discussed in the
Top down, economy-wide damage functions, which are
financial community, with all economic activity, “positive”
most often used to estimate the long-term physical
and “negative” to society, being captured as one figure and
impacts of climate change, arguably grossly underestimate
therefore masking impacts experienced in reality. It also
the speed/magnitude of physical damages given the way
ignores human well-being, unpaid contributions to society
models tend to treat uncertainty, narrowing down wide
(for example, caregiving), income/wealth distribution and the
dispersions and “tail risks” to a more-central thesis, where
negative impact of economic growth on the environment.57
scientific consensus can be reached. IPCC reports on the
physical damages typically exclude the high-uncertainty
And then there are the social factors, which are typically
“feedback loops” that can create climate tipping points,
difficult to quantify but could exacerbate currently modeled
such as permafrost melting and releasing methane.55 For
climate change implications:
the Mercer model, in 2019, a bottom-up approach was
taken to supplement existing top-down physical impact
estimates. Although a bottom-up approach carries benefits The impact on population and workforce health — Regional
(for example, transparency into the peril/region-specific capacity and ability to adapt to changing weather patterns
drivers of damage), it also carries drawbacks (for example, and healthcare needs are key. Many infectious diseases
very few peril-specific damage functions exist with global are highly sensitive to climate conditions. Climate change
consistency, meaning any bottom-up approach is likely to also extends the transmission seasons and expands the
have gaps; also, more research would be needed into the geographical extent of many diseases, like malaria and
interactions between perils to avoid double counting). dengue fever. Climate change could also create greater heat
stress, making working conditions unbearable in a number
of regions.58
Financial Stability and Insurance “Breakdown”
Estimating physical damage impacts is very important for
Migration — Situations caused or heightened by energy,
insurers, and insurance is a central feature of our global
food or water shortages lead to accompanying social and
economy. Regulators responsible for financial stability are
economic impacts and potential political implications or
increasingly raising the alarm that there could be systemic
conflicts. The UN Global Compact for Migration, which was
failure of the financial system without addressing climate
adopted by more than 160 countries in December 2018,
change, with a 4⁰C world described by one of the world’s
specifically references climate change as an underlying risk
leading insurers as “uninsurable,”56 but this is not yet
of forced and unsafe migration.59
captured in the IAMs.You can also read