Occasional Paper Monitoring of insurance premiums in the world of big data June 2018 - NSW Government
←
→
Page content transcription
If your browser does not render page correctly, please read the page content below

Occasional Paper Monitoring of insurance premiums in the world of big data June 2018
Preamble
The way in which insurance is priced is changing. Currently, insurers develop a technical premium price by
predicting the probability that an individual (or group of similar individuals) will suffer a loss and the size of that
loss; this technical price is then overlaid with marketing considerations.

This conventional approach, however, is giving way to more advanced analytics involving the use of complex
machine-driven algorithms, referred to as ‘big data’ analytics. Insurers can use big data analytics to more finely
tune individual risk classification, by finding new or unexpected correlations about individuals and the risk they
represent. Greater use of big data analytics therefore has the potential to change the relationship between price
and coverage, making it more challenging for insurance consumers to understand the basis upon which their
insurance is priced, and possibly raising the market power of insurers. Pricing in this way may even result in
insurance being inaccessible to certain individuals or groups because of their risk status, when such individuals
are arguably those most in need of the protection that insurance offers.

The use of big data in insurance was briefly discussed in the May 2017 Public Inquiry held by the Emergency
Services Levy Insurance Monitor (Insurance Monitor). In this paper, we explore the issues surrounding big data
in insurance in more detail, and summarise the main issues that may arise in NSW from general insurance
companies’ development and use of ‘big data’ techniques during the emergency services levy (ESL) reforms. We
also explore potential implications for companies, consumers, policy makers and regulators.

This paper is based in part on research conducted for the Insurance Monitor by PIRAC Economics.

We invite stakeholder input on any of the matters raised in this paper. Please send input to:

Big Data Project Team
Emergency Services Levy Insurance Monitor
Email: consultation@eslinsurancemonitor.nsw.gov.au

Published by

Emergency Services Levy Insurance Monitor
One Margaret Street, Sydney, NSW 2000.
www.eslinsurancemonitor.nsw.gov.au

© State of New South Wales, 2018

Monitoring of insurance premiums in the world of big data | June 2018                                          Page 2

Table of contents
Executive summary ....................................................................................................... 4
      Big data – what is it and why is it important? ................................................................................................. 4
      Practical implications ..................................................................................................................................... 4
      Potential challenges ....................................................................................................................................... 5
      Implications for the Insurance Monitor ........................................................................................................... 6

1. Background ............................................................................................................. 8
1.1   Role of the Insurance Monitor ........................................................................................................................ 8
1.2   Technology trends in insurance ..................................................................................................................... 9
1.3   What is big data? ......................................................................................................................................... 10

2. The power of big data ............................................................................................ 14
2.1   A variety of uses across industries .............................................................................................................. 14
2.2   Case studies ................................................................................................................................................ 15
      Case study 1: Retail Loyalty Cards - Woolworths........................................................................................ 15
      Case study 2: Facebook Disaster Maps, Social Media ............................................................................... 16

3. Big data in insurance ............................................................................................. 19
3.1   Adoption trajectory ....................................................................................................................................... 19
3.2   Implications for insurance services .............................................................................................................. 21
3.3   Impact on products and service ................................................................................................................... 22
      Product design ............................................................................................................................................. 23
      Application and renewal processes ............................................................................................................. 25
      Marketing ..................................................................................................................................................... 25
      Claims processes ......................................................................................................................................... 26
3.4   Fraud control ................................................................................................................................................ 27
3.5   Impact on risk assessment and pricing........................................................................................................ 29

4. Implications for regulation...................................................................................... 34
4.1   Consumer protection concerns .................................................................................................................... 34
      Data security, privacy and responsible use of data ..................................................................................... 34
      Discriminatory pricing practices and access to insurance ........................................................................... 36
      Product suitability and unfair practices ........................................................................................................ 37
4.2   Possible effects on competition ................................................................................................................... 38
      Information asymmetries, consumer participation and choice..................................................................... 38
      Price optimisation ......................................................................................................................................... 39
      Insurers capturing the consumer surplus ..................................................................................................... 40
      Feasibility to price discriminate .................................................................................................................... 41
      Increasing significance of price discrimination............................................................................................. 43

5. Implications for the Insurance Monitor .................................................................. 46
5.1   Price monitoring functions............................................................................................................................ 46
5.2   Insurance take up ........................................................................................................................................ 46
5.3   The price exploitation prohibition ................................................................................................................. 47

References .................................................................................................................. 49

Monitoring of insurance premiums in the world of big data | June 2018                                                                                        Page 3
Executive summary
This paper explores the issues surrounding big data in general insurance that may arise in NSW from general
insurance companies’ access to and use of ‘big data’ techniques during the emergency services levy (ESL)
reforms and some potential implications.
Big data – what is it and why is it important?
‘Big data’ is a term that describes large volumes of high velocity, complex and variable data that require advanced
techniques and technologies to enable the capture, storage, distribution, management, and analysis of the
information.1 When companies use big data, they adopt technology and data processing techniques to collect
large datasets from both conventional and unconventional sources, and analyse those data to inform their
business decisions and activities. The growing use of big data in many industries is part of a broader uptake in
big data use and data analytics and partly enabled by trends towards more interconnected devices (the internet
of things).
In financial services, changes in technology and customer expectations are driving innovation in new technology-
based services and the take-up of those services by companies is growing rapidly worldwide. Globally, in 2017,
it is estimated that twenty four percent of digitally active consumers regularly used insurance products that
incorporated financial technology (including big data), a four-fold increase from 8 percent in 2015.2
In Australia, implementation of big data techniques has lagged the UK and USA experience3 but this is changing
rapidly. A recent survey of 30 Australian and New Zealand insurers found nearly 30 per cent of respondents
expected to implement big data initiatives within 6 months, with 85 per cent having implementation timeframe
targets of two years or less4. International financial services and FinTech (financial technology) executives
consider that the most likely and important areas of technological development in insurance are:
increased sophistication of data models and analytics to better identify and quantify risk
increased sophistication in methods to reach, engage and serve customers in a highly targeted manner
rise of aggregators to compare products and services from different providers.5
All these areas rely on big data. Overall, access to big data is likely to have a transformative effect across the
insurance lifecycle, affecting how insurance products are designed and marketed, how claims are assessed and
paid, and how risk is assessed and managed.
Practical implications
The practical implications and impacts of big data techniques being used by insurance companies can include
the following:
Products and services may become more customised. Big data-based products potentially reduce risk, the
likelihood of a claim and costs for the insurer and the customer.
Simplification and automation of application and renewal processes.
Data analytics can support tools for insurance comparison and selection.
Targeted marketing using external data sources to identify customers’ needs and circumstances, including
their interest in or need for updating or changing their insurance.
1
TechAmerica 2012, p.10
2
EY 2017, p.14
3
See for example, FCA 2016a; and Willis Towers Watson, 2016
4
Finity, 2018
5
PWC 2017, p.10
Monitoring of insurance premiums in the world of big data | June 2018 Page 4
Big data can help better equip front line staff with information to improve customer service or can assist in
tailoring individual products to meet requirements.6
Claims process improvements, as big data can make claims processes quicker and easier, assist identify
legitimate claims and respond in real-time.7 For example, telematics can improve customer service after a
collision.8
Risk management: big data provides new sources of information that create opportunities for a more granular
risk assessment, to the individual level; and may improve forward-looking data and deliver better customer
information.
More effective fraud control, which reduces the cost of assessing and paying illegitimate claims leading to
reduced premiums, and allows legitimate claims to be processed more quickly.9 The prospects for
improvement are significant. Estimates of insurance fraud place the costs at: in the UK, up to £50 per year
per policy holder and the country more than £3 billion”,10 and in the US up to US$34 billion for property and
casualty insurance, or as increasing premiums by 3 to 5 percent.11 A crime syndicate stopped by the NSW
Police was responsible for AUD$1 million in fraudulent claims.12 Big data helped detect organised,
premeditated fraud in Canada13 and the UK14 by detecting networks between seemingly unrelated people.15
Potential challenges
Changes as extensive as those offered by big data, bring both challenges and opportunities. Many of these are
positive, as the previous section illustrates. However, there may also be potential risks for consumers. These
may include:
Data protection, privacy and security of consumers personal information. Information about the behaviour of
individuals and their personal data is being collected by businesses everyday as people browse the internet,
use apps, do online shopping, network through social media and install ‘smart’ devices in their homes, to
name a few. Some businesses analyse this information internally whilst others may collect and sell the data.
A major issue for insureds is that it may be difficult to control and understand how data on their social and
commercial behaviour is accessed by insurers and used in complex algorithms to assess risk. It is possible
that data that is collected for one purpose may end up being used for other purposes without the knowledge
of the individual. Insurers may also be unwilling to share data, making it more difficult for customers to switch
insurers. Measures suggested by commentators to mitigate concerns include information sharing obligations,
such as those being implemented for financial services more broadly (‘Open banking’).16 Given the important
role of insurance in protecting consumers’ most valuable assets, Consumer Data Rights in general insurance
may be an area for further inquiry.
Concerns with more granular risk assessment. As noted by the Actuaries Institute, when each individual’s
risk is assessed more accurately, fewer people will be treated as average.17 This has the potential to modify
the extent of “risk pooling” across the community, a notion which has traditionally underpinned insurance
pricing. Possible consequences include: some people being more accurately identified as being of low risk
and being able to access cheaper insurance, whilst others will be assessed as higher risk and charged more
for insurance, regardless of the social context in which some of these risks might arise. Where these people
are vulnerable or disadvantaged and cannot change their behaviour to reduce their risk, they may find it
6
MongoDB 2018
7
WNS DecisionPoint 2016, p.20; Exastax 2017
8
QBE 2018; EY 2016a, p.4
9
FCA 2016a, p.33
10
HM Treasury 2016, p.3
11
WNS DecisionPoint 2016, p.1, 7
12
Kidd 2017
13
CANATICS 2017
14
HM Treasury 2016, p.43
15
WNS DecisionPoint 2016, p.17
16
FCA 2016a, p.18
17
Actuaries institute 2016, p.4
Monitoring of insurance premiums in the world of big data | June 2018 Page 5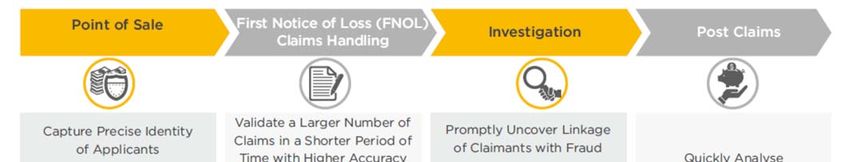
increasingly difficult to access or afford insurance.18 There are markets, such as those in Northern Australia,
where access to property insurance is of real and continuing concern.
Discrimination based on factors other than risk and costs. There may be greater challenges for protecting
consumers against business practices that rely on unreasonable use of data and adversely impact
disadvantaged or vulnerable consumers. Marketing practices may encourage consumers to buy products
they do not want or need.
Competitive implications, as the use of big data could change the competitive dynamics between insurance
companies as well as exacerbate the problems associated with information asymmetry between insurers and
their customers. This may further constrain consumers from fully participating in the insurance market and
ultimately reduce the effectiveness of competition in the market.
The trade-offs associated with data-driven techniques can leave policymakers with a dilemma. Whereas big data
has the potential to lower the cost of insurance for many insureds due to individualised risk assessment and could
empower consumers by facilitating easier comparison of competing insurance products, it also confers on insurers
greater opportunities for ‘price discrimination’ in product marketing and distribution strategies including individual
price discrimination, sometimes referred to as ‘price optimisation’. Price discrimination may enable insurers to
increase their profitability by extracting more consumer surplus.
Implications for the Insurance Monitor
Big data will potentially have a significant impact on insurance company operations and pricing. It will impact the
Insurance Monitor’s price monitoring role, the assessment of the impacts of ESL reforms on the take up of
insurance and the analysis of prohibited conduct.
The legislative provision and criteria in the Insurance Monitor’s Guidelines on the prohibition against price
exploitation issued in December 2017 are relevant to any pricing changes affecting regulated contracts of
insurance associated with the greater use of big data. Discerning the impact of ESL reform on the take-up of
insurance may also become more complex.
.
18
An FCA study of big data in insurance noted that, to date, there is no evidence that big data has resulted an increase in price dispersion across motor and
home insurance, or affected the availability of quotes for vulnerable consumers (such as people over 85 or with disabilities). Nevertheless, the Authority noted
that it would continue to monitor the potential exclusion of high risk consumers, would look at the pricing practices of a limited number of firms and would engage
with the UK government about possible responses if problems were identified.
Monitoring of insurance premiums in the world of big data | June 2018 Page 6
Monitoring of insurance premiums in the world of big data | June 2018 Page 7

1. Background
This section of the paper provides background to big data and to this information paper, including the role of the
Insurance Monitor, information on major trends in technology adoption by the financial services industry globally
and the general insurance industry in NSW, and some concepts illustrating what is meant by ‘big data’.
1.1 Role of the Insurance Monitor
The NSW Emergency Services Levy (ESL) Insurance Monitor (“Insurance Monitor”) has an important role in over-
sighting the conduct and pricing practices of insurance companies who charge ESL on insurance premiums during
the period to 30 June 2020.
Insurance companies are required to make contributions to fund the activities of the NSW fire and emergency
authorities. Many insurers pass on the cost of these contributions to their policyholders by charging an ESL on
certain types of insurance policies covering damage or loss to properties in NSW. The NSW Government had
previously proposed to replace this arrangement with a property-based levy to be paid through Council rates.
However, this reform was deferred in May 2017. At the time the deferral was announced, insurers had been
gradually reducing the ESL they charged on insurance premiums. It has been necessary for insurance companies
to re-establish ESL on insurance premiums, which has largely occurred from July to October 2017.
The Insurance Monitor was appointed to provide the public with confidence that insurers will not use the ESL
reform as an opportunity to raise premiums without reference to costs. This role was established in a context of
widespread distrust of insurers in NSW attempting to profit from the reform at the expense of their customers, and
of a need to ensure the overall fairness of the reform. The Insurance Monitor’s key functions include:
providing information, advice and guidance in relation to the ESL reform and prohibited conduct
ensuring that insurers do not collect more ESL than is necessary to fund their contribution liabilities, through
an over-collection assessment for the financial years ended 30 June 2016 and 2017 combined, as well as the
financial years ending 30 June 2018 and 2019 combined
scrutinising price movements in insurance products subject to the ESL regime (price monitoring) in relation
to the impact of the reforms on the insurance industry and levels of insurance coverage and in relation to
prohibited conduct and compliance with the Act, to ensure that consumers are adequately protected
taking action in relation to prohibited conduct, being price exploitation or false or misleading conduct in relation
to the ESL. Penalties of up to $10 million may be ordered by the Court for breaches of these prohibitions.19
These functions have remained largely unchanged despite the deferral of the property-based levy.
Prohibitions against price exploitation and false or misleading conduct have been enacted during times of
significant regulatory change in an economy or a market that may provide opportunity (or perceived propensity)
for companies to disadvantage consumers. Examples include the implementation of a New Tax System (the
GST) in 2000 and the 2013 replacement of the insurance-based fire services levy in Victoria. The economic case
for monitoring rests essentially on weaknesses in competition in the industry, which arise because of limited
substitutability between suppliers, but also because of information asymmetry and behavioural biases affecting
consumers. As a result of these weaknesses, it is considered that the performance of general insurance markets
falls short of what would be consistent with workable competition.20
The case for monitoring the reimposition of ESL is if as strong as that associated with the removal of ESL. There
is a need to address potential consumer confusion or concerns around the fairness of how ESL rates are imposed
19
ESLIM 2017a
20
For example, see Senate Economics References Committee, 2017, p.25
Monitoring of insurance premiums in the world of big data | June 2018 Page 8
between policyholders, as well as changes in premiums for renewals occurring in the 2017-18 financial year.
There is concern that base premiums could be increased excessively coincidentally with the reimposition of ESL.
There is also a risk that some insurers could try to take advantage of the situation and blame premium increases
on the deferral of the emergency services levy reform.
To undertake effective monitoring, the Insurance Monitor needs to understand the context in which the insurance
industry operates, how insurance is priced, and how that context is changing. Technology trends in insurance
have the potential to materially change the operational and competitive landscape in NSW and affect prices,
hence this is an area which the Insurance Monitor maintains an interest.
1.2 Technology trends in insurance
Like other areas of financial services, insurance markets are affected by changing technologies and customer
expectations. Commentators point to a range of trends, including more self-directed services, usage-based
insurance, combining insurance with risk reduction services, faster claims services, and more individualised
products and services.21 The technologies that are expected to deliver these changes include cloud computing,
digitalisation, artificial intelligence and big data analytics.22
This paper focusses on big data. In 2017, PWC estimated (based on a DeNovo survey) that the three most
important and likely trends in insurance were:
increased sophistication of data models and analytics to better identify and quantify risk
increased sophistication in methods to reach, engage and serve customers in a highly-targeted manner
rise of aggregators to compare products and services from different providers.23
All these trends rely on big data.
Internationally and domestically, government policy and regulation are also changing to make it easier for
individuals and businesses to access and control their financial services data. Australia, Japan, the EU, and the
UK, for example, are passing laws that require banks to cooperate with approved third-parties to, at customers’
request, allow access to the banks’ systems to draw on customers’ data. These initiatives are expected to
stimulate innovation in data analysis and use.
These policies, combined with other policies and technology changes, are predicted to have a significant impact
on the delivery of financial services (box 1). Data analysis and use in insurance is therefore likely to be affected,
as financial technology companies with expertise in financial data analytics and use start to look for new business
opportunities.24
Box 1: Innovation in financial services
Aggregators or ‘Personal Financial Management’ services help people manage their money, bringing
together payment accounts and other products like mortgages, pensions and investments ‘under one roof’.
These services could be provided by an array of providers from established banks to charities. Similarly,
accounting software companies will operate as aggregators helping businesses in the same way.
21
PWC 2016, p.14-15; KPMG 2017a, p.31; KPMG 2017b, p.15; Tanguy et al 2017
22
KPMG 2017b, p.15; Reynolds 2017, p.7
23
PWC 2017, p.10
24
IAIS 2017, p.4
Monitoring of insurance premiums in the world of big data | June 2018 Page 9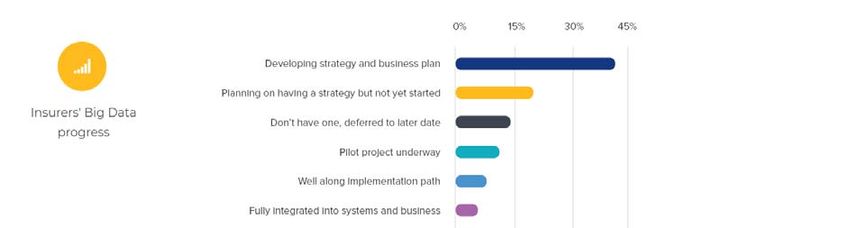
Digital comparison tools will enable much easier assessment of complex product pricing, especially as banks
      are required to provide their data in a more standardised way and provide new information about their quality
      of service.

      Combined, digital comparison tools and personal financial management (PFM) tools will be able to alert
      customers to business models that require customers to actively switch to get the better rate. They can more
      effectively help people avoid charges or switch provider.

      Payment Initiators will compete with card payments potentially offering cheaper alternatives for online SMEs
      to collect payments. In due course, they may even develop payment facilities face to face using direct bank
      transfer.

      Taken together consumer experts recognised that these tools had the potential to disrupt the way consumers
      interact with their finances and financial providers. One outcome could be that traditional banks could give
      way to new aggregators or payment initiators.

Source: Reynolds, F, 2017, Open Banking: A Consumer Perspective, p.8

This paper reviews international and Australian commentary and describes how the use of big data is expected
to affect insurance services, insurance markets and the interaction between insurance providers and customers,
and the potential implications of these changes for the Insurance Monitor.

1.3 What is big data?
Big data is more than just large data sets of information. In isolation, mountains of data are valueless. Data must
be effectively collected, stored and analysed. Growth in big data is only useful to businesses because of the
concurrent growth in affordable big data management, analytics and storage capacity.

The rise of related FinTech (financial technology) innovations has led to the development of an array of data
applications capable of handling the volume of data required for big data analysis. This analysis can look at
representative cross-sections of consumers and reveal trends and patterns that otherwise would not be visible.
However, it is likely to be an incremental and evolutionary process25.

The three “V”s of big data - volume, velocity and variety - are commonly used as a starting point from which to
understand big data. IBM adds a fourth “V”, veracity, as illustrated in figure 1. Others have argued that value is
also important.26

25
     FCA 2015, p.5
26
     Marr 2015

 Monitoring of insurance premiums in the world of big data | June 2018                                      Page 10
Figure 1-1: IBM’s Four Vs of Big Data Source: http://www.ibmbigdatahub.com/infographic/four-vs-big-data Monitoring of insurance premiums in the world of big data | June 2018 Page 11
Volume – the most obvious characteristic of big data is very large data sets. International Data Corporation
forecasts that by 2025, global data will have risen from 16.1 zettabytes (ZB, trillion gigabytes) to 163 ZB, of which
a quarter will be generated and accessible in real time.27 The social media company, Facebook, for example,
increased data storage size three-fold in 2013-2014, and it estimated that rate of growth has continued.28
Facebook users increased from 100 million in 2008 to 2.07 billion in the second quarter of 2017.29

Velocity – refers to the rate that data is being produced, recorded and analysed. Big Data is generated in
everyday life. It includes point of sale data when a product is purchase, social media data, travel data, for
example. Therefore, people generate big data-relevant information nearly constantly, and technology is now
developing to the point where this information can be recorded in real time. The rise and growth in smartphones,
wearables30 and sensors has led to rapid growth in the volume of data generated.31

Variety – data is drawn from a wide range of sources, in both structured and unstructured forms (for example,
videos, emails, social media posts, credit card purchases, clickstream data, security cameras, loyalty card
tracking, sensor data and policy and account documentation). Some of these can be collected from within a
company, and some from outside. The heterogeneity of the data is one of the challenges of big data analysis. It
has been estimated that structured data, found in tabular form or relational databases, represents between 5 to
15 percent of overall data, while unstructured data, for example, e-mails, videos and blogs, make up about 85
percent.32

Veracity – the value of big data in business is positively correlated with its reliability and applicability. The result
of data analysis is only as good as the data used and the appropriateness of the analytical method.

Value – data needs to add value to the business, and businesses need “clear understanding of the business
value it will bring.”33

In summary, when companies use big data, they adopt technology and data processing techniques to collect
large datasets from both conventional and unconventional sources, and analyse those data to inform their
business decisions and activities. The application of big data in a business may be an evolutionary or incremental
process, rather than a sudden switch.

27
   Reinsel et al. 2017, p.3-4
28
   Facebook 2014
29
   Statista 2018
30
   Small personal devices that can be worn, for example, on a person’s wrist, and can collect, analyse and transmit data.
31
   Gandomi & Haider 2015, p.138
32
   Gandomi & Haider 2015, p.138; Marr 2015
33
   Marr 2015

 Monitoring of insurance premiums in the world of big data | June 2018                                                      Page 12
Monitoring of insurance premiums in the world of big data | June 2018 Page 13
2. The power of big data
This section of the report illustrates government and businesses’ use of big data, through a number of case studies
showing that:
the adoption of big data techniques can be socially transformative and beneficial
company initiatives that develop and use big data engage with a large proportion of Australians today
interconnected devices and technologies and predictive analytic techniques can be harnessed to help people
and businesses in ways that we can scarcely foresee today.
2.1 A variety of uses across industries
There is a lot of hype around big data use in financial services. In the financial services sector, the development
of tools to deliver better products and services, such as artificial intelligence, application program interfaces
(“APIs”) and digital comparison tools depends on access to and analysis of data.
The application and analysis of large and varied information is increasing in many industries (see case studies,
section 2.2).
Every sector in the economy is using data to grow – from predicting weather patterns and optimising
harvesting in agriculture, to improving patient diagnosis and treatment in the health industry, to enhancing the
management of remote infrastructure in mining.34
Research conducted on 200 medium and large French companies determined that, currently, the most common
source of big data for companies is online portal content and point of sale data (rather than purchasing third party
data), and the majority relied on visual analytics software for analysis.35
The current projects detailed on the NSW Government’s Data Analytics Centre (“DAC”) website highlight the
scope and diversity of the application of big data. Among the 22 priority projects listed (as of Jan 2018) are
projects aimed at forecasting, predicting or improving education and vocational training, social welfare, emergency
response times and outcomes, public transport, corporate insolvency, water pricing, heatwave impacts and
workplace safety. DAC takes data from Government sources to solve difficult or ‘wicked’ problems, that is,
problems that seem unsolvable with standard techniques (Innovation NSW). To protect privacy, such data are
aggregated and anonymised, but they can still be analysed to identify patterns, trends and solutions.36
Population health research through big data is also a rapidly growing field worldwide. A quick search delivers
thousands of recently-published scientific papers on the subject. Khoury and Ioannidis, for example, argued that
using technology to analyse population statistics to determine correlations and identify disease pathways and
sources could save significant effort and many lives.37 The Productivity Commission also argued that more
detailed analysis available via big data can support decision making and service provision.38
Like financial services, many other sectors are also using data to develop new products and services, and improve
efficiency.
Effective use of data is increasingly integral to the efficient functioning of the economy. Improved availability
of reliable data, combined with the tools to use it, is creating new economic opportunities. Increasing
availability of data can facilitate development of new products and services, enhance consumer and business
34
PWC 2014, p.1
35
Raguseo 2018, p.194
36
Innovation NSW
37
Khoury & Ioannidis 2014
38
Productivity Commission 2017, p.60
Monitoring of insurance premiums in the world of big data | June 2018 Page 14outcomes, better inform decision making and policy development, and facilitate greater efficiency and
innovation in the economy.39
French research has indicated that the benefits of using big data included increased employee productivity, better
products and services, expanded corporate capabilities and improved management information. However, survey
participants also mentioned the risks to privacy and security from collecting data.40
Industry body Tech America identified several areas in which big data could play a role in future government.
These areas are also applicable to commercial enterprises:
replacing or supporting human decision-making with automated algorithms
reducing inefficiencies within an agency
creating transparency
improving performance by enabling experimentation to discover needs and expose variability
improving ROI [Return on Investment] for IT investments
improved decision-making and operational intelligence
providing predictive capabilities to improve mission outcomes
reducing security threats and crime
eliminating waste, fraud, and abuse
innovating new business models and stakeholder services.41
2.2 Case studies
Case study 1: Retail Loyalty Cards - Woolworths
Big data can be used by retailers to improve customer service and increase sales through targeted marketing.
The use of loyalty cards, seen by consumers as a reward system, is effective in gathering data that can drive
sales and business decisions. Eighty eight percent of Australians over age 16 belong to a loyalty program.42
Woolworths’ CEO recognised these advantages in 2014.
Data driven insights continue to assist with the transformation of our business. Through our investment in
Quantium, we can better understand the needs of our customers and deliver a better shopping experience.43
Woolworths has over 9 million Rewards Card members: about 37 percent of Australia’s population.44 When
signing up for cards, Woolworths collects customer details including name, age, address and gender. Then, when
the customers purchase goods at brand affiliates such as Caltex, BWS or Woolworths, the cards track consumer
spending patterns. The promise of a reward encourages people to swipe their loyalty cards at the point of sale,
delivering personalised purchase information to the retailer.
In 2013, Woolworths purchased a A$20m stake (50 percent shareholding) in Quantium Group, a data analytics
company group.45 In 2017, this investment was estimated to be worth A$200m, with partners including NAB,
39
Productivity Commission 2017, p.v
40
Raguseo 2018, p.194
41
TechAmerica 2012, p.12
42
OAIC 2016a
43
Woolworths Group 2014
44
Woolworths Group 2018
45
Business Insider 2017
Monitoring of insurance premiums in the world of big data | June 2018 Page 15Foxtel, Facebook and Qantas.46 Woolworths has also established a Supplier Connect portal that gives suppliers
free access to some of this customer data.47
Given that Woolworths’ rewards program is one of the largest in Australia, the Office of the Australian Information
Commissioner (OAIC) assessed the program in 2016. The OAIC review examined the collection and
management of personal information and concluded that:
The loyalty program is used primarily to determine which products and offers are most relevant for members
based on purchasing data. Woolworths Rewards then promotes offers to certain customer groups, mostly by
e-mail.
The data is also used to measure the success of particular campaigns, using de-identified data on which e-
mails are opened and which offers are used. The data uses a randomly-assigned Customer Reference
Number (CRN) and transaction history, rather than the customer’s name or other identifying information. This
transaction history includes basket contents, store location, register number, date, time, and any offers
redeemed by the customer at Point of Sale.
Quantium’s analysis uses CRNs, which it cannot link back to the personal information or identify of the
individual48.
In 2014, Woolworths launched its own branded car insurance. Choice Magazine reported that car crash data was
combined with purchasing data to find correlations between shopping habits and insurance risk.49 Big W also has
branded credit cards through VISA that can track spending outside Woolworths Group stores. It is worth noting
that other retail industry participants have connections to the general insurance industry or own branded car
insurance products (for example, Coles).
Case study 2: Facebook Disaster Maps, Social Media
Data gathered through social media platforms such as Facebook and Twitter have been applied by analysts to
predict socio-political events such as the Brexit outcome, Trump’s election win and the Australian ‘Yes’ vote to
marriage equality.50 The same platforms are playing increasingly important roles in disaster management, ranked
as the fourth most popular means of accessing information in an emergency event.51 The NSW Rural Fire
Service’s use of social media and apps such as its Fires near me NSW application have been credited with saving
lives and managing disasters including in the recent Tathra fires.52
Maps help us in so many ways–from distributing relief supplies to preparing communities for disasters. By
sharing anonymized location, movement, and Safety Check data with the American Red Cross, Facebook is
helping us sharpen the essential tools we need for targeting communities in need, delivering aid, and fighting
disease.53
The 2016 Louisiana floods were one of the worst disasters in American recorded history, destroying more than
60 000 homes. The estimated inundation flood map, prepared after the flood for the East Baton Rouge Parish,
was created using data from many sources and refined using comments on Facebook and Twitter.54
The map is powered by a compilation of various data inputs – including 911 call-outs, Baton Rouge Fire
Department search and rescue data, 311 requests for service, street-level damage assessments from City-
Parish staff and other public officials, debris collection routes, road closure information, NOAA imagery, Civil
Air Patrol imagery, and FEMA DFIRM flood hazard areas. To complement these datasets, the City-Parish
has received – and continues to receive – numerous comments from the general public via social media and
46
AFR 2017
47
AFGC 2016, p.5
48
OAIC 2016a, p.5
49
Choice 2017
50
BBC 2016
51
Kim and Hastak 2017
52
PwC, 2017b; ABC PM, 2018
53
Mashable 2017
54
Kim and Hastak 2017
Monitoring of insurance premiums in the world of big data | June 2018 Page 16email to clarify areas that were (or were not) inundated by floodwaters during this recent flooding event. As
this feedback is received, modifications are then made accordingly to the estimated flood inundation area.
The City-Parish Department of Information Services – GIS Division oversees the development and ongoing
updating of this map, with additional data continuing to be collected from a variety of sources. All new data
is analysed and then used to improve the accuracy and validity of the estimated flood inundation area.55
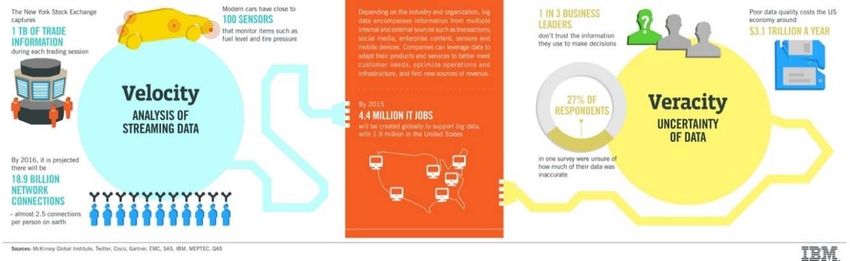
In June 2017, Facebook announced a disaster map initiative to assist aid and emergency organisations during
natural disasters.56 The disaster maps use ‘aggregated de-identified Facebook data’ to provide response
organisations with an additional source of information when coordinating emergency responses. In the 2017 Peru
flood, data on Facebook usage revealed population density areas, where people were moving to, and when
people checked in as safe, using Facebook’s ‘Safety Check’ function (figure 2).57 Facebook shares this
information with aid agencies such as UNICEF and the Red Cross.
When people use Facebook with location services activated, their latitude and longitude is recorded. Facebook
can aggregate data across both time and space, so it is possible to determine how many people are in a certain
area at a certain time. This information can then be used to help direct aid resources such as food, first aid and
water.
Figure 2-1: Example of Facebook Safety Check Page
Given that traditional communications systems can be damaged during emergency events, additional sources of
information are valuable. Facebook is also developing a pilotless solar aircraft, Aquilina, that will deliver internet
into remote areas and areas without internet during natural disasters.58
55
ArcGIS
56
Facebook Newsroom 2017
57
A function whereby Facebook users can advise that they are in an affected area, check in to say they are safe, and prompt friends to do likewise.
58
Facebook 2016
Monitoring of insurance premiums in the world of big data | June 2018 Page 17Monitoring of insurance premiums in the world of big data | June 2018 Page 18
3. Big data in insurance
This section of the report explores the adoption trajectory and the potential uses of big data that the insurance
industry in Australia may employ, including the impacts that big data may have on the industry’s existing business
operations and the implications this may raise in relation to various aspects of Australia’s consumer protection
laws. Key points include:
anecdotal information suggests that adoption of big data techniques by the Australian general insurance
industry has tended to lag behind more active adoption in leading overseas jurisdictions
adoption has potential to transform general insurer’s internal operations, value chain and their customer
interactions in fundamental ways
these changes have flow through implications for competition and consumer protection regulation.
3.1 Adoption trajectory
Insurance is a changing market, and new technology affects how insurers operate, design and price insurance.
In Australia, some insurance companies are already engaging with FinTech businesses to enhance their data
analytical capabilities (that is, using big data):
Australian insurers are getting more actively engaged; with IAG and Suncorp, being partners of Stone & Chalk
[a Sydney-based FinTech hub], as well as investing and partnering with Fintech companies, such as Trov,
and enhancing their data and analytics capabilities.59
In the UK, the use of big data in insurance was described by the Financial Conduct Authority as follows:
Big Data is being used across the product lifecycle, in pricing, product design, marketing, distribution and
sales, claims handling and fraud detection. While firms’ underlying pricing models have not changed
fundamentally, they are increasingly using additional internal and external data to supplement the information
they receive from consumers. This is improving firms’ ability to predict the likelihood of an insured event
occurring and a consumer’s propensity to claim.60
In the United States, a 2016 survey61 of major US insurance company executives found two thirds of insurers
surveyed, currently use predictive models for underwriting and risk selection, a 10 per cent increase compared to
the previous 2015 survey. The insurers surveyed expect to achieve increasingly pervasive use of predictive
modelling techniques to gain competitive advantage in personal and commercial lines insurance.
The areas of their business they expect to use these big data techniques and gain most competitive advantage
over the next two years (2017 and 2018) are show in the extracts below.
59
KPMG 2017c, p.21
60
FCA 2016a, p.7
61
Willis Towers Watson, 2016
Monitoring of insurance premiums in the world of big data | June 2018 Page 19Figure 3-1: Current and projected top predictive modelling uses
Personal lines Commercial lines
Now* Two years Now Two years
Report ordering 34% 74% Claim triage 15% 66%
Fraud potential 28% 70% Fraud potential 14% 55%
Claim triage 18% 59% Litigation potential 10% 50%
Litigation potential 23% 54% Report ordering 17% 48%
Case reserving 9% 41% Case reserving 8% 48%
Marketing & advertising 21% 39% Loss control 2% 39%
Source: Willis Towers Watson, 2016.
In Australia, implementation of big data techniques in general insurance markets appears to be lagging on the
international journey, but this is changing rapidly.
A recent survey62 of 30 Australian and New Zealand insurers found that only 10 per cent of respondents felt they
were well into implementation and had pilot projects underway. While 35 per cent of respondents did not have a
big data strategy, 45 per cent are developing their strategy, as the figure below shows.
Figure 3-2: 2018 survey of Australian and New Zealand insurer’s Big Data progress
Finity 2018, Big Data Survey Results, http://www.finity.com.au/analytics/big-data-survey-results#matrix
The survey does not identify the respondents nor the companies they represent. However, given the high degree
of concentration in the general insurance market in Australia, it is possible that initiatives implemented by only
one or two of the larger insurers can have a significant reach in the NSW general insurance industry. The survey
also found that nearly 30 per cent of respondents expected to implement big data initiatives within 6 months, with
a total of 85 per cent having implementation timeframe targets of two years or less.63
62
Finity 2018
63
Finity, 2018
Monitoring of insurance premiums in the world of big data | June 2018 Page 203.2 Implications for insurance services McKinsey & Company argued that the use of big data in insurance will affect business models, the relationships between insurers, brokers and customers, and the design of insurance and related products (box 2). Box 2: Impact of big data on insurance services Enhancing existing business models. Carriers are using data analytics to radically redefine their role by providing agencies with the tools to integrate data-driven decision making into areas such as cross-selling and reducing customer churn. These analytics tools spotlight the highest-value clients and high-potential leads so agents can invest resources more efficiently, predict customer churn more accurately to help improve retention, and generate broker-peer comparison analytics to identify additional sales opportunities. Strengthening channel relationships. Carriers are using data analytics to strengthen broker relationships. AXA’s EB360 platform, for example, offers a suite of analytics-powered tools to help brokers track the status of applications, manage compensation, and commissions and monitor progress on business goals. The tools, which are optimized to minimize data entry and enable rapid quoting, help brokers manage their business more effectively, and thus strengthen the broker-carrier relationship. Changing relationships with consumers. Insurers are fundamentally changing their relationship with consumers using real-time monitoring and visualization. Consumers who agree to let insurance companies track their habits can learn more about themselves, while insurers can use the data to influence behaviour and reduce risks. In auto insurance, for example, telematics are being used to monitor consumer driving habits in real time. By harnessing the resulting insights, insurers can offer usage-based policies and determine claims liability easily and accurately. Redesigning products. The Climate Corporation is using data and analytics to redefine the crop insurance market. The company uses data on weather patterns, soil characteristics and other key crop attributes at the field level to reduce farmers’ risks by designing policies that protect farmers from losses due to weather and other adverse events. Creating new business models. Sonnet, Canadian insurer Economical’s entrance into the direct channel, relies on a “data hub” to allow consumers to efficiently obtain online quotes and bind coverage for homeowner’s and auto insurance. The data hub quickly aggregates information from numerous databases to streamline the buying experience. At most insurers, consumers must answer more than 20 questions to get an auto insurance quote; Sonnet requires fewer than 10. The approach appeals to tech-savvy consumers with relatively straightforward insurance needs, while those seeking more assistance with their insurance decisions can purchase through Economical’s broker partners. Establishing new adjacent businesses. A large commercial insurer has formed partnerships to offer policyholders just-in-time solutions such as the maintenance of heating, ventilation and air-conditioning equipment in commercial buildings. The solutions are based on monitoring and diagnosing vibration and sound patterns to detect declining performance and predict failures, which reduces the total cost of ownership. Source: Libarikian et al, 2017, Harnessing the potential of data in insurance, p. 2-3 Effective use of predictive analysis can reduce human error, and improve pricing and risk assessment, and risk underwriting. The expected impacts of these changes, however, are not straightforward. They can vary across types of insurance and policy holders. Overall, access to big data is likely to affect how insurance products are designed and marketed, how claims are assessed and paid, and how risk is assessed and managed. Monitoring of insurance premiums in the world of big data | June 2018 Page 21
In addition, the collection and use of big data has implications for consumer protection and privacy. Governments
need to consider how best to ensure that the rights of consumers are protected as more of consumers’ personal
data is collected and used by insurance companies and other businesses. The Financial Conduct Authority in
the UK, for example, has recognised these risks.

     In September 2016, we published a feedback statement on Big Data. We found that Big Data is facilitating a
     range of benefits for consumers in motor and home insurance, by transforming how they deal with retail
     insurance firms, encouraging more innovation in products and services and streamlining parts of the customer
     journey. We also, however, found some concerns about data protection rules and the use of data.64

Some of the solutions to these concerns could involve industry self-regulation,65 but they could also involve
government regulation.

3.3 Impact on products and service
Big data is changing the way insurance products are designed and marketed and the ongoing relationship of
insurers with their customers, including through claims management. The relationship is expected to change
further in the coming years, resulting in a more customised and individually targeted approach to customer service
and insurance products.

Some studies have argued that such changes are necessary to meet consumer demand and expectations. In
2012, EY argued that insurers needed to connect with their customers and understand their customers’ needs
better66. A subsequent survey in 2014 stated that most customers across the Asia-Pacific region (including
Australia) had a clear preference for more frequent, personally relevant, communications from their insurer.67 In
2016, KPMG also argued that, generally, insurers have not fully recognised the fundamental change to their
business model needed: that they need to become more customer-focussed.68

Similar disruptions from data and technology are occurring across the financial services sector. PwC estimated
that data-driven innovation in financial services and insurance in 2013 increased the sector’s gross value added
by A$6.6bn.69 A MagnaCarta Communications survey indicated that financial institutions felt that about one-third
of their revenues were at risk from new technologies.70 A later PwC survey also indicated that 88 percent of
incumbents are increasingly concerned about losing revenue to innovators.71

To date, the demand for insurance products that include financial technology has lagged the broader financial
services sector,72 but consumer adoption of insurance products that incorporate financial technology is now
growing rapidly. On average across international markets, 33 percent of digitally active consumers regularly use
FinTech services. This has increased from 16 percent in 2015.73 In insurance, however, the average international
adoption rate has increased from 8 percent in 2015 to 24 percent in 2017.74 The only sector that grew more
quickly was money transfer and payments.

Research indicates that Australian consumers are generally relatively happy with their insurers, although they do
see room for improvement.75 After value for money, being easy to deal with was ranked by Australians as the
second more important characteristic in their relationship with their insurer.76 In the past, insurance companies
have not had an ongoing relationship with their customers, and 89 percent have made little or no effort to retain

64
   FCA 2017, p.31
65
   Insurance Council of Australia 2017, p.30
66
   EY 2012, p.33
67
   EY 2014, p.29
68
   KPMG 2016, p.1-2
69
   PwC 2014, p.15
70
   Hardie et al 2017, p.16
71
   PwC 2017, p.2
72
   EY 2017, p.14
73
   EY 2017, p.6
74
   EY 2017, p.14
75
   PIRAC Economics 2017, p.29
76
   EY 2014, p.10

 Monitoring of insurance premiums in the world of big data | June 2018                                   Page 22
customers.77 As noted above, commentators are now arguing that this attitude needs to change, and many are
pointing to big data as the primary tool for insurance companies to better understand customer needs, and to
engage with and respond to their customers.78
Product design
In Australia and overseas, there have already been product design changes in the insurance industry because of
big data. One of the earliest big data products offered were telematic devices for motor vehicle insurance (case
study 4). The use of these devices illustrates several areas where insurance companies can innovate. There are
also possible innovations in products on offer (for example combining insurance with other risk management
services), as well as in risk assessment and pricing. Section 0 discusses the use of technology to assess
customer risk.
Case study 3: Auto Insurance – QBE
QBE insurance has developed the ‘Insurance Box’: a comprehensive car insurance product that bases the
insurance policy cost on the way the vehicle is driven. Traditionally, car insurance premiums are based on
backward-facing, general sociodemographic factors, vehicle characteristics and, if available, claims history.
Insurers may obtain age, gender, employment, postcode and vehicle model data to set the premium.
However, there are obvious limitations in a static and backwards-facing assessment of risk.
QBE was the first company in Australia to introduce a device called the Insurance Box, developed by an
Australian company, Intellitrac.79 It is fitted to the dashboard of a car, and uses GPS to collect and transmit
data such as where the car is driven and stored, speed, braking, cornering and distance travelled. The data
collected is analysed to personally price the driver’s insurance policy to reflect their collision risk80. The
product was initially targeted at younger drivers, who, lacking a driving record and claims history, are subject
to higher insurance premiums. Better drivers are charged lower premiums and the company stated that good
drivers can save up to 30 percent on premiums when they renew their policy (Autotalk). Riskier drivers, on
the other hand would pay more for their insurance. However, these drivers can choose a different policy or
provider, or modify their behaviour so that future premiums are lower.
In addition, drivers are given feedback on their driving habits and improvements are suggested via a
DriveScore dashboard. If the device detects a collision or excessive speeding or braking, the driver is sent
an SMS. In the event of a collision, the SMS also contains the immediate contact number for claims (QBE
2018). Drivers can add the Insurance Box app to their smartphones, which also recognises behaviour such
as texting while driving. The box can be activated to track the car in the event of theft. The company stated
that all stolen cars fitted with the device have been recovered.81
Data are also de-personalised and aggregated to assist with road safety campaigns. Professor Stevenson
at Melbourne University is doing research using QBE data to track whether providing young drivers with
incentives for good driving can reduce fatalities.82
PwC has argued that devices such as the telematic devices discussed in Case Study 3 have reduced traffic
accidents among participants by 30 percent.83 The take-up of telematic-based motor vehicle insurance is growing
in the UK. Between 2014 and 2015, the number of policies increased by 40 percent. In December 2015, 2
77
EY 2012, p.35
78
EY 2014, p.16
79
Canstar 2014
80
QBE 2018
81
Herald Sun 2017
82
University of Melbourne
83
PwC 2014, p.41
Monitoring of insurance premiums in the world of big data | June 2018 Page 23You can also read