India's Debt Markets The Way Forward July 2017 - ASIFMA
←
→
Page content transcription
If your browser does not render page correctly, please read the page content below

India’s Debt Markets
            The Way Forward
            July 2017

Contributors:

                                   Page 1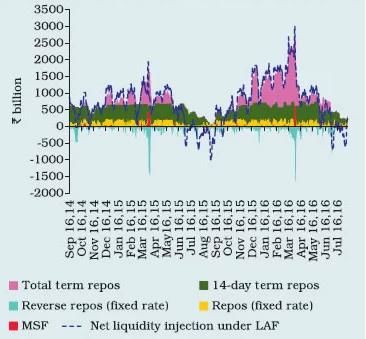
Disclaimer
The information and opinion commentary in this ASIFMA – India’s Debt Markets Paper was prepared
by the Asia Securities Industry and Financial Markets Association (ASIFMA) to reflect the views of our
members. ASIFMA believes that the information in the Paper, which has been obtained from multiple
sources believed to be reliable, is reliable as of the date of publication. As estimates by individual
sources may differ from one another, estimates for similar types of data could vary within the Paper.
In no event, however, does ASIFMA make any representation as to the accuracy or completeness of
such information. ASIFMA has no obligation to update, modify or amend the information in this Paper
or to otherwise notify readers if any information in the Paper becomes outdated or inaccurate.
ASIFMA will make every effort to include updated information as it becomes available and in
subsequent Papers.

                                                                                                         Page 2
ASIFMA is an independent, regional trade association with over 100
member firms comprising a diverse range of leading financial institutions from
both the buy and sell side including banks, asset managers, law firms and
market infrastructure service providers. Together, we harness the shared
interests of the financial industry to promote the development of liquid, deep
and broad capital markets in Asia. ASIFMA advocates stable, innovative and
competitive Asian capital markets that are necessary to support the region’s
economic growth. We drive consensus, advocate solutions and effect change
around key issues through the collective strength and clarity of one industry
voice. Our many initiatives include consultations with regulators and
exchanges, development of uniform industry standards, advocacy for
enhanced markets through policy papers, and lowering the cost of doing
business in the region. Through the GFMA alliance with SIFMA in the US and
AFME in Europe, ASIFMA also provides insights on global best practices and
standards to benefit the region.

                                                                                 Page 3
TABLE OF CONTENTS
A. Executive Summary............................................................................................................................ 7
1. Evolution of the Indian Bond Markets.......................................................................................... 8
2. Legal & Regulatory Framework (Bankruptcy & Resolution, Netting) ........................................... 8
3. Settlement and Operations – Issues and Suggested Steps for Resolution ................................... 9
4. Offshore Issuance by Indian Issuers – Structures and Legal Framework ..................................... 9
5. Access Channels and the Taxation of Debt Instruments .............................................................. 9
6. Annexure A – The Overview of Taxability in India ...................................................................... 10
7. Annexure B - Tax and Regulatory Overview of Different Instruments ....................................... 10
8. Annexure C – Recommendations ............................................................................................... 10
B. Evolution of the Bond Markets in India ........................................................................................... 11
1. Introduction ................................................................................................................................ 11
2. Government Securities ............................................................................................................... 12
3. State Developmental Loans ........................................................................................................ 14
4. Introduction and Strengthening of Funding Markets ................................................................. 16
5. Widening of the Market ............................................................................................................. 17
6. Introduction of New Products - Development of Derivative Markets ....................................... 21
7. Corporate Bonds: Evolution of the Secondary and Primary Markets ........................................ 22
8. Corporate Bonds: New Endeavours............................................................................................ 25
9. Securitisation and Covered Bond Market (ASIFMA)................................................................... 26
10.Rates and Credit Market Infrastructure (including Ratings) (ASIFMA)....................................... 30
C. The Current Overall Bond Market Legal and Regulatory Framework, Netting, Bankruptcy and
Resolution ........................................................................................................................................ 32
1. Recent Entries in the Indian Bond Market ................................................................................. 32
2. Inter-linkage of the Indian Bond Market with Repos, Swaps and Futures Markets .................. 34
3. Concrete Steps for Attracting Foreign Investment ..................................................................... 36
Page 44. Protection of Investors ‘a must’ ................................................................................................. 36
5. Indian Bond Market: The Road Map Ahead ............................................................................... 37
D. Settlement & Operations – Recommendations............................................................................... 39
1. Uniform Settlement Cycle for Government Debt Securities ...................................................... 39
2. Rationalization of Debt Limit Rules ............................................................................................ 39
3. Introduction of Early Pay-In ........................................................................................................ 40
4. Other Recommendations ........................................................................................................... 40
E. Offshore Issuance by Indian Issuers – Structures & Legal Framework* .......................................... 41
1. High Yield Issuance ..................................................................................................................... 41
2. Masala Bonds.............................................................................................................................. 44
3. Medium Term Note Programmes ............................................................................................... 46
4. Green Bonds ............................................................................................................................... 47
F. Access Channels and Taxation of Debt Instruments........................................................................ 50
1. Access Channels for Debt Investments....................................................................................... 50
2. Emerging Tax Landscape............................................................................................................. 52
G. Annexure A ...................................................................................................................................... 57
1. Overview of Taxability in India ................................................................................................... 57
H. Annexure B – Tax and Regulatory Overview of Different Instruments ........................................... 60
1. Dated Government Securities .................................................................................................... 60
2. State developmental Loans (SDLs) ............................................................................................. 61
3. Deep Discount Bonds (DDBs), Zero-Coupon Bonds (ZCBs) and Discount Bonds (DBs) .............. 62
4. Perpetual Debt Instruments – Tier I and Debt Capital Instruments – Tier II .............................. 63
5. Listed Non-Convertible Debentures (NCDs)/Bonds (including Credit Enhanced Bonds) ........... 64
6. Unlisted Corporate Debt Securities ............................................................................................ 65
7. Masala Bonds.............................................................................................................................. 66
8. Indian Rupee Denominated External Commercial Borrowings (ECBs) ....................................... 67
Page 59. Foreign Currency Bonds (FCBs)................................................................................................... 69
10.Cash Settled Interest Rate Futures (IRFs) ................................................................................... 70
11.Units of a Debt Oriented Mutual Fund ....................................................................................... 71
12.Infrastructure Debt Funds (IDF) .................................................................................................. 72
13.Security Receipts and Securitised Debt Instruments.................................................................. 73
14.Units of Real Estate Investment Trusts (REITs) and Infrastructure Investment Trusts (InvITs) . 74
I. Annexure C – Recommendations .................................................................................................... 76
ASIFMA would like to extend its gratitude to Clifford Chance, J.P. Morgan, Juris Corp, Nomura and PwC,
and all of the individuals and member firms who contributed to the development of this paper.
Page 6A. Executive Summary
Ever since India ushered in a burst of economic reforms starting in the early nineties, there has been
a metamorphosis in the Indian capital markets, which has posted impressive growth across several
dimensions. Even so, there is scope for improvement across a number of are ranging from the more
visible physical infrastructural constraints to the less visible institutional, social, legal, regulatory and
governance deficits have collectively impeded the further development of the Indian markets – so
much so that even though growth rates and the progress witnessed in Indian capital markets in
absolute terms might appear to be impressive, these have been outpaced by even faster capital
market developments – particularly in the fixed income space – in the other regional emerging
markets, China in particular. ASIFMA (together with our co-authors) have endeavoured to take stock
of recent developments (since the publication of ASIFMA’s last India bond markets roadmap in 2013)
and to lay down some clear markers for the future evolution of the Indian fixed income markets.
For a long period of time post-independence in 1947, India has had a relatively closed capital account,
which the Indian regulatory authorities have only begun to open gradually. Since the dawn of the
economic reform era in the early 1990s, the domestic Indian markets (both debt and equity) have
shown substantial growth. Turning to some specific numbers, net cumulative foreign investment in
equities has grown from nothing in 1992 to USD 128.5bn as of end-2016, while the comparable figures
for debt stands at USD 42.1bn. These figures account for about 6.4% of the total Indian equity market
capitalization and approximately 3.0% of the combined value of the Indian debt markets (source:
Business Standard). While the overall growth figures over the last 25 years have been impressive,
these figures are still relatively low compared to the other, more open capital markets globally.
Across other metrics too, there are several areas in which the Indian fixed income markets could see
structural changes for the better, despite stand-alone growth rates being relatively impressive – for
instance, while Indian corporate debt as a percentage of GDP has grown from less than 5% to about
15% of GDP over a five-year period starting in 2012, this figure is considerably less than even a smaller
ASEAN market such as Malaysia, where corporate debt penetration is around 40% of GDP. Thus, there
is considerable room for growth in corporates accessing the capital markets (as opposed to the more
traditional loan markets), more so in an environment where bank non-performing loans (NPLs) have
weighed heavily on Indian bank profitability and capital ratios in recent years.
A mix of restrictive rules regarding issuance, high public sector borrowing requirements, uncertainties
around tax policy and the propensity of the Indian regulatory authorities to implement frequent rule
changes without sufficient market consultation, shortcomings (at least till recently) in areas such as
bankruptcy, resolution and netting, the lack of benchmark yield curves, illiquidity in the secondary
markets except in a limited number of on-the-run benchmark instruments, the lack of a trading culture
among several classes of institutional investors, the lack of well-developed fund management and
insurance industries and the low rate of capital formation coupled with the low level of private sector
savings, have all weighed on the development of the fixed income markets.
We have attempted to address all these issues in the course of this document and have organized our
discussion along the following lines:
Page 71. Evolution of the Indian Bond Markets
In this section, we have reviewed some of the key points and the various recommendations we made
in the “2013 India Bond Market roadmap” and have outlined how both the Indian cash bond and
derivatives markets (particularly the government bond markets) have developed, with the key role
played by the Clearing Corporation of India Limited (CCIL), in the areas of trading and clearing. Even
though a great deal of progress has occurred, some of our recommendations have yet to be met –
particularly with respect to the lack of liquidity in anything but the on-the-run issues and the adoption
of a “mark-to-market” (as opposed to a hold-to-maturity) mindset among several market participants.
We then review the growth in the corporate bond markets, the different types of instruments, the
volumes traded, the holding pattern of securities among various classes of investors, the development
of the repo markets and the need for a “classic repo” market and the progressively wider participation
in the Indian bond markets among a wider range of Foreign Portfolio Investors (FPIs). We also assess
the growth and development of Indian mutual fund investments in the debt markets.
Finally, we look at developments in the Indian securitization markets, the granting of access to FPIs in
recent months and the rationalization/removal of certain tax barriers to investment in Indian
securitization structures. We also evaluate the Indian credit markets infrastructure, particularly the
creation of ratings agencies and the increasingly key role they play in the Indian ratings space. While
foreign ratings agencies have a presence in India (both direct and indirect), more needs to be done to
align the local Indian scale of ratings to international norms. Additionally, while trading, clearing and
settlement infrastructures have developed, linkages of Indian securities depositories with
International Central Securities Depositories (ICSDs) would prove especially beneficial for collateral
mobility internationally.
2. Legal & Regulatory Framework (Bankruptcy & Resolution, Netting)
In this section, we discuss the overall domestic legal and regulatory framework governing the Indian
fixed income markets, in particular, the division of oversight responsibilities between the Reserve
Bank of India (RBI) and the Securities & Exchange Board of India (SEBI). We also discuss some of the
newer fixed income products introduced into the domestic bond markets (and the regulations
governing such instruments) such as municipal bonds and gold sovereign bonds.
Next, we consider the linkages between the cash markets and derivatives/hedging instruments such
as swaps and futures and the evolution of the repo markets in India. While several positive
developments have occurred in the swaps market (such as the setting up of bilateral margining, central
clearing and the mandating of “Legal Entity Identifiers” (LEIs), much more needs to be done. Turning
to the repo markets, there has been progress here as well, but has been relatively limited. While re-
repo is permitted under certain conditions in the government securities markets, this has not been
allowed for corporate bonds. As for other steps, central clearing and reporting of repos and more
recently, the legalization of a tri-party repo framework have all been taken. That said, a true “classic
repo” framework remains some distance away in India.
Page 8Additionally, issues related to the adoption of close-out netting, the new bankruptcy & insolvency
regime (which is expected to provide an impetus to close-out netting) and the “Financial Resolution &
Deposit Insurance Bill” (FRDI), all of which align the Indian markets more closely with international
standards, are also discussed. Finally, specific measures for investor protection and the granting of
increased access to FPIs are covered in this section. Specific proposals made by the Indian regulatory
authorities to further develop the bond markets, such as rules governing the re-issuance of bonds and
the adoption of the Electronic Book Provider (“EBP”) mechanism are explored in greater detail.
3. Settlement and Operations – Issues and Suggested Steps for Resolution
In this section, specific issues related to the settlement and operations infrastructure with respect to
the Indian fixed income markets are highlighted and specific solutions are proposed for their
resolution. Specifically, the lack of a uniform settlement cycle, undue complexity in managing FPI limits
and the need to consolidate the multiple circulars pertaining to guidelines for FPI investments in the
Indian bond markets are discussed.
4. Offshore Issuance by Indian Issuers – Structures and Legal Framework
This section focuses on the external/international component of the Indian bond markets and focuses
specifically on some of the innovative High Yield (HY) deal structures employed in accessing these
markets. A brief overview of how these structures can be compared and contrasted with HY issuance
from other jurisdictions such as China (with a focus on covenant packages and credit support
mechanisms) is explored in detail in this section.
In terms of specific instruments, the newly introduced Masala bond market’s overarching regulatory
framework, together with some of the more recent (in our view, counterproductive) restrictions that
have been imposed are discussed in some detail. Finally, rules governing Indian Medium Term Note
(MTN) programmes and the fast-developing green bond market are also covered.
5. Access Channels and the Taxation of Debt Instruments
The final section of the document provides exhaustive coverage around the “access channels”
available for all FPIs for investment in a whole range of Indian debt instruments – ranging from dated
government securities, to zero-coupon bonds, non-convertible debentures, perpetuals, Masala bonds,
debt-oriented mutual funds, securitized instruments, infrastructure investments and Real Estate
Investment Trusts (REITs), among others.
The paragraphs following the discussion of FPI access channels provide a detailed overview of the
complex Indian tax framework – specific topics discussed include the latest developments with regard
to the revision of Indian tax treaties with a number of countries, the General Anti-Avoidance Rules
(GAAR), rules related to “Base Erosion and Profit Sharing” (BEPS), Thin Capitalization Rules, Income
Computation and Disclosure Standards (ICDS) and “Overseas Transfer Provisions”.
Additionally, this section also discusses the “Safe Harbour Provisions” for international investors in the
Indian capital markets and the newly established framework for the establishment of International
Financial Services Centres (“IFSCs”) with the Gujarat International Finance Tech City (“GIFT City”) being
Page 9the first such IFSC. Tax exemptions and incentives for investment in IFSCs are also alluded to in this
section.
The remaining sections are all Annexures/Appendices, which complement and add round out the
discussions centred on the topics above.
6. Annexure A – The Overview of Taxability in India
This annexure is a comprehensive overview of how tax is determined, assessed and administered on
income streams and capital gains, based on various criteria – the residency of the taxpayer and the
characterization/accrual of income. The imposition of various specific taxes – such as withholding
taxes and Minimum Alternative Tax (MAT) is discussed, along with the applicability of the various tax
treaties with reference to specific situations.
7. Annexure B - Tax and Regulatory Overview of Different Instruments
This annexure is an instrument by instrument description of each of the various classes of debt
securities covered in “Section F” – Access Channels – above, with respect to the conditions that
regulate FPI investment in and taxation of each of these securities. Specific details are provided on the
types of investors, investment conditions, investment limits, taxes on income and capital gains and
withholding taxes (if applicable), pertaining to each class of fixed income instrument, among other
relevant details.
8. Annexure C – Recommendations
An exhaustive set of recommendations, based on our discussion/analysis of the various issues
highlighted in each of the sections above – is contained in this final annexure. These recommendations
range from general/broad suggestions at a macro level, to very specific ones – dealing with
suggestions that are pertinent to certain micro aspects of the Indian fixed income markets – such as
settlement timelines, to give one example.
Page 10B. Evolution of the Bond Markets in India
1. Introduction
Over the last five years, India has been considered a key growth economy in Asia and one of the
“markets to be in” for foreign investors, as the country consistently recorded annual GDP growth rates
in excess of 7% (till the most recent post-demonetization period), making it the fastest growing G-20
economy for a period of time. In short, India is now considered an emerging success story, more so
after the new government signalled its intent to carry out (and has implemented) several reforms,
many of them centred on the ease of doing business.
However, there are some economic and financial infrastructure bottlenecks that need to be eased to
further encouraging foreign investments. Weak corporate balance sheets, need for further tax and
labour reforms, high NPLs and low credit growth in an uncertain global economic environment, have
taken some of the shine off the India growth story. The implementation of a consistent and
coordinated policy to further develop the Indian financial markets would confer great benefits to India
and its citizens. A more structured approach would enable a much safer and more appealing market
for issuers and investors and ultimately result in a stronger economy for India.
At a more micro level, we do note that the Indian authorities have recognized that a robust bond
market is critical for growth of any country and India is no different. A developed bond market
significantly increases the depth of the financial markets as it helps in serving the needs of both the
private and public spheres better. This assumes a role of even greater significance given the context
that bank balance sheets are now extremely weak, thus impeding loan growth, but some of that
growth has now shifted to the bond markets, whose development (particularly in the corporate bond
area) has accelerated over the last few years. Hence, it comes as no surprise that the Indian regulatory
and monetary authorities recognize this and have been taking continuous steps to deepen the fixed
income market in India.
In consequence, the total domestic bond market has grown from around USD 1.0tn at the end of 2012
to approximately USD 1.5tn by March 2017, with government securities (both Central and State)
accounting for USD 1.06tn (Source: Livemint data and ASIFMA estimates). More significantly,
corporate bonds as a percentage of GDP have grown from around 5.0% in 2012 to around 14% in 2016
(Source: ASIFMA and Livemint), although this level of penetration is still considerably lower than that
of Malaysia, where the corporate bonds to GDP ratio is in excess of 40%. At a greater level of detail,
the following are the types of bonds that are issued in the Indian domestic bond markets:
1. Government bonds and Treasury Bills (T-Bills): issued directly by the government of India, the
so called G-Secs; T-Bills are shorter-dated securities, up to one-year in duration;
2. Borrowing by state governments: State Development Loans (SDLs), which are dated securities
issued by single states within India for meeting their market borrowing needs;
3. Corporate bonds (including Public Sector Unit (PSU) bonds – issued by sovereign/quasi-
sovereign entities and bonds issued by banks/financial institutions): this market has room to
Page 11develop further. While the value of corporate bonds outstanding has expanded from single
digit to double digit percentages as a proportion of GDP, there is a long way to go;
4. Masala bonds – these are INR-denominated bonds issued offshore and are a form of offshore
borrowing – this is a product that has been legalized relatively recently;
5. Securitised Debt Instruments: These are issued either in the form of debentures or Pass-
Through Certificates – Foreign investors have recently been given access to this market and
moreover, tax treatment of these instruments has been made more advantageous.
6. Municipal bonds: these are bonds issued by Urban Local Bodies (ULBs) for financing specific
projects, typically linked to infrastructure; the framework for the issuance of these
instruments was recently announced by SEBI and the first issuance was done recently.
7. Gold Sovereign Bonds: This is again a product introduced relatively recently, to help make
India’s large gold holdings in private hands, more liquid besides being put to more productive
uses.
8. Green bonds: The framework for green bonds issuance was introduced in India in 2016 and a
few transactions, mostly by financial institutions, have been completed.
The ultimate objective of RBI has been to ensure complete transparency and increasing liquidity across
the curve, thereby helping in better discovery of prices for both government and corporate bonds.
Clearly articulated steps have been taken by RBI over the course of last three to four years to ensure
this is achieved. Further, to make the market more vibrant, RBI has also been introducing new
products and encouraging more types of investors to actively contribute to the bond market. That
said, more needs to be done to bring the Indian fixed income markets on par with the more developed
regional bond markets. In the following sections, we will outline how bond markets have evolved in
India in last few years and set out recommendations on how this market could be further improved.
2. Government Securities
Since the last report on the Indian bond markets published in 2013, there has been considerable
progress that the Indian government securities markets have recorded. We outlined several areas
pertaining to the Indian government securities market where there was/is room for improvement and
articulated specific advocacy points, which we urged the Indian authorities to consider adopting.
While it is fair to say that many of the suggested changes/improvements to the Indian government
securities framework have been passed, there is room for more improvement.
Specifically, we urged the development of benchmark yield curves across the maturity spectrum and
the need for greater liquidity in the secondary markets (through the adoption of more of a trading
mentality among market participants, a move away from “held-to-maturity” portfolios to the adoption
of a “mark-to-market/held-for-trading” approach, which in turn would be facilitated by a reduction in
the Statutory Liquidity Ratio (SLR), encouraging the development of a broader and more active
domestic and foreign investor base, including pension funds, mutual funds, insurance companies and
other real money investors, besides developing a variety of hedging tools including repo and
Page 12derivatives). Over the last half decade, while a great deal of forward movement has occurred, progress
in at least a few of the areas has been decidedly mixed.
The volumes traded in the government bonds market have increased as the borrowing program of the
government has increased over the years. In terms of secondary market activity in government bonds,
the volumes traded across the yield curve since the last few years have seen a change in distribution.
The benchmark 10y has been the most traded security (with the highest percentage of volumes being
traded in the 7y-10y bucket). However, since 2014-15 we have seen a pickup in volumes traded in the
5y and 5y-7y bucket which has led to better discovery of the bond curve in less than 7y tenors. The
10y-15y bucket which is the second most traded bucket has seen a decline in share in total volumes
traded.
The longer end of the curve which is > 15y maturity however continues to be less traded accounting
for 1-3% of volumes. This is because the most active participants in this segment are investors like
pension funds and insurance firms who are long only investors and undertake less trading activity in
this segment. Thus, one of our goals, the suggested encouragement of traders to trade across the
maturity spectrum has not yet been met. That said, the authorities are conscious of the need for longer
dated benchmarks and in order to make the longer end more relevant for investors like Employee
Provident Fund Organizations (EPFOs) and insurance companies a 40 year bond was issued for the first
time in 2015.
G-Sec Volumes
100,000 91,496
85,576
79,686
80,000
59,209
60,000
40,000 30,991
24,808 25,522
20,000
-
2009-10 2010-11 2011-12 2012-13 2013-14 2014-15 2015-16
INR bn
Table 1: G-Sec traded volumes
Source: CCIL
In terms of structural developments in connection with the market’s trading infrastructure, cash bond
trading in the government securities market has evolved in a unique direction. The Negotiated Dealing
System – Order Matching (NDS-OM) framework of the CCIL effectively acts as a “Central Limit Order
Book” on which the bulk of government bonds trade (and is also the CCP – Central Counterparty – for
all secondary market trades in the government bond market, which have to be mandatorily
Page 13cleared/settled through CCIL). This represents a marked difference from most other markets, where
government bonds are generally traded OTC, or on a Request for Quote (RFQ) basis.
In the context of CCIL playing a central role in both the government bond (and repo) markets, the
recognition of CCIL as a CCP equivalent to a European CCP by ESMA in March 2017, ahead of the
effective start date of MIFID II in January 2018, is a welcome development. ASIFMA has long advocated
that Asian CCPs (including and especially CCIL) obtain equivalence (with both the US and European
CCPs), to ensure a smooth transition to the new regulatory regimes (MIFID II in the case of Europe).
The benchmark on the run bonds continue to be the most liquid securities that are traded on the NDS-
OM screen and the broker market. Yet another initiative with a view to ensure more liquidity in illiquid
bonds is the market making program for Primary Dealers (PDs), where PDs offer two way quotes on
the screen on selected securities. This will lead to more trading activity in illiquid securities and
correspondingly better discovery of the yield curve.
Tenor-wise Issuance of Government Bonds (INR billion)
Up to 5Y 5-7Y 8-10Y 11-15Y 16-20Y 21-40Y
2013-14 110 1,160 1,230 1,190 930 950
2014-15 - 810 1,610 1,470 930 1,100
2015-16 - 200 1,970 1,430 1,120 1,130
2016-17 - 730 1,750 1,630 820 890
Table 2: Tenor-wise Issuance of Bonds
Source: CCIL
Tenor-wise Distribution of Traded Volumes (INR crores)
5-7y % >7-10y % >10-15y % 15-20y % >20-40y %
2014-15Q4 304,205 13 31,884 1 980,226 43 881,529 39 25,071 1 62,113 3
2015-16Q1 386,973 17 34,724 2 1,139,598 50 638,305 28 33,830 1 47,317 2
2015-16Q2 246,532 11 54,214 3 1,435,526 67 345,300 16 27,631 1 44,999 2
2015-16Q3 283,526 15 253,748 13 797,313 41 504,134 26 50,128 3 43,143 2
2015-16Q4 554,152 25 206,045 9 693,755 32 663,532 30 36,132 2 37,109 2
2016-17Q1 578,125 20 303,138 11 903,690 32 964,381 34 37,005 1 41,477 1
2016-17Q2 517,385 10 455,477 9 1,908,203 37 2,202,993 42 59,825 1 61,470 1
2016-17Q3 342,109 7 379,778 8 2,089,302 45 1,658,342 36 59,807 1 63,528 1
2016-17Q4 317,374 12 165,704 6 1,370,790 53 646,997 25 26,937 1 44,635 2
Table 3: Tenor-wise Distribution of traded volumes
Source: CCIL
3. State Developmental Loans
The amount of SDLs traded, as a percentage of total volumes, have also increased over the last few
years as states have increased reliance on market borrowings from 69.7% of outstanding liabilities in
March 2015 to 74.7% by end March 2017. Over the years we have seen a steep increase in SDL
issuances. From a gross borrowing figure of INR 1182bn in 2009-10 it has increased to INR 3820bn in
2016-17.
Page 14State government borrowings were unevenly distributed with bunching up of borrowings in the
second half of the year. There has been more visibility for the market on issuance of SDLs and state
wise issuance calendars are published on a quarterly basis. This has led to an increase in market
participation and also the percentage of SDLs traded in the secondary market has increased over the
last few years as can be seen from the table below.
SDL Gross Borrowing (INR billion)
4500
4000
3500
3000
2500
2000
1500
1000
500
0
2009-10 2010-11 2011-12 2012-13 2013-14 2015-16 2016-17
Table 4: SDL Gross Borrowing
Source: RBI
Instrument wise % of Traded Volumes
% of Traded Volumes G-Secs SDL T-Bills
2014-15Q4 90.0 2.5 7.5
2015-16Q1 89.1 2.2 8.7
2015-16Q2 87.6 3.1 9.2
2015-16Q3 86.3 3.9 9.7
2015-16Q4 88.7 3.9 7.4
2016-17Q1 89.1 3.5 7.4
2016-17Q2 91.8 3.3 4.9
2016-17Q3 91.9 2.9 5.3
2016-17Q4 84.8 5.3 9.9
Table 5: Instrument wise % of Traded Volumes
Source: CCIL
Page 154. Introduction and Strengthening of Funding Markets
While the Indian repo market has seen significant changes since 2013, notably the introduction of
mandatory trade reporting on the National Dealing System (NDS) of the CCIL, India has still yet to
adopt the “classic repo” framework advocated by ASIFMA in our 2013 India bond market roadmap.
For more on the legal framework governing the Indian repo market, please see the “Legal &
Regulatory” section.
Turning to the evolution of the repo markets themselves, the liquidity operations by RBI have moved
to a term repo framework post October 2013. Earlier the banking system was entirely dependent on
the fixed rate LAF window where liquidity at a fixed rate (repo rate) was provided by RBI and excess
liquidity was taken out through the use of fixed rate (reverse repo). In October 2013 term repos were
announced for the first time wherein 7day and 14day term repos were announced through a variable
rate auction mechanism. Over the last three years we have seen increased use of variable rate of term
repo and term reverse repo facilities across tenors from 2d-128d for managing banking system
liquidity. According to RBI’s annual report with the institution of the revised liquidity management
framework, the role of term repo auctions under the liquidity adjustment facility (LAF) has become
significant. Normal 14-day and fine tuning term repos of varying tenors ranging from 2 to 56-day
accounted for about 90 per cent of the average net liquidity injection under the LAF during the year.
Liquidity Management: Various Instruments
Table 6: Liquidity Management: Various Instruments
Source: RBI Annual Report 2015-16
As the term repo and reverse repo markets have evolved, the reliance of inter-bank community on
call money markets has declined. There has been a decline in call money volumes in the last quarter
of 2016-17 as the banking system has been parking its entire excess liquidity with RBI.
Page 16Percentage of Traded Volumes in CBLO, Repo and Call Market
% of Volumes CBLO Repo Call
2014-15Q4 60.8 27.2 12
2015-16Q1 60.7 28.1 11.2
2015-16Q2 62.8 25.8 11.3
2015-16Q3 57.5 30 12.5
2015-16Q4 53 31.7 15.3
2016-17Q1 54.9 31.9 13.2
2016-17Q2 56.3 32.9 10.8
2016-17Q3 59.1 29.8 11.1
2016-17Q4 62.8 28.4 8.8
Table 7: Percentage of Traded Volumes in CBLO, Repo and Call Market
Source: CCIL
5. Widening of the Market
FPI Participation
The participation of FPIs have increased over the last three years as RBI provided a calendar for
opening up limits in government bond markets and SDLs on a quarterly basis. The RBI in its monetary
policy statement in September 2015 laid down a medium term framework for FPI limits in consultation
with the government. The limits would be increased in phases to 5% of the outstanding stock by March
2018. For more details on FPI participation in the Indian bond markets, see the section of FPI access
channels below.
Year Wise FPI Investments in Debt (INR billion)
FPI Investments G-Secs Corporate Bonds SDL
Mar-14 847 840 0
Jun-14 1052 915 0
Sep-14 1396 116 0
Dec-14 1503 1438 0
Mar-15 1529 1890 0
Jun-15 1516 191 0
Sep-15 1528 1869 0
Dec-15 1617 1793 36
Mar-16 1657 1689 45
Jun-16 1645 1613 39
Sep-16 1804 1704 15
Dec-16 1508 1621 11
Table 8: Year Wise FPI Investments in Debt
Source: NSDL
Page 17FPI % Holdings in G-Sec
4.5
4
3.5
3
2.5
2
1.5
1
0.5
0
May-14
May-15
May-16
Jan-14
Mar-14
Jan-15
Mar-15
Jan-16
Mar-16
Sep-13
Nov-13
Jul-14
Sep-14
Nov-14
Jul-15
Sep-15
Nov-15
Jul-16
Sep-16
Nov-16
Table 9: FPI % Holdings in G-Sec
Source: RBI
Ownership Pattern in Government Securities
Over the last three years we have seen reduced ownership in government bonds by commercial banks.
This has been as a result of SLR cuts by RBI. The SLR or “Statutory Liquidity Ratio” is a requirement for
all regulated banking entities to invest a certain proportion of their total assets in G-Secs. This ratio
has varied over the years but in recent years, the trend has been down. SLR rates have been reduced
by 25 bp every quarter starting from April 2016. One of our key advocacy points has been for a
reduction in the SLR, which has indeed come down over the years to 20.8% currently, from levels in
excess of 38% a few years ago. Nevertheless, the continuing large government fiscal deficits will tend
to limit the extent to which SLRs can fall. On the other hand RBI has gradually opened FPI limits which
have increased FPI participation and ownership since the last three years. FPI holdings have increased
from 1.4% in September 2013 to 3.13% in December 2016.
Yet another factor worth noting is that FPI investments in the Indian bond markets overall (and not
just in the G-Secs market) would receive a significant boost is if India is included in the major bond
indices (specifically the JPM EM bond index). Thus, India should strive to be included in the relevant
bond indices globally, more so as the world is moving towards “passive indexing” as the dominant
investment philosophy. This is an effective way of not only attracting but also retaining funds in India
as these are “long-term” flows and not hot money.
Page 18Holding Pattern in G-Secs
% Holding in G-Secs 2014 2015 2016
Commercial Banks 42.77 43.59 40.92
Non-Bank PDs 0.34 0.35 0.28
Insurance Companies 21.02 21.9 22.55
Mutual Funds 1.68 2.52 1.96
Co-operative Banks 2.57 2.71 2.63
Financial Institutions 0.73 0.68 0.86
Corporates 1.12 0.86 1.05
Foreign Portfolio Investors 3.62 3.68 3.13
Provident Funds 7.47 7.11 6.24
RBI 14.5 12.07 14.61
Others 4.18 4.51 5.77
State Governments 0 0 1.8
Dec 2014
4.18 0
14.5
42.77
3.62 7.47
1.12
0.73
2.57
1.68 21.02
0.34
1 Commercial Banks 2 Non-Bank PDs 3 Insurance Companies
4 Mutual Funds 5 Co-operative Banks 6 Financial Institutions
7 Corporates 8 Foreign Portfolio Investors 9 Provident Funds
10 RBI 11 Others State Governments
Page 19Dec 2015
4.51 0
12.07
7.11 43.59
3.68
0.86
0.68
2.71
2.52
21.9
0.35
1 Commercial Banks 2 Non-Bank PDs 3 Insurance Companies
4 Mutual Funds 5 Co-operative Banks 6 Financial Institutions
7 Corporates 8 Foreign Portfolio Investors 9 Provident Funds
10 RBI 11 Others State Governments
Dec 2016
1.8
5.77
14.61
40.92
6.24
3.13
1.05
0.86 2.63
22.55
1.96 0.28
1 Commercial Banks 2 Non-Bank PDs 3 Insurance Companies
4 Mutual Funds 5 Co-operative Banks 6 Financial Institutions
7 Corporates 8 Foreign Portfolio Investors 9 Provident Funds
10 RBI 11 Others State Governments
Table 10: Holding pattern in G-Secs
Source: RBI
Page 206. Introduction of New Products - Development of Derivative Markets
In our 2013 report, ASIFMA had advocated for the development of futures, swaps and derivatives
markets, to effectively complement the cash bond markets. Over the last 4-5 years, significant
developments have occurred in this regard, with the establishment of interest rate futures markets
traded on the exchanges and the trading of INR interest rate derivatives introduced on the CCIL.
Exchange now offers futures on 5, 10 and 13-year G-Secs and 91-day treasury bills. These instruments
are cash-settled and can be used for hedging the risk arising from interest rate movements as well as
for trading. There have been significant developments in the Interest Rate Futures (IRF) market over
the past few years with futures being introduced on the 5y and 15y on-the-run bonds in 2015 in
addition to the future on 10y bonds. The near month maturity IRF on the 10y benchmark bond
continues to be the most traded future and accounts for the majority of volumes. After a weak start
of IRF market in 2003 there was a significant push from RBI to make the market more liquid and robust.
The total value traded increased from January 2014 and continued to increase in 2015. However, the
total value traded has decreased in 2016.
Total Value Traded in NSE IRF Market (INR billion)
Total Value Traded
2014 2967.8
2015 5832.85
2016 3156.78
Table 11: Total Value Traded in NSE IRF Market
Source: NSE
The other active segment in the derivative market is interest rate swaps. Recently CCIL has launched
ASTROID – Anonymous System for Trading in Rupee OTC Interest Rate derivatives. This platform was
launched in August 2015 and offers trading in MIBOR from 1 month up to 10 years. The swaps traded
on ASTROID are guaranteed from the point of trade. The trades executed on this platform are linked
to CCIL’s clearing and settlement system for rupee Overnight Index Swap (OIS) trades. The volumes
on ASTROID platform have picked up since inception; however it continues to be low compared to the
traditional platforms. The volumes in the OIS market have also decreased over the years as is evident
from the table below.
Interest Rate Swaps Transactions (INR billion)
No of Trades Notional Amount
2007-08 79,495 47,281
2008-09 40,912 26,448
2009-10 20,352 14,521
2010-11 33,057 23,597
2011-12 33,642 24,510
2012-13 22,713 20,216
2013-14 25,514 22,967
Page 212014-15 21,153 20,292
2015-16 20,746 21,329
Table 12: Interest Rate Swaps Transactions
Source: CCIL
7. Corporate Bonds: Evolution of the Secondary and Primary Markets
While the corporate bond market is small as compared to the government bond market, the growth
seen in this space is worth noting. Historically, corporates have primarily depended on banks for their
sources of funding. With banks taking a back seat due to various issues like high cost of funds, Non-
Performing Assets (NPAs), stress in the balance sheet, etc., better rated corporates started tapping
the bond markets because of the lower cost of funding in these markets. Lower deposit rates, the lack
of tax free bonds, tax efficient return from debt funds ensured large flow of funds into their debt
schemes. This phenomenon continued over the last few years and as a result we see much more liquid
and vibrant credit markets. We have seen a substantial growth in the corporate bond market – over
35% Compound Annual Growth Rate (CAGR) in last 7 years. FY 2013-2014 was abnormal when RBI
hiked overnight rates to defend the currency and most of the issuers went back to the loan markets.
The issuance of corporate bonds in the year 2015-2016 was lower because of the absence of large
power sector financing companies because of the implementation of the “Ujjwal DISCOM Assurance
Yojana” (UDAY) scheme by the Government of India, whereby State Electricity Boards converted their
loans to bonds. By way of further background, this scheme is aimed at the revival and revitalization of
the distressed State Electricity Distribution Companies (the so-called DISCOMs).
The recently concluded FY 2016-17 witnessed the highest ever total of funds raised through corporate
bonds through private placement, totaling INR 7,035bn. These funds were raised by a total of 661
institutions and corporates. Also, according to Prime Database, total public corporate bond issuance
through yearend March 2017 rose 51% yoy to USD 51bn.
Total Debt Private Placements (INR billion)
Year Amount % Change
2010-11 2,026
2011-12 2,592 28%
2012-13 3,528 36%
2013-14 2,879 -18%
2014-15 4,657 62%
2015-16 4,922 6%
2016-17 7,035 43%
Table 13: Total Debt Private Placements
Source: Prime Database
95% of the issuance happens in fixed rate bonds because of the demand for these bonds. The liquidity
of both floating rate and structured bonds is very poor in the secondary market, as a result of which
there are very few issuances.
Page 22The growth of debt mutual funds has played a large role in increasing the primary and secondary
volumes of corporate bond markets.
Growth in Debt Mutual Funds (INR billion)
Year Income Liquid fund Gilt Total Change
2012 2908.44 803.54 36.59 3748.57
2013 3959.85 933.92 80.74 4974.51 32.7%
2014 4606.71 1332.8 61.15 6000.66 20.6%
2015 5157.73 1625.62 146.14 6929.49 15.5%
2016 5654.59 1994.04 163.06 7811.69 12.7%
2017 7437.83 3140.86 148.75 10727.44 37.3%
Table 14: Growth in Debt Mutual Funds
Source AMFI
Debt Fund Deployment of Funds
Type of Instrument 2014 2015 2016 2017 YTD
Credit Products 75.0% 69.6% 73.4% 75.0%
Govt Bonds 12.2% 18.0% 16.8% 11.2%
Banks CD/FD 6.9% 7.7% 6.6% 6.9%
CBLO Others 5.8% 4.7% 3.1% 6.8%
Table 15: Debt Fund Deployment of Funds
Source: SEBI
The above table shows how debt mutual funds have been allocating funds into various assets classes.
On average, the allocation to credit products has been 75%.
Growth of Secondary Volumes for Corporate Bonds (INR billion)
Year No of Trades Value
2007-2008 19079 959
2008-2009 22683 1,482
2009-2010 38230 4,012
2010-2011 44060 6,053
2011-2012 51533 5,938
2012-2013 66383 7,386
2013-2014 70887 9,708
2014-2015 75791 10,913
2015-2016 70123 10,224
2016-2017 88495 14,707
Table 16: Growth of Secondary Volumes for Corporate Bonds
Source: SEBI
Page 23Percentage Break up by Issuer Type
Issuer Type 2012-13 2013-14 2014-15 2015-16 2016-17
Public Sector Financial Institutions 52.46% 53.49% 54.13% 40.56% 27.27%
State Financial Institutions 1.53% 0.55% 0.20% 0.00% 0.04%
Public Sector Undertakings 11.24% 11.53% 7.22% 6.56% 9.55%
State Level Undertakings 2.44% 1.36% 1.40% 4.85% 2.91%
Private Sector-NBFC & Others 32.33% 33.07% 37.05% 48.04% 60.23%
Table 17: percentage Break up by Issuer Type
Source: Prime Data base
Rating Profile of the Issuer
Rating 2012-13 2013-14 2014-15 2015-2016
AAA 64.32% 69.90% 64.79% 56.05%
AA+ 15.47% 13.55% 13.97% 11.05%
AA 7.21% 5.64% 5.63% 6.09%
AA- 4.69% 3.47% 6.09% 5.93%
Others 8.32% 7.44% 9.52% 20.88%
Table 18: Rating Profile of the Issuer
Source: Prime Data base
Historically 80% of the issuance used to be in the AAA and AA+ categories, but this trend has been
changing recently with mutual funds starting credit funds comprising of lower rated bonds, as lower
rated corporates looking to tap corporate bond markets have tended to move away from banking
loans which are very expensive. Moreover, with bank NPLs growing and capital charges on bank loans
to lower-rated companies becoming onerous, corporates have no recourse but to turn to the
corporate bond market.
Certificates of Deposit (CD) and Commercial Paper (CP) Issuances
As the credit growth slowed down in India, we saw CD issuance drop drastically. But, at the same
time, with banks taking long time in transmitting the rates cuts from RBI, we saw more and more
corporates tapping the CP market.
CD and CP Issuances (INR billion)
Date CP Outstanding % Change CD Outstanding % Change Total % Change
2012 911.9 4195.3 5107.2
2013 1092.6 19.8% 3896.1 -7.1% 4988.7 -2.3%
2014 1066.1 -2.4% 3758 -3.5% 4824.1 -3.3%
2015 1932.7 81.3% 2809.7 -25.2% 4742.4 -1.7%
2016 2602.4 34.7% 2105.9 -25.0% 4708.3 -0.7%
2017 3979.7 52.9% 1557.4 -26.0% 5537.1 17.6%
Table 19: CD and CP Issuances
Source: RBI
Page 248. Corporate Bonds: New Endeavours
As mentioned above, the corporate sector relies too heavily on banks for lending and raising funds to
finance their business going forward. Everyone, including the RBI, understands that developing a
strong and sound corporate bond market will alleviate the pressure on banks and provide corporations
an alternative way to finance themselves. Further, not only does a strong corporate bond market
foster healthy competition, the transparency of corporate bond markets will also force corporations
to respond directly to the concerns of investors and stakeholders. This will in turn facilitate the
development of a deep corporate bond market which will improve the corporate governance,
efficiency and discipline within the corporate sector.
Given this, the Indian regulatory authorities have greatly increased incentives for corporate bond
issuance. These include the granting of permission to banks to issue lower-rated bonds that are Basel
3 compliant (AT1 and Upper T1 & T2 issuance) to shore up capital, the liberalization of FPI limits to
invest in domestic corporate bonds, creating a framework for institutional investors to invest in real
estate & infrastructure trusts and the introduction of offshore INR bonds or Masala bonds, described
below:
Introduction of New Products: Masala Bonds
Masala bond is a - INR denominated, euro-clearable, any currency settled (currency risk lies with the
investors) bond issued offshore. It was introduced in 2016 and so far, has already seen an issuance of
INR 200bn – refer Table 20.
Masala Bond Issuance (INR billion)
Issuer Name Cpn Issue Date Maturity Amount Issued
Housing Development Finance Corp Ltd 7.88 21/07/2016 21/08/2019 30.00
Adani Transmission Ltd 9.1 29/07/2016 29/07/2021 5.00
NTPC Ltd 7.38 10/08/2016 10/08/2021 20.00
Housing Development Finance Corp Ltd 7 09/09/2016 09/01/2020 20.00
Indiabulls Housing Finance Ltd 8.57 15/09/2016 15/10/2019 13.30
Fullerton India Credit Co Ltd 8.13 24/10/2016 24/11/2019 5.00
ECL Finance Ltd 9.05 28/10/2016 28/12/2019 5.02
Shriram Transport Finance Co Ltd 8.25 18/01/2017 18/02/2020 11.50
Housing Development Finance Corp Ltd 6.88 30/03/2017 30/04/2020 33.00
NTPC Ltd 7.25 03/05/2017 03/05/2022 20.00
National Highways Authority of India 7.3 18/05/2017 18/05/2022 30.00
192.82
Table 20: Masala Bond Issuance
Source: Nomura
Masala bonds are an excellent product for the investors as it allows them to: a) invest in INR corporate
bond risk without having to go through the cumbersome FPI route (and thus no need to apply for a
license); b) since Masala bonds are repo-able, they can take leverage against it, thereby enhancing
Page 25their returns; c) these bonds are euro-clearable and hence allow for an opportunity for multi-currency
settlement.
For issuers, while they have to bear 15-20bps additional cost to their equivalent onshore issuance (as
5% withholding tax (WHT) is paid by the issuer in this case), such costs should actually be compared
against the more costly USD / EUR MTN where they run currency risk and pay high hedging cost. Also,
this allows them to tap into a completely new and diversified set of customer base.
Further, as corporate bond limits get filled – given the current run rate – this may allow offshore
investors to still fund onshore corporates. The legal and regulatory framework around Masala bonds
(and some of the more recent changes to this framework), are discussed in Section E below.
Additionally, a comprehensive overview of the entire Masala bond framework including an exhaustive
analysis of investor access channels and the tax framework can be found in Section F and Annexure B
respectively.
Other Work-In-Progress Potential Measures
The H R Khan working group on development of corporate bonds in India made many
recommendations which have been partially implemented and some are work-in-progress.
Some of the key recommendations are:
1. Reissuance of bond by frequent issuers to improve the liquidity of the ISINs. For more on this
topic see the “Proposals of SEBI for developing the Indian bond market” in Section C below.
2. FPIs are now allowed to invest in unlisted bonds of issuers who will not use those funds for
real estate and capital markets exposure.
3. Electronic book of private placement of bonds has been introduced by the exchanges and has
been operating successfully.
4. Uniform valuations guidelines across regulators for valuation of corporate portfolios of
different investors class like banks, mutual funds, insurance companies are in the pipeline.
5. The introduction of DvP settlement for bonds traded OTC has been implemented.
Repo in corporate bonds through an electronic platform operated by Central Counterparties (CCPs) is
one of the key reforms in progress.
9. Securitisation and Covered Bond Market (ASIFMA)
A well-regulated securitisation system is commonly recognized as an efficient financing mechanism
for mortgage financing, credit cards, auto loans and even infrastructure enhancements and municipal
expansion. Covered bonds and high quality securitisations are a means of tapping the capital markets
for funding, backed by pools of good quality assets. Under the securitisation model, loans are issued
by an originator (typically a commercial bank), and then aggregated and packaged into multiple
securities with different characteristics of risk and return that appeal to different investor classes.
Disclaimer (Nomura)
The information provided herein is only for your information and should not be relied upon for any other purpose. Under no circumstances shall Nomura have any liability whatsoever
for any information contained in the presentation or any reliance upon or otherwise resulting from or in connection with or relating to the use of (including the inability to use or the Page 26
misinterpretation of) the presentation. No representations, warranties or undertakings (express or implied) are made and no responsibility is accepted by Nomura as to the accuracy or
validity of the information in the presentation. The expression "Nomura" refers to Nomura Fixed Income Securities Private Limited together with it affiliates.The development of securitisation of non-performing assets in India received a major boost over the
2002-05 period, following the enactment of the Securitisation and Reconstruction of Financial Assets
& enforcement of Securities Interest Act (SARFAESI), 2002 (‘the Act’) 1. The Act encompasses the areas
of: securitization of financial assets; reconstruction of non-performing financial assets; recognition to
any security interest created for due repayment of a loan as security interest under the Securitisation
Act, irrespective of its form; banks and financial institutions have the power to enforce the security
without intervention of the courts; setting up the Central Registry for registration of the transaction
of securitisation, reconstruction and creation of security interests.
One specificity and problem with securitisation in India is that securitisations follow a trust structure
i.e. the assets are transferred by way of sale to a trustee, who holds it in trust for the investors. In this
situation, a trust is not a legal entity in law but it is entitled to hold property that is distinct from the
property of the trustee. Therefore, the trust performs the role of the Special Purpose Vehicles (SPV),
without having the legal status of an SPV.
Market Developments
Growth in Residential Mortgage Backed Securities (RMBS), Mortgage-Backed Securities (MBS) and
Collateralized Debt Obligations (CDOs) fueled the rapid growth of the securitisation market through
2005, as new classes of investors and issuers gained confidence in the stability of and prospects for
the further development of the market. Furthermore, investor familiarity with the underlying asset
classes, stability in the performance of past pools and the relatively short tenor of issuances also
helped boost the market.
After a brief dip in 2006, caused by the tightening of capital requirements, strong growth in ABS and
CDO volumes boosted the Indian securitization market through the first half of 2009, when the after-
effects of the global financial crisis did have a negative impact. Even so, the absence of transactions
involving complex derivatives and CDS in the Indian context meant that Indian securitization volumes
did stay relatively robust, in the immediate aftermath of the financial crisis.
The structured issuance volumes have grown considerably in the last few years in India. ABS is the
largest product class driven by the growing retail loan portfolio of banks and other Financial
Institutions (FIs), investors’ familiarity with the underlying assets and the short maturity period of
these loans. The MBS market has been rather slow in taking off despite a growing housing finance
market due to the long maturity periods, lack of secondary market liquidity and the risk arising from
prepayment/repricing of the underlying loan.
During FY2014, the overall securitisation market (including rated bilateral transactions) in India shrunk
further by 5% over the previous year, in value terms. The number of transactions was also lower by
4% in FY2013 than that in the previous fiscal year. While the number and volume of ABS transactions
declined by about 14%, the number of RMBS transactions more than doubled in FY2014, (an increase
of 75% in value terms).
Page 27You can also read