The Finnish Property Market | 2018 - KTI Kiinteistötieto Oy
←
→
Page content transcription
If your browser does not render page correctly, please read the page content below
2
    2 Institutional aspects of the Finnish property market

                                                             The Finnish Property Market | 2018

The Finnish Property Market | 2018
Contents

Preface                                                                              7

1 The Finnish economy                                                                8
  1.1 The structure of the economy                                                   8
  1.2 Outlook for the Finnish economy                                               10
  1.3 Finnish public finances                                                       12
  1.4 Finland’s international competitiveness                                       15
  1.5 Main city regions in Finland                                                  17

2 Institutional aspects of the Finnish property market                              19
  2.1 Two forms of property ownership                                               19
  2.2 Market practices of property investment and renting                           20
  2.3 Planning                                                                      22
  2.4 Taxation in Finland                                                           23
  2.5 Legislation for indirect property investment                                  26

3 The Finnish property investment market: volumes, structure and players            28
  3.1 Investment market in 2017                                                     28
  3.2 Ownership structure                                                           29
  3.3 Real estate service sector                                                    40

4 Property sectors: market structure, practises and investment performance          44
  4.1 The office market                                                             44
  4.2 The retail market                                                             49
  4.3 Rental residential sector                                                     54
  4.4 Public use properties                                                         59
  4.5 Industrial / logistics market                                                 61
  4.6 Hotels                                                                        63

5 Property markets in different regions – outlook for 2018                          64
  5.1 The Helsinki metropolitan area                                                64
      5.1.1 Helsinki                                                                66
      5.1.2 Espoo                                                                   71
      5.1.3 Vantaa                                                                  74
      5.2 Other growth centres: Tampere, Oulu, Turku, Jyväskylä, Lahti and Kuopio   76

The sponsors of this publication                                                    83

                                                                                         6
Preface
The Finnish Property Market 2018 discusses the structure, players, market practices and conditions in the
Finnish property investment market. The report aims to satisfy the information needs of international
investors and other players interested in the Finnish market.

The report is published annually in March. The report is also available in PDF format at www.kti.fi.

KTI Finland also publishes an electronic newsletter twice a month. Finnish Property News covers the
latest news from the Finnish property market. To receive this newsletter via e-mail, please subscribe to
it at www.kti.fi.

This publication is sponsored by 11 companies and organisations representing the Finnish property
investment, development, management, finance and advisory sectors. KTI wishes to thank our
sponsors: The City of Helsinki, Colliers International Finland, KIINKO Real Estate Education,
LocalTapiola, Newsec, RAKLI, SATO, SEB Group, Sirius Capital Partners, Skanska and YIT.

The report provides a comprehensive overview of the Finnish property market. KTI Finland can also
provide more detailed information and analysis on the individual sub-markets for specific needs, upon
request.

We hope you find the report interesting, relevant and worthwhile reading.

Hanna Kaleva
KTI Finland

KTI Finland is an independent research organisation and service company providing information and research services for the
Finnish real estate industry. KTI maintains extensive databases on returns, rents, transactions, operating costs and customer
satisfaction measures in the Finnish property market. Based on these databases, various kinds of benchmarking and analysis
services can be provided. For more information, please call +358 20 7430 130 or visit www.kti.fi.

                                                                                                                                8
Basic facts about Finland 1 The Finnish economy
GEOGRAPHY
1.1 The structure of the economy
Total area 338,000 square kilometres
Distances 1,160 km north to south Finland is an open, well-functioning and stable economy,
540 km east to west where strong growth, innovation and structural reforms
transformed the country into one of the world’s most
PEOPLE competitive economies during the late 1990’s and early 2000’s.
Population 5.51 million
Services are currently the biggest sector of the Finnish
Density: 18 inhabitants per square
economy, and account for some two thirds of the Finnish
kilometre
GDP. Private services make up some 75 per cent of all
Helsinki 2,984 per square kilometre
services, the most important sectors being information
Uusimaa region (southern Finland):
and communication, administration and support, trade,
170 per square kilometre
transportation, as well as hospitality services.
Lappi region (northern Finland):
2 per square kilometre
Growth of industrial production has had a great impact
Languages Two official languages: on the development of the Finnish economy during the
Finnish, spoken by 88.3% past decades. However, during the past years, share of
Swedish, spoken by 5.3% industrial production has decreased, while that of services
Foreign languages spoken by 6.4% has increased. In 2000, industrial production accounted for
Religions Lutheran 71.0% 30 per cent of the Finnish GDP, and, by 2016, its share had
Orthodox 1.1% fallen to some 20 per cent.
Capital city Helsinki, 642,000 inhabitants
In 2016, the biggest industrial sector was metal industries,
Helsinki region, 1.5 million inhabitants
which accounted for some 40% of the total industrial
comprising Helsinki and 13
production. The biggest categories within metal
neighbouring municipalities – Espoo
industries include mechanical engineering, electronics and
and Vantaa being the biggest
electrotechnical industry, metals industry and information
Other important Espoo, 277,000 technology industries. Chemical and forestry industries
cities Tampere, 230,000 both accounted for approximately 20% of total industrial
Vantaa, 222,000 production.
Oulu, 201,000
Turku, 189,000 Finland is an export driven economy, and changes in exports
Jyväskylä, 139,000 have a profound impact on the economic development. In
Lahti, 119,000 2016, exports accounted for some 35 per cent of the GDP, and
Kuopio, 118,000 some 22 per cent of the domestic value added (gross value
deducted by the value of imported intermediate goods). The
ECONOMY
diversity of Finnish exports has increased in recent years. In
GDP per capita €39,236 (2016) 2016, chemical industries accounted for some 19 per cent
of the total exports of goods. Other important exporting
Most important Chemical industry products
industries include forestry and paper (17%), metal and metal
exporting indus- Forest and paper industry products
products (14%), machinery and equipment (13%), as well as
tries Metal and engineering products
electrotechnical industries (12%). A large share of Finnish
Machinery and equipment
exports are investment goods, and, therefore, the growth
Electronics and electrotechnical
in global economy is crucial with regard to the demand for
goods
Finnish exports.
Currency Euro (since 2002)
History and Independent democracy since 1917
“The share of services of the
governance
Finnish GDP is increasing”
Member of the European Union since
1995
Head of State President of Republic, Sauli Niinistö The share of services of total exports has increased steadily
1 The Finnish economy
(since 2012, re-elected in 2018) in recent years. The significance of services is highlighted by
Parliament One chamber, 200 members, elected the fact that the share of domestic value added is typically
for 4 years. markedly higher than in traditional manufacturing industries
Current parliament elected in 2015. where value added is partly based on imported intermediate
Biggest parties: The Center Party goods. According to a recent study conducted by Aalto
(49 seats), The National Coalition University, ETLA, University of Helsinki and VATT
Party (38), The Social Democratic Institute of Economic Research, services accounted for
Party (35), Blue Reform Parliamentary some 36 per cent of the combined domestic value added
Group (19), The Finns Party (17). of Finnish exports in 2016. The biggest sector in services
9 is IT services, which accounted for some 11 per cent of the
Finnish economic structure
2016
2015
2014
2013
2012
2011
2010
2005
2000
1995
1990
1985
1980
1975
0 10 20 30 40 50 60 70 80 90100
%
Primary production Manufacturing Construction Public services Private services
Source: Statistics Finland
total domestic value added of exports. This is the second In 2017, the total volume of the Finnish exports increased
biggest share among all exporting business sectors after significantly. Between January and November, the volume
forestry industries (13%). Other significant exporting service of total exports of goods was 16 per cent higher than in the
industries include business to business services like research, corresponding period in 2016. Within the three first quarters
engineering or marketing services, as well as installation of the year, exports of services increased by 8 per cent.
and maintenance services related to Finnish machinery and
equipment deliveries.
“The volume of Finnish
“The economic outlook is exports increased
positive in all important significantly in 2017”
target countries for Finnish
exports” More than two thirds of Finnish exports go to other
European countries. The most important target countries
of Finnish exports include Germany (14%), Sweden (10%),
Finnish foreign trade by target area Finnish exports by industry sector
Electric and electronics industry products
Metal industry products
Sweden Russia Germany
Machinery and transport industry products
% USA The Netherlands
Forest industry products
16 Chemical industry products
% Other products
14 35
12 30
10
25
8
1 The Finnish economy
20
6
15
4
2 10
0 5
1-11/2017
1995
1996
1997
1998
1999
2000
2001
2002
2003
2004
2005
2006
2007
2008
2009
2010
2011
2012
2013
2014
2015
2016
1-11/2017
2000
2001
2002
2003
2004
2005
2006
2007
2008
2009
2010
2011
2012
2013
2014
2015
2016
Source: Finnish Customs Source: Finnish Customs
10
the Netherlands (7%), the USA (7%), China (6%) and Russia government initiated the so called Competitiveness Pact, the
(6%). Exports to Germany increased significantly in 2017, main objective of which is to support the competitiveness
mainly due to the growth in exports of cars. Also exports to of the Finnish exporting industries. The key contents of the
China increased, thanks to an increased demand for pulp. Pact included the lengthening of working hours by 24 hours
per year, zero wage increases for 2017 and the transfer of
some employer contributions to employees. In return, the
government committed to cutting some income tax and
“The competitiveness of the refraining from cutting any further public expenditures.
Finnish exporting industries Moderate wage increases have been extended to 2018 and
strengthened in 2017” 2019 with total increases of some 3.2 per cent for the two-
year period in most important exporting industries.
“Finnish economy grew by
1.2 Outlook for the Finnish economy more than 3% in 2017”
Finnish GDP growth remained sluggish for almost a whole
decade following the global financial crisis. However, in Due to increased competitiveness, the Finnish exporting
2017, the economy turned to a healthy growth path, with industries have gained market share within the past year,
GDP growth forecasts being increased throughout the year, and the growth has thus been stronger than in most other
and the final figure even exceeding expectations and ending countries. However, going forward, these advantages are
up to over 3 per cent. The absolute volume of production being mitigated, and the growth of the Finnish exports
is finally expected to reach and exceed the previous peak is expected to be more in line with the increase in global
level of 2008 in early 2018. demand. Exports will continue to be broadly based with cars,
metal products, paper and pulp products and raw materials
The current growth of the economy is broadly based all showing positive development. In 2018, the volume of
and well balanced with exports, private consumption and exports is expected to increase by some 4-5 per cent.
investments all showing significant increases, which are
expected to continue in 2018. Private consumption increased by some 2 per cent in 2017.
In 2018, the consumption is expected to be boosted by
The competitiveness of the Finnish exporting industries improving employment and increasing earnings. Consumer
remained weak for many years due to the increase in confidence has been strengthening rapidly, and in the latest
production costs and unfavourable structural changes in update in January 2018, the consumer confidence was at its
the economy. In recent years, however, competitiveness highest level ever. Also a low inflation rate is supporting
has been strengthened by more moderate labour cost private consumption. The forecasts for the increase in
development compared to the key competitive countries, private consumption for 2018 vary between 2 and 3 per cent.
as well as an increase in productivity. In 2016, the Finnish
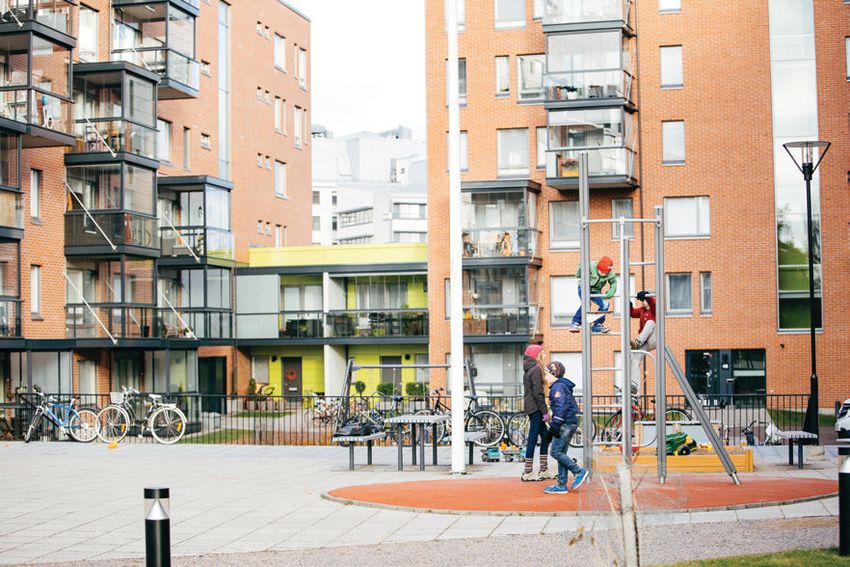
Photo: Skanska / © 2017, Kuvatoimisto Kuvio Oy
1 The Finnish economy
11GDP growth in Finland and in the Euro area
% Finland Euro area (19 countries)
8
6
4
2
0
-2
-4
-6
-8
-10
2015*
1990
1991
1992
1993
1994
1995
1996
1997
1998
1999
2000
2001
2002
2003
2004
2005
2006
2007
2008
2009
2010
2011
2012
2013
2014
2016*
2017**
2018**
2019**
*Preliminary **Forecast
Source: Eurostat, OECD, IMF, Ministry of Finance
Growth in construction investments was one of the main For 2018 and 2019, a stable growth is forecasted, with
drivers for the promising economic development, which annual GDP growth figures varying between 2 and 3%. The
started in 2016. During 2017, the positive economic outlook growth will be based on a continuous but slowing increase
enhanced investments also in other sectors, with total in consumption, exports and investments.
investment volume increasing by more than 10 per cent.
The growth in investments is expected to continue also
in 2018, with growth forecasts varying around 5 per cent.
Investments are supported by both low interest rates as well
“Improving employment
as by strong investment demand. critical for the sustainability
of economic growth”
“Economic growth is broadly Unemployment continued to decrease in 2017, with the
based with consumption, unemployment rate ending up to some 8.5%. So far,
exports and investments unused capacity and improving productivity have enabled
the growth in production, but in the future, improving
all showing positive economic conditions will also increase the demand for
development” labour. Unemployment is expected to decrease to some
8% in 2018 and even further in 2019. However, the mismatch
between the supply and demand for workforce makes a rapid
GDP in 2010 prices and GDP growth
EUR million GDP in 2010 prices GDP growth %
240,000 8
220,000 6
200,000 4
GDP in 2010 prices
180,000 2
GDP growth
160,000 0
140,000 -2
1 The Finnish economy
120,000 -4
100,000 -6
80,000 -8
60,000 -10
2015*
1985
1986
1987
1988
1989
1990
1991
1992
1993
1994
1995
1996
1997
1998
1999
2000
2001
2002
2003
2004
2005
2006
2007
2008
2009
2010
2011
2012
2013
2014
2016*
2017**
2018**
2019**
*Preliminary **Forecast
Source: Statistics Finland, Bank of Finland, Nordea 12decrease in unemployment unlikely. Demand for labour 1.3 Finnish public finances
is targeted at skilled people in the largest cities, whereas
unemployment is highest in rural areas and among the less Despite the more positive development and outlook for the
educated workforce. The amount of so called structural economy, Finnish public finances continue to face challenges.
unemployment is assessed to be as high as 7%. The government budget has been in deficit since 2009 and
is likely to remain negative until the end of this decade.
Inflation has remained very low in recent years. In 2017, This means that the absolute amount of general government
consumer prices increased by some 0.7 per cent. In 2018, debt continues to increase even though its relative share is
the inflation is expected to accelerate to some 1-1.5 per cent, expected to decrease thanks to the growth in GDP.
mainly due to price increases in services.
General government in Finland consists of the central
government, local government, and social security funds. Of
these three areas, the central government has shown the most
Consumer confidence indicator
Finland Euro area (19 countries)
40
30
20
10
0
-10
-20
-30
-40
2000
2001
2002
2003
2004
2005
2006
2007
2008
2009
2010
2011
2012
2013
2014
2015
2016
2017
2018
Source: European Commission
Unemployment rate in Finland and in the Euro area
% Finland Euro area (19 countries)
16
15
14
13
12
11
10
9
8
7
6
1996
1997
1998
1999
2000
2001
2002
2003
2004
2005
2006
2007
2008
2009
2010
2011
2012
2013
2014
2015
2016
2017
Source: Eurostat, Bank of Finland and Statistics Finland
Key figures – Finnish economy
1 The Finnish economy
2010 2011 2012 2013 2014 2015 2016 2017 2018** 2019**
GDP (change in vol), % 3.0 2.6 -1.4 -0.8 -0.6 0.1* 2.1* 3.2** 3.0 2.5
Change in exports, % 6.2 2.0 1.2 1.1 -2.7 0.9* 2.3* 8.4** 4.8 4.7
Inflation, % 1.2 3.4 2.8 1.5 1.0 -0.2 0.4 0.7 1.0 1.2
Unemployment rate, % 8.4 7.8 7.7 8.2 8.7 9.4 8.8 8.5 8.0 7.5
Private consumption, % 3.1 2.9 0.3 -0.5 0.6 1.9 1.9 1.9 2.9 2.8
13 *Estimate **Forecast Source: Statistics Finland, Ministry of Finance, NordeaMain components of demand
Volume index 1990=100, seasonally adjusted
Exports Total demand Consumption Investment
500
400
300
200
100
0
1990
1991
1992
1993
1994
1995
1996
1997
1998
1999
2000
2001
2002
2003
2004
2005
2006
2007
2008
2009
2010
2011
2012
2013
2014
2015
2016
2017
Source: Statistics Finland
negative development in recent years due to its sensitivity The Finnish welfare society is largely based on a
to cyclical fluctuations in tax revenue. Local government comprehensive supply of public services, including, for
balance has also turned negative and is expected to remain instance, free education and healthcare, social support for
so until the end of the decade. Of the social security funds, families in the forms of child allowances for all families and
pension related funds remain in a slight surplus thanks to municipal day-care provision, which is widely used in all
their consistent revenue from both pension payments of the income categories. Extensive public responsibility and tax
Finnish workforce and investment income. funding are the cornerstones of the Finnish social welfare
society. As a result, government expenditure currently
Finland’s general government deficit decreased to 1.1% in accounts for some 54% of total production.
2017 despite some increasing public costs included in the
Competitiveness Pact. In 2018, the deficit is expected to Funding of the welfare society is largely based on a high level
decrease further to some 0.7%, supported by the economic of taxation. The current government has been determined
growth and increasing tax revenues. to decrease the income tax rate, partly in order to enable
moderate wage increases in the labour markets and to
support the international competitiveness of the exporting
“General government industries. Despite the slight decrease in recent years, the tax
rate in Finland is among the highest in the OECD countries,
deficit is decreasing due to and stood at 44% of GDP in 2016. This was only exceeded by
enhancing economic growth” Denmark, France and Belgium. In 2017, the Finnish tax rate
decreased to 43.2% and is expected to continue decreasing
to some 42% in the coming years.
The amount of government debt exceeded the threshold
of 60% of the GDP in 2015, ending at some 63%. Thanks Finnish municipalities currently have a significant role in
to the positive development of the economy, the ratio has public services. In the Finnish system, the central government
decreased in 2016 and 2017, and ended up to some 62.5% sets the framework and basic principles of social welfare
at the end of 2017. The debt ratio is expected to continue and monitors their implementation, and most of the actual
decreasing in the coming years and to fall below 60% in provision of social welfare is carried out at the local level, in
2019. However, as the nominal amount of debt continues to municipalities. Municipalities are responsible for the majority
increase, the resilience of the economy will not be very high of, for instance, education, healthcare and social services.
when the economic conditions potentially start weakening
again in 2020’s. There are currently 311 municipalities in Finland.
Municipalities differ from each other significantly with
Strengthening the public economy requires some structural regard to their size, economic structure and financial
reforms. Public spending will be increased as the ageing of position. The smallest municipalities are typically currently
1 The Finnish economy
the population increases pension payments and healthcare facing the biggest economic challenges due to a negative
expenses. The objective of the current government is to migration balance and an ageing population, which increases
cut public expenses by increasing productivity or reducing the cost burden in healthcare services. Therefore, structural
service levels rather than increase taxes. reforms in the municipalities’ responsibilities are essential
in ensuring the sustainability of Finnish public finances.
“General government debt
expected to fall below 60% “A major reform in regional
in 2019” government underway”
14Photo: YIT
One of the most significant reforms in the current One of the most discussed topics around the reform is the
government’s agenda is the restructuring of the management freedom of choice for citizens between public and private
and provision of social and healthcare services. The service providers. This has also been one of the main
reform also includes profound development of the regional reasons for the delay of the reform. The renewed legislation
government structure. The organisation of healthcare and concerning this is expected to be submitted to the Parliament
social services will be transferred from municipalities to 18 in early 2018, and to come into force in the summer. In
self-governing counties. The reform is one of the biggest this case, the counties would start their operations in the
ever administrative restructurings in Finnish history. In beginning of 2019, and take responsibility of services in
addition to healthcare and social services, the new counties 2020. However, the clients’ freedom of choice is planned
will be responsible for rescue services, environmental to be extended in phases starting in 2020.
issues, regional development duties and tasks related to the
promotion of business enterprise, planning and steering of Together with the municipalities’ willingness to reorganise
the use of regions and promoting the identity and culture their operations, the planned reform has already significantly
of the counties. The reform has been delayed due to various increased the supply of private sector healthcare services.
political and constitutional law challenges in legislative The private sector currently accounts for some 25% of
processes and is currently planned to come into force in healthcare and social services. The increase in private
the beginning of 2020, and the first county elections to be sector service provision also opens up new opportunities
held in October 2018. for property investors offering premises for these companies.
The reform will also impact the ownership and financing
of public healthcare properties. Most of these properties
“Healthcare and social are currently owned by the Finnish municipalities or
service reform to come into municipal federations. A separate company, Maakuntien
Tilakeskus Oy, has been established to own and manage
force in 2020” the properties currently owned by municipal federations,
comprising mainly large central hospitals. The company
will also manage all lease agreements of the properties that
The main objectives of the healthcare and social service municipalities have rented from private landlords.
reform include improved control over the increasing costs of
services. Productivity of the services is expected to increase
1 The Finnish economy
through centralised management, increased competition, “The service reform will
as well as digitalisation and improved information systems
for healthcare service providers. The total targeted savings have a significant impact on
amounts to some €3 billion by 2029. This would require the healthcare properties”
growth rate of expenditure to decrease from its current level
of 2.4% p.a. to 0.9%.
15In addition, the counties will rent all the properties In the ranking, Finland was ranked first with regard to the
currently owned and operated by the municipalities for functioning of the institutional framework, as well as in
a transition period of three years. A major survey of the health and primary education. In the higher education
premises currently used by the municipalities is underway, and training pillar, Finland was in the second position, and
and according to the current estimates, the counties will with regard to the development of the financial market,
rent some 7000 premises comprising over 6 million square Finland was ranked fourth. Of the assessed pillars, Finland
metres from the municipalities for this initial period. After performed worst with regard to market size, infrastructure
this, the counties will define the premises needed for their and macroeconomic environment. Restrictive labor
service provision in the longer term. It is expected that a regulation was also identified as one problematic factor for
portion of the current properties will not be needed by the doing business. In another WEF comparison, the Travel and
counties, and would thus be left vacant after the transition Tourism Competitiveness report 2017, Finland was ranked
period. However, the amount of excess space and its impact first in Safety and Security subindex.
on the municipalities’ finances is yet to be defined.
1.4 Finland’s international “Finland retained its
competitiveness 10th position in World
Economic Forum’s Global
Finland retains its good position in many international Competitiveness Index”
rankings that look at various indicators regarding the
competitiveness of the economy as well as overall welfare
of citizens.
In IMD’s World Competitiveness Ranking of 2017, Finland
The long-term credit ratings for Finland remain strong, was upgraded to the 15th position after having been in the
although they have deteriorated slightly recently. Standard 20th place in 2016. In this ranking, Denmark (7), Sweden
& Poor’s, Moody’s, as well as Fitch have all rated Finland in (9), and Norway (11) all outperform Finland. However, in
the second best category, at AA+ / AA1, and all consider the IMD’s separate ranking report on digital competitiveness,
outlook as “stable”. Finland’s strong institutions and highly Finland was in the 4th position, showing an improvement
skilled workforce are appreciated by the rating agencies. of two places since 2016.
On the other hand, the deficit and increasing indebtness of
public finances have deteriorated the outlook in recent years. Finland is known as one of the least corrupt countries in
In current conditions, the Finnish government continues to the world. In Transparency International’s Global Corruption
be able to acquire funding at a very low cost. Perceptions Index for 2016, Finland was ranked third among
176 countries, after Denmark and New Zealand. The
report identified strong access to information systems, rules
governing the behaviour of those in public positions and
“The credit ratings of the transparency of institutions as the factors differentiating
Finnish state remain strong” the winners from other countries. In The Fund for Peace’s
Fragile State Index 2017, Finland was assessed to be the most
stable country in the world.
In the latest World Economic Forum’s Global Competitiveness Report,
published in September 2017, Finland retained its tenth Among the global capitals, Helsinki typically performs
position among the 137 evaluated countries. Of the other well with regard to its business environment as well as
Nordic countries, Sweden continued to outperform Finland, living conditions. For instance, The Financial Times ranks
whereas Norway and Denmark followed Finland in 11th and Helsinki 6th in its ranking of “Global cities of the future”,
12th positions, respectively.
The most competitive national economies in 2018 (ranking in 2017)
GCI 2018 score
Switzerland (1.)
United States (3.)
Singapore (2.)
The Netherlands (4.)
1 The Finnish economy
Germany (5.)
Hong Kong (9.)
Sweden (6.)
United Kingdom (7.)
Japan (8.)
Finland (10.)
5.0 5.1 5.2 5.3 5.4 5.5 5.6 5.7 5.8 5.9 6.0
Source: World Economic Forum 16where the cities’ ability to attract global innovation capital Helsinki also ranks well in comparisons in liveability
is assessed. In INSEAD’s ranking of the cities’ ability to among the global cities. In Economist Intelligence Unit’s
attract and retain talented workforce (The Global City Global Liveable Cities, Helsinki was ranked 9th among
Talent Competitiveness Index GTCI), Helsinki was ranked 140 cities. In this comparison, Helsinki received full scores
3rd among 46 cities. (100) in stability and healthcare, and also performed well
in infrastructure. InterNations ranks Helsinki in first place
in its Family Life Index, which looks at the quality of life
“Finland remains one of the from the point of view of families moving to Finland from
least corrupt countries in the abroad. In The Telegraph’s comparison of the cleanest
world” capitals, Helsinki was ranked 8th.
These rankings illustrate Finland’s reputation as a respected
Nordic welfare economy where political and economical
Finland, together with other Nordic countries, typically stability, transparent regulatory framework and high-quality
performs well in international rankings assessing quality education and healthcare support business and living. The
of living. In the Social Progress Index published in summer not-so-positive characteristics of Finland, from a business
2017, Finland ranked second after Denmark. Finland was perspective in particular, mostly deal with the small size of
the top performing nation in 16 out of the 50 indicators the market. High tax rates and restrictive labour regulations
assessed in the index, including, for instance, personal are commonly regarded as the main weaknesses of Finland.
freedom and choice, nutrition and basic medical care. The
poorest rankings came from health and wellness due to a
high suicide rate, and lower than expected life expectancy,
as well as from poor gender parity in secondary school “Helsinki ranks well in
enrolment. In OECD’s Better Life Index 2017, Finland was
ranked ninth. In this comparison, the strengths of Finland comparisons concerning
include, for example, the quality and accessibility of the liveability ”
education system, environmental quality, safety and the
overall life satisfaction of citizens. The overall business environment is also reflected in the
comparisons conducted in the property markets. The Finnish
property market is regarded as one of the most transparent
“Security, cleanliness and in the world. JLL’s Global Real Estate Transparency Index
a high-quality education of 2016 ranked Finland among the six “highly transparent”
system are highly appreciated European markets.
in international comparisons” In Pricewaterhouse Cooper’s and Urban Land Institute’s
report Emerging Trends in Real Estate Europe 2018, Helsinki
retained its 18th place. The prospects for investment remain
Also in Eurostat’s comparisons of quality of life, Finland’s rather strong, whereas those for property development are
overall life satisfaction was ranked in the top three among 28 regarded as “fair”. In this report, both rents and capital values
EU countries. Other aspects where Finland performs well in are expected to remain stable in 2018.
this comparison include housing conditions, job satisfaction,
education and environment.
OECD Better Life Index 2017
– Finland – OECD – Other Nordics
1 The Finnish economy
17 Source: OECD Economic Survey of Finland 2016Main city regions in Finland
Additions to the map by
KTI. OpenStreetMap
Finland web services
Map: Ministry of
Education and Culture.
Data: OpenStreetMap
contributors. Statistics
Finland Open data.
Licensed under CC BY 4.0.
1.5 Main city regions in Finland There are four city regions with more than 250,000
inhabitants: Helsinki, Tampere, Turku and Oulu. These
Urbanisation has proceeded fast in Finland in recent years. regions generally perform well and show strong economic
In 1990, some 60% of the Finnish population lived in urban development and population growth. The second tier of
areas, and by 2016, some 69% of the Finnish population city regions – those with more than or about 100,000
lived in the 14 biggest city regions. By 2040, their share is inhabitants – include 10 regions: Lahti, Jyväskylä, Pori,
expected to increase to at least 75%. These 14 biggest city Kuopio, Joensuu, Seinäjoki, Hämeenlinna, Vaasa, Kouvola
areas currently represent some 74% of the Finnish GDP and Lappeenranta. There are significant differences in the
and 72% of all jobs. economic performance and growth between these city
regions.
Urbanisation has been and will be a result of both internal
migration and immigration. Within Finland, moves are Population growth has and is expected to be fastest in the
weighted towards the young or working-age population, Helsinki region, which currently accommodates some 1.4
which increases the challenges for, for instance, maintenance million inhabitants. The main cities in the region include
of public service provision in regions suffering from negative Helsinki, Espoo and Vantaa, which, together with the smaller
migration. city of Kauniainen, form the Helsinki metropolitan area.
In recent years, the population of the Helsinki region has
been increasing by 17−19,000 inhabitants per annum, and,
“The largest city regions by 2050, the population is forecasted to increase to 1.7−1.8
show the strongest growth” million. The Helsinki region currently represents some 26%
Significance of 14 biggest city regions in Finland, % of total
Helsinki region The regions of Tampere, 14 biggest city regions
1 The Finnish economy
Turku and Oulu
Population (2016) 27.6 17.6 68.6
Jobs (2015) 32.3 17.6 72.2
Private-sector jobs (2015) 35.2 18.1 74.6
GDP (2015) 37.0 16.6 74.3
Research and development expenditure (2016) 47.4 29.1 91.3
Completed dwellings (2010-2016) 34.6 21.8 80.2
Source: Statistics Finland 18of Finland’s total population, 36% of the country’s total GDP Housing construction in main city
and 31% of all jobs, even as the land area represents only regions 2000-2016
1.2% of the whole country.
Helsinki Lahti
In relative terms, growth is expected to be the strongest in Tampere Joensuu
the Oulu region, whose population is expected to grow by Oulu Hämeenlinna
almost 14% – 35,000 people – between 2015 and 2030. In Turku Lappeenranta
the same period, the Tampere region is expected to grow Jyväskylä Pori
Kuopio Kouvola
by some 11% and Turku region by some 8%.
Seinäjoki Other
Vaasa
Due to the increasing urbanization, the newly elected
Mayor of Helsinki has started to promote co-operation and 7%
interaction between 21 largest cities in Finland. Cities in this
so called C21 group are all regional centres across Finland.
These cities comprise some 75% of the Finnish population,
78% of jobs and some 88% of value added.
25%
22% 30%
Residential demand in the main city 32%
regions 1%
Increasing urbanisation, demographic development and 2%
changes in housing preferences have a profound impact on 2%
housing markets in Finland. The demand for small, well- 2%
located apartments has increased both in owner-occupied 2% 9%
and rental housing markets, whereas the need for single- 3% 10%
family houses and large apartments has decreased. Between 2% 7%
3% 7%
2010 and 2015, some 80% of new dwellings have been 4%4%5%6%
3%
constructed in these city regions, and currently their share
of new construction is as high as some 90%.
Source: RT
In its study on residential demand by 2040, published in
2015, the VTT Technical Research Centre of Finland based
its forecasts on two different scenarios. In both scenarios,
the Finnish population is estimated to grow to 5.8 million Residential construction has increased markedly in recent
by 2040. In the “conservative” scenario, population growth years, especially in the largest cities. In 2017, residential
estimates are based on current regional structure. In the construction starts continued increasing significantly and
“urbanisation” scenario, migration to 14 main city regions amounted to some 40,000 dwellings. This is some 9% more
is estimated to accelerate, resulting in an increase of some than in 2016, which had already broken many records. New
625,000 inhabitants by 2040. development is concentrated on main cities, and on smaller
apartments in apartment buildings. Helsinki region alone
accounts for 46% of residential construction, and together
“Demand for housing is with the other three main city regions, the share increases
increasing in the main city to 70%. New development is boosted by strong investment
demand, which will result as increased supply of private
regions” rental housing in the main cities. Of the starts in 2017, some
15,000 dwellings are estimated to be built for private sector
In the latter scenario – which, according to VTT is more residential investment, and some 9,000 for subsidized rental
likely – the need for new dwellings would concentrate in housing markets.
14 main city regions, where almost 29,000 new dwellings
would be needed annually. In this scenario, the increase in Of all residential building permits in 2017, some 45% were
residential demand would be heavily weighted towards the applied in the Helsinki region. The other three main city
largest cities. The Helsinki region alone would represent regions – Tampere, Turku and Oulu – accounted for 9, 8
almost half of the increase. and 4% of building permits, respectively.
“The Helsinki region “Growth of the main cities
represents almost half of the boosts rental residential
1 The Finnish economy
increase in housing demand” development”
192 Institutional aspects
of the Finnish property
market
2.1 Two forms of property ownership In mutual real estate companies, rental agreements are made
between the shareholder and tenant, and the rental cash flow
In juridical terms, owning property in Finland means owning goes directly to the shareholder. Shareholders can use their
the land and the buildings on it. This is the basic form of shares in the company as collateral for loans.
direct property ownership. It is also possible to own only
the building and have a long-term lease agreement with the The mutual real estate or housing company is responsible
landowner, typically the municipality. Direct ownership and for the management of the property and upkeep of joint
land lease agreements are registered with the Land Register facilities, for which it collects a maintenance fee from the
maintained by regional District Survey Offices. shareholders. This fee is most typically based on the floor
area designated for each shareholder.
Transactions with real property are official legal acts that
have to be carried out according to a specific procedure. The company itself can also take out a loan, for example, for
These transactions are public in nature and are registered renovation and modernisation, and use the building and real
and published by the National Land Survey of Finland. estate as collateral. In these cases, the shareholders pay a
finance charge (rahoitusvastike) to the mutual company, which
In practice, it is very common for property ownership to then covers the loan to the original lender.
be organised through a limited company (a real estate/
housing company) founded for the sole purpose of owning The other type of real estate company is a standard limited
the property. In these cases, the legal owner of the real company (kiinteistöosakeyhtiö), founded for the purpose of
estate is the limited company, which may have one or several owning a certain property or properties. In these companies,
shareholders. The shares may be connected to a specific the shares are not connected to any specific premises.
apartment/amount of space on the property, entitling the Rental agreements are made between the tenant and the
shareholder to physical control and occupancy of these company, and the company is responsible for maintenance
premises. These types of companies are called mutual real and operating costs, which it covers with the rental income.
estate companies (“MREC”s; keskinäinen kiinteistöyhtiö). The real estate company can pay out dividends to its
This form of ownership is commonly used in both residential shareholders.
and commercial properties.
“Property ownership is
commonly organised as
mutual real estate companies”
2 Institutional aspects of the Finnish property market
The Housing Companies Act and Decree regulate mutual
real estate companies that operate in the housing sector
(asunto-osakeyhtiö). These regulations are always applied when
more than 50% of the area of the building is designated
for residential use. When establishing a mutual real estate
company for commercial property, shareholders can
choose either to apply the Housing Companies Act or the
normal legislation for limited companies (osakeyhtiölaki)
Photo: Skanska / © 2017, Kuvatoimisto Kuvio Oy
as the regulatory framework for the company. The Act
regulates, for instance, long-term planning of repairs and
the communication of these plans to shareholders, as
well decision-making procedures and responsibilities of
shareholders.
“In MRECs, rental
agreements are made
between the shareholder and
the tenant”
20Impact on market practices The ways transaction processes are carried out partly
Owning property through a mutual real estate company is a depend on the market situation. In recent years, high
more flexible form of ownership, for example in cases where investment demand has encouraged sellers to carry out
the ownership of a building is divided among several owners. extensive auction processes in order to find the best solution.
The transfer tax rate is also lower: 2% on the shares of the Before that, during the quiet years in 2009−2013, tailored
limited company versus 4% on direct property. Transactions approaches to identify the potential individual buyer were
are also less complicated compared to direct ownership of more common.
real estate.
The role of the advisor or property agent in the investment
The decision-making and management procedures of a process varies depending on the situation, characteristics of
mutual real estate company are defined in the company’s the asset and type of companies involved. In large portfolio
articles, which have to fulfil certain requirements set by transactions, the parties typically use extensive advisory and
law. An individual owner’s degree of control depends on corporate finance expertise, and implement thorough due
their share of ownership, unless otherwise agreed in the diligence procedures. In single asset transactions, newly
company by-laws. developed assets and transactions carried out between two
domestic parties, the advisor’s role is typically more limited.
Due to its flexibility and transparency, the mutual real
estate company is a common way to organise the ownership The current market conditions have also brought about
and management of property. In practice, the majority of new types of players in the market. In recent years, several
commercial property transactions in the Finnish market are new companies have been established, offering hands-on
made by transacting the shares of real estate companies. management services as well as sometimes acting as co-
These transactions are not public by law. investors. These companies mainly serve foreign investors
but also work with domestic institutions that are willing to
Legislation concerning renting and reorganize their property holdings.
transactions
Generally speaking, the Finnish legal system is simple and
liberal. In principle, there are no restrictions on buying or
selling real estate, but as real estate transactions are subject
“New types of players acting
to certain provisions, it is advisable to use real estate brokers as co-investors for foreign
or lawyers when entering into property transactions. and institutional investors are
emerging”
Transactions with housing or real estate company shares are
straightforward and simple. As soon as transfer taxes have
been settled, the purchaser can be registered as the owner Market entry of international investors has brought about
of the shares in the company’s registers. new approaches to due diligence processes, with typically
several types of experts – legal, technical, financial and
tax advisors – working together. This has resulted in an
increased supply of these services in the market.
“Finnish legislation
concerning renting and Rental practices
transactions is simple and Rental practices vary in the Finnish commercial property
liberal” market. The liberal legislation regulating leases gives parties
freedom to agree on terms and conditions.
2 Institutional aspects of the Finnish property market
Finnish legislation regulating rental agreements is among
the most liberal in the world and is based on the idea of
full freedom of agreement between two parties. There are
”Finnish rental agreements
no minimum or maximum lease terms, indexation is not are typically short and
regulated, there are no automatic rights for renewal, and provide flexibility for
break clauses are possible if agreed. Only in the residential tenants”
market do some restrictions exist to protect the tenant, but
even there, the legislation has very few restrictions compared
with most other countries.
A common term in Finnish lease agreements is “until further
notice”: an indefinite contract is valid until either the tenant
2.2 Market practices of property or the landlord wishes to terminate it after an agreed notice
investment and renting period, which is typically three, six or twelve months. These
indefinite lease terms are especially popular in multi-tenant
Property investment office buildings and smaller spaces. The landlord must,
Developments over the last decade in the Finnish property however, have an acceptable cause to terminate the contract.
market – which includes the emergence of new players, Rent adjustment, tenant mix changes, or rearrangement of
increased internationalisation, professionalism and more the property portfolio are among the conditions used to
sophisticated analysis – have resulted in new practices in justify lease termination.
property investment processes. This has also increased the
demand for specialist services in property transactions. In KTI’s rental database, measured by the number of
21 agreements, some 50% of all office agreements in theHelsinki metropolitan area are indefinite. Another 25%
of the agreements first have a fixed term of, for example, 3 “A landlord can recharge
or 5 years, after which they continue automatically for an maintenance costs separately
indefinite period – until further notice from either of the to the tenant”
parties. Measured by total space area, the share of fixed-term
lease agreements is larger, as fixed terms are often used in
larger premises. Despite their flexibility, indefinite leases Separate recharging of maintenance costs is also very typical
often last for long periods. for shopping centres, where also a separate service charge for
marketing and other shared expenses is typically recharged
to tenants.
“Indefinite lease terms are
common” In single-tenant buildings, it is more common to apply net
rents, where the tenant is responsible for maintenance costs.
In net rents, the responsibility for taxes, insurances and
When fixed terms are used, the contract periods are refurbishments can be agreed freely between the parties.
typically quite short compared with many other countries.
In multi-tenant office buildings, a typical fixed term is from
three to five years. “When net rents are applied,
For larger units, longer fixed-term agreements are commonly
the responsibility for taxes
applied. For a purpose-built, single-tenant office building, and insurances can be agreed
a net lease of ten years or more is common. Agreements freely”
in large single-tenant buildings in, for example, sale-and-
leaseback arrangements, often have lease terms of up to
20 years. Rents can be indexed freely in all indefinite leases and in
fixed-period leases where the term exceeds three years. The
Tenants’ rights are quite limited in the commercial property Consumer Price Index is the most commonly used index.
market – for example, a tenant has no statutory right to a
lease renewal. Some 20-25% of rental agreements in shopping centres are
turnover-based. These usually consist of a minimum base
Traditionally, rental agreements are for “gross rent”, which rent supplemented by an agreed share of turnover. However,
includes net rent plus a service charge covering typical the turnover-based part of the rent is typically quite low, as
operating costs and minor repairs.1 Gross rents are very the landlord wants to secure a stable base for their cash-flow.
common in multi-tenant buildings in all property types. In some – but very few – cases the rent may be solely based
Measured by number of agreements, some 85% of office on the tenant’s turnover.
agreements in the KTI rental database are for traditional
gross rent. In many cases in the remaining 15%, the landlord In over-supply situations, various means to attract and
recharges the maintenance cost separately to the tenant. This retain tenants can be applied. For instance, landlords may
both encourages the tenants for savings in costs and hedges offer rent-free periods, stepped rent increases and tenant
the landlord against the increases in operational costs, which improvements for new tenants, among other things. This has
in recent years have increased more than overall inflation. been clearly seen, for instance, in the Helsinki metropolitan
Distribution of office lease agreements Distribution of office lease agreements
2 Institutional aspects of the Finnish property market
in the Helsinki metropolitan area, in the Helsinki metropolitan area,
sqm number of lease agreements
25% 30% 25% 30%
30% 34% 24%
Fixed term Fixed term
Fixed + until 50% Fixed + until
further notice 7% further notice 7%
9% Until further notice Until further notice
9%
9% 26%
36%
7% 7%
4% 6% 4% 6%
Source: KTI Rental database Source: KTI Rental database
1
Gross rents are where the land rent, insurance, property taxes and operational expenses are paid by the owner. This means that management and maintenance
costs for both indoor and outdoor areas of the building are the owner’s responsibility. This is also the case with heating, water and waste disposal. With regards
to cleaning and electricity, the owner is typically responsible for the public areas of the building, and tenants have their own electricity and cleaning agreements 22
regarding the space they use. The owner is responsible for repair and replacement costs if caused by normal wear and tear.Typical leasing practices in Finland
Sector Shopping High street Super- Offices, Offices, Industrial, Residential
centres shops markets multi-tenant single-tenant logistics
Lease term 5-15 3-10 / until 10-15 3-5 / until 10-20 5-15 Until
further notice further notice further notice
Basis for rent Space area / Space area Space area Space area Space area Space area Space area
turnover
Rental payments Monthly Monthly Monthly Monthly Monthly Monthly Monthly
Indexation Cost of living Cost of living Cost of living Cost of living Cost of living Cost of living Cost of living
Rent review Annually Annually Annually Annually Annually Annually Annually
Internal repairs Tenant / Tenant Tenant Tenant / Tenant Tenant Landlord
landlord landlord
External repairs Landlord Landlord Tenant Landlord Tenant Tenant Landlord
Building insurance Landlord Landlord Tenant Landlord Tenant Tenant Landlord
Property taxes Landlord Landlord Tenant Landlord Tenant Tenant Landlord
The cost-of-living index 1951:10 =100 is a long time series calculated from the latest consumer price index (currently consumer price index 2000 = 100) and its
development, therefore, follows the consumer price index. Many rents, such as those on dwellings, business premises or land, are usually tied to the cost-of-living index.
From the user’s point, the cost-of-living index is the most usable one, because index revisions do not interrupt the series and the point figures of the cost-of-living index
are published monthly at the same time as the consumer price index. (Statistics Finland)
area office markets in recent years, when an increase in The Land Use and Building Act obligates municipalities to
supply has coincided with decreasing demand. However, adopt an open and interactive approach to planning. The
the impact of these terms on the overall rental levels and local planning process is aimed at facilitating the involvement
markets is very difficult to capture in statistics. of all those concerned in planning: landowners, residents
and businesses in the area.
2.3 Planning Building permits are approved by municipalities. A building
permit may be granted if the plan allows the type and size of
Land use in Finland is regulated by the Land Use and Building building that is being applied for. Special permits to exceed
Act. The system has three levels of land use plans: a regional the building right or change the use of the property can also
land use plan, a local master plan and detailed local plans. be granted, although these are typically difficult to obtain,
Further provisions and guidelines concerning building are and permit processes typically take a long time. Obtaining
issued in the National Building Code of Finland, which was a permit for a temporary change of use – for instance, for
reformed as of beginning of 2018. using an office building for temporary housing – is usually
easier to get. The maximum period for this kind of temporary
National principles for land use and regional structure are use is five years.
defined by the Council of State. These national principles of
land use are reflected in the regional plans, which embrace In practice, municipalities compete with each other by
structural, functional and environmental considerations. using planning and land use issues to attract taxpayers –
Regional plans are drawn up and approved by Regional both companies and residents – and employers, which can
Councils, who, since the beginning of 2016, also have the sometimes impact planning decisions.
powers to confirm the plan.
The current government is aiming to simplify the regulation
Regional plans and steering of land use is one of the tasks concerning land use and planning and thereby speed up
2 Institutional aspects of the Finnish property market
that will also be moved to the new 18 counties in 2020. They the planning and construction permit processes. First steps
will take over the tasks of the current ELY centres (Centres were taken in the beginning of 2016, when the authority
for Economic Development), which currently promote and for confirming regional plans was moved from the Ministry
steer planning and land use as well as Regional Councils, of the Environment to Regional Councils. Some other,
who are currently responsible for regional plans. mostly minor, changes came into force in 2017, whereby,
for instance, permanent use of second homes was made
easier, and the rules for exceeding building rights were
changed. The complaint processes were also made faster,
“Regional reform will and rights for complaints will be limited. Business-wise,
also impact land use and the most significant reform concerns regional control and
planning” coordination over the plans and building permits for large
retail units.
The local master plan is an instrument for guiding and The current legislation emphasises the position of the city
coordinating land use at a general level. It is produced by local centre as the location for retail; outside this, large retail
authorities, but needs to follow the guidelines of the regional units can only be developed in locations with good public
plans. Detailed local plans are used to regulate the building traffic connections, which have to be designated in the
and formation of the physical townscape. In addition, every plan. In the legislation, the concept of “large” was increased
local authority has its own building ordinance, the content of to 4,000 sqm in 2017 for units with local coverage area.
which is defined according to local needs. In the current act, This means that stores below this limit can be built in areas
local authorities have extensive powers to make independent designated for common commercial construction, without
23 decisions in land use planning matters. any specific reservations in the plan. This will markedlyYou can also read